

Abstract
Glioblastoma multiforme (GBM) is the most aggressive form of astrocytoma accounting for a majority of primary malignant brain tumors in the United States. Chondroitin sulfate proteoglycans (CSPGs) and their glycosaminoglycan (GAG) side chains are key constituents of the brain extracellular matrix (ECM) implicated in promoting tumor invasion. However, the mechanisms by which sulfated CS-GAGs promote brain tumor invasion are currently unknown. We hypothesize that glioma cell invasion is triggered by the altered sulfation of CS-GAGs in the tumor extracellular environment, and that this is potentially mediated by independent mechanisms involving CXCL12/CXCR4 and LAR signaling respectively. This was tested in vitro by encapsulating the human glioma cell line U87MG-EGFP into monosulfated (4-sulfated; CS-A), composite (4 and 4,6-sulfated; CS-A/E), unsulfated hyaluronic acid (HA), and unsulfated agarose (AG; polysaccharide) hydrogels within microfluidics-based choice assays. Our results demonstrated the enhanced preferential cell invasion into composite hydrogels, when compared to other hydrogel matrices (p<0.05). Haptotaxis assays demonstrated the significantly (p<0.05) faster migration of U87MG-EGFP cells in CXCL12 containing CS-GAG hydrogels when compared to other hydrogel matrices containing the same chemokine concentration. This is likely due to the significantly (p<0.05) greater affinity of composite CS-GAGs to CXCL12 over other hydrogel matrices. Results from qRT-PCR assays further demonstrated the significant (p<0.05) upregulation of the chemokine receptor CXCR4, and the CSPG receptor LAR in glioma cells within CS-GAG hydrogels compared to control hydrogels. Western blot analysis of cell lysates derived from glioma cells encapsulated in different hydrogel matrices further corroborate qRT-PCR results, and indicate the presence of a potential variant of LAR that is selectively expressed only in glioma cells encapsulated in CS-GAG hydrogels. These results suggest that sulfated CS-GAGs may directly induce enhanced invasion and haptotaxis of glioma cells associated with aggressive brain tumors via distinct mechanisms.
Keywords: Glioblastoma, chondroitin sulfate glycosaminoglycans, invasion, haptotaxis
1.0 Introduction
Glioblastoma multiforme (GBM) is the most aggressive form of astrocytoma that accounts for the majority of primary malignant brain tumors among adults in the United States1. The spread of GBM involves the diffuse invasion of single glioma cells along blood vessels and white matter tracts in brain tissue2. The tumorous growth penetrates through key functional regions of the brain, and culminates with the formation of a large GBM mass surrounded by invasion along white matter tracts into nearby brain structures3. Eventually, these brain tumors outgrow the limited space available in the brain and disturb other precious structures, rendering cognitive and motor processes damaged. Complete surgical resection is often the first course of action, but current therapies are ineffective in destroying migrating cells after they have left the de novo tumor mass4–6.
The mechanism of glioma invasion is unknown. Primary glial cell tumors and early glial precursors possess the ability to invade through brain tissue, which is otherwise resistant to tumor invasion7. Primary glial tumors also rarely metastasize outside the brain8. This evidence points to a specialized glial cell interaction with the brain tissue extracellular matrix (ECM) that may directly induce glioma cell invasion. Cellular migration includes adhesion factor expression, cytoskeletal rearrangement, and secretion of ECM-remodeling enzymes9. Recent evidence suggests that cell-ECM interactions trigger the formation of invadopodia and cytoskeletal modifications, both of which are indicators of invasion10, 11.
Brain extracellular matrix (ECM) molecules play an important role in regulating cell migration throughout development, and aberrant ECM conditions can directly promote cancer cell migration12–14. Healthy brain parenchyma is composed mostly of CSPGs and hyaluronic acid (HA), along with a smaller component of fibrillar proteins such as laminins, collagens, and fibronectin15. CS-GAGs side-chains consisting of N-acetyl-D-galactosamine and D-glucaronic acid repeating disaccharide units are directly linked to the CSPG core protein. CS-GAGs linked to CSPGs are known to bind and organize brain ECM, regulate neuronal outgrowth, and provide trophic factor retention16. The majority of CS-GAGs in the brain consist of chondroitin-4-sulfate (CS-A) with smaller percentages of chondroitin-6-sulfate (CS-C) and chondroitin-4,6-sulfate (CS-E)17. However, this composition is dramatically altered immediately around invasive brain tumors, which have been reported to upregulate CSPGs and enzymes that affect sulfation patterns of CS-GAGs18, 19. Although the upregulation of CSPGs around invasive brain tumors has long been reported, the precise role of sulfated CS-GAGs in promoting glioma invasion has not yet been elucidated. An abundance of oversulfated CS-GAGs in the brain tumor microenvironment combined with their ability to bind cell-motility and adhesion factors20–23, is suggestive of a potential CS-GAG sulfation-driven mechanism that contributes to brain tumor invasion.
Primary brain tumors spread towards new areas with desirable environmental conditions for growth, and this navigation is guided by tissue composition and extracellular haptotactic signals24. The chemokine CXCL12 (stromal-derived factor-1alpha (SDF-1α) has been previously reported to bind to the cell-surface receptor CXCR4 to induce the growth of glioma cells25, 26. CXCL12 is found along white matter tracts and blood vessels in the brain, providing glioma cells with a haptotactic roadmap to invade through the brain interstitial matrix27. The CXCR4 receptor has been documented as being highly expressed in GBMs and identified as a regulatory element in glioma invasion, with the brain microenvironment potentially playing a role in glioma cell interaction with CXCL1228–31. Since sulfated CS-GAGs interact with ECM proteins and influence cellular processes, the formation of a complex between sulfated CS-GAGs and the CXCL12 protein has the potential to initiate or mediate glioma cell invasion.
Cancer cells are also known to bind CSPGs through the leukocyte common antigen-related (LAR) subfamily of receptor protein tyrosine phosphatases, known for their role in regulating cellular proliferation and adhesion32. LAR receptors have been implicated in malignant breast cancers and can potentially bolster the interaction of glioma cells with the CS-GAG rich brain ECM to promote invasion. Unregulated activity from overexpression of LAR receptors could contribute to neoplastic generation or stimulate diffuse single cell migration deeper into the brain via independent signaling mechanisms.
In this study we used a novel microfluidics-based in vitro assay platform to elucidate the specific relationship between CS-GAG sulfation and glioma cell invasion. We performed rigorous physical and mechanical characterization of sulfated CS-GAG, unsulfated HA, and unsulfated AG hydrogel matrices to ensure uniformity of their biophysical and biomechanical properties. We quantified cell migration and haptotaxis of human glioma cells encapsulated within different hydrogel matrices to determine the influence of the extracellular microenvironment on cell invasion. Enzyme linked immunosorbent assays (ELISAs), were used to evaluate specific binding affinities of CXCL12 to immobilized unsulfated, monosulfated, and disulfated GAGs. Finally the expression levels of CXCL12, CXCR4, and the CSPG-binding LAR-receptor protein tyrosine phosphatase (RPTP) transcripts in cells encapsulated in different hydrogels were investigated using qRT-PCR assays and western blotting.
2.0 Experimental Procedures
2.1 Synthesis of Methacrylated Monosulfated Chondroitin Sulfate (mCS-A), disulfated Methacrylated Chondroitin Sulfate (mCS-E) and Hyaluronic Acid (mHA)
CS-A hydrogels were fabricated using a mixture of CS-A/C/E powder (86% CS-A; 5% CS-C; 6% CS-E) derived from bovine trachea (Sigma Aldrich, MO), and using methods as described previously33, 34. Briefly, 500 mg of CS powder was dissolved in 50 mM 2-morpholinoethanesulfonic acid (MES; Sigma Aldrich) buffer (pH 6.5) with 0.5 M NaCl. 45.6 mM EDC (Thermo, IL) was added to activate carboxylic groups on glucuronic acid residues of CS, along with 22.8 mM NHS (Thermo, IL) to control carbodiimide crosslinking between the carboxyl groups on CS and the amine group of AEMA. 22.8 mM AEMA (Polysciences Inc., PA) was added and the reaction was allowed to proceed for 24 h. The next day, the product was precipitated by adding 1:1 ratio of acetone then rotary evaporated to dryness. The dried mCS was dissolved in deionized water to the original volume and dialyzed for 3 days using 1000 MWCO dialysis tubing (Spectrum Laboratories Inc., CA). The dialyzed product was lyophilized and stored in desiccant at −20°C until used. The resulting mCS-A was used to make 2% w/v CS-A hydrogel with 0.05% 2-hydroxy-4′-(2-hyroxyethoxy)-2-methylpropiophenone (Irgacure-2959, Sigma Aldrich) in DMEM/F-12 (Corning, NY), then crosslinked upon exposure to 365 nm UV light (160 BlakRay UVP, CA).
The monosulfated CS-A was used to synthesize the disulfated semisynthetic (ssCS-E) as described previously35. The CS powder was dissolved in formamide, and triethylamine sulfur trioxide was added to the solution. The reaction was heated to 60°C and allowed to proceed for 24 hours with vigorous stirring under an argon blanket. Afterward, 95% aqueous ethanol was added and the mixture was held at room temperature for 30 minutes. To modify the reaction conditions, 1% aqueous NaCl was added, and the pH was adjusted to 7 with 2M NaOH. After dialysis, the solution was lyophilized to yield crude sulfated product. The crude product was dissolved in 16% aqueous NaCl and ethanol was added. After centrifugation at 4000 rpm, the pellet was re-suspended in deionized water and the solution was dialyzed. The percentage conversion of CS-A to ssCS-E was confirmed using strong anion exchange HPLC (SAX-HPLC) as described previously33, and as depicted in Supplementary Figure 1. The dialysate was lyophilized, and the ssCS-E was methacrylated using the same procedure as described for the methacrylation of monosulfated mCS-A. The composite CS-A/E gels used in cell assays consisted of 2% w/v CS-A with 15%CS-E, 0.05% Irgacure-2959 in DMEM/F-12, and exposed to 365 nm UV light.
Unsulfated high-molecular-weight HA from rooster comb (Sigma Aldrich, MO) was dissolved in DI water and autoclaved for 1 hour to partially hydrolyze the HA to low-molecular-weight HA as described previously33. The resulting HA was then dialyzed against water for two days, and the dialysate was frozen at −80°C and lyophilized for three days. The resulting HA was methacrylated according to the same procedure used to methacrylate CS-A as described above. The resulting mHA was reconstituted in DMEM/F-12 as 0.5% w/v HA with 0.05% Irgacure-2959, before exposure to 365 nm UV light.
2.2 Scanning Electron Microscopy (SEM)
The microarchitecture of lyophilized hydrogels was observed using a Zeiss 1450EP scanning electron microscope (Zeiss, NY). Hydrogels were cast in a tissue cryopreservation mold, flash frozen in liquid nitrogen, then lyophilized for 24–48 hours. Lyophilized gels were mounted on 10mm stubs and sputter coated with gold for 60 seconds in a Module Sputter Coater (SPI, PA) before being imaged at 20 kV. Images were acquired at 500X and 1000X magnifications to observe the pores and structure of hydrogels. ImageJ software was used to calculate pore size based on 500X images.
2.3 Rheological Testing of Photocrosslinked mCS, mHA and Agarose Hydrogels
mCS (2% w/v), mHA (0.5% w/v), and agarose (0.5% w/v) were reconstituted in deionized water, and crosslinked by exposure to 365 nm UV exposure within tissue cryopreservation molds to yield hydrogels of ~3 mm thickness. The gels were cut into 16mm diameter disks with a biopsy punch and left to incubate in 1 mL of PBS overnight at 37°C to fully swell before rheological testing. Rheological testing of hydrogels was performed using a parallel plate rheometer (Anton Paar, CA) equilibrated to 37°C. Frequency sweep experiments were performed from 0.1–100 Hz and 5% strain, and in triplicate.
2.4 Cell Culture
U87MG-EGFP human-derived glioblastoma cells were cultured in media consisting of DMEM/F-12 (Corning, NY) supplemented with 10% fetal bovine serum (Corning, NY), and 1% penicillin-streptomycin; and under 37°C and 5% CO2 incubation. Cells were fed with supplemented media every other day unless passaged or extracted for use in assays.
2.5 Cell Viability Assays
5 × 10⁵ U87MG-EGFP cells were encapsulated into hydrogels and left in incubation for 48 h before staining with Calcein Blue AM (Thermo Fisher, MA) according to manufacturer’s instructions. Live cells emitting blue fluorescence were compared to GFP-expressing live or dead cells, and to brightfield images of cell morphology to quantify viability across sampled images. Images were analyzed using a Leica DM IRB series microscope (Leica Microsystems, Inc., IL). Cell viability was assessed using colocalization of Calcein blue fluorescence to GFP green fluorescence in 20X images for at least four images per hydrogel sample, using cell colocalization tools associated with Volocity software (PerkinElmer, MA).
2.6 Microfluidics Device Fabrication and Preparation
The microfluidic device was fabricated through standard soft-lithography methods using polydimethylsiloxane (PDMS) in a 10:1 weight ratio with curing agent (Dow Corning, MI). Device pattern was designed after a previously described microfluidic platform to study tumor cell intravasation with minor modifications36. A mask of the device pattern was created using AutoCAD and printed by a commercial photo-plotting company (CAD/Art Services, OR). After cross-linking the polymer for 2 hours at 72°C, and punching the wells with a 4 mm biopsy puncher (Miltex, Inc., PA), device surfaces were bonded with a microscope cover glass after plasma surface treatment (Harrick Plasma, NY) with 18 W power for 30 seconds at 11.2 Pa O2 partial pressure. Each device had three microfluidic channels with trapezoidal barriers between channels. The shape and dimension of channels was chosen to accommodate the quantification of cell choice and migration. Each channel was 10 mm in length and 1000 μm in width with 5 mm wells in diameter. Thickness of the device was measured to be 150 μm by a profilometer (Veeco Instruments Inc., PA). 300 μm trapezoidal barriers lined the junctions where two channels meet, with 100 μm spaces between barriers, to keep hydrogel constituents within the seeded channels and to restrict cell influx into adjacent channels (Supp. Fig. 2). Each device was coated in poly-D-lysine (PDL) overnight (Sigma Aldrich, MO), then baked at 80°C for 48 hours to restore hydrophobicity. Devices were then kept at 4°C until use.
2.7 U87MG-EGFP Encapsulation and Cell Migration Studies
Individual 14 mm glass-bottom cell culture dishes were used for sandwich cell encapsulations for viability study. Bilayer hydrogels were made from either 0.5% agarose (SeaPlaque, Lonza, NJ), 2% mCS-A, 2% mCS-A/E (2% COMP) or 0.5% mHA (all dissolved in DMEM/F-12). Cells were cultured as described above and 50,000 cells were encapsulated in each hydrogel. The mCS-A, mCOMP, and mHA were combined with 0.05% photocrosslinker before being exposed to 365 nm UV light for 45 seconds each. All assays were done in triplicate. Encapsulated cells were fixed at 24 hours using 4% paraformaldehyde in 0.4 M sucrose solution. Immunohistochemistry was performed to evaluate cellular production of focal adhesion kinase and vinculin. Cells were Hoechst-stained before hydrogel encapsulation. Imaging was done using a Leica DM IRB series microscope (Leica Microsystems, Inc., IL).
To evaluate cell migration through microfluidics devices, choice assays were designed to evaluate cell preference between two separate hydrogels. Hydrogels were seeded into the side wells of the devices and gentle suction was used to pull the gel through the channel. Once gels filled the respective channel, they were either allowed to cool (agarose) or exposed to UV light for 15–20 seconds (mCS-A, mCS-A/E or mHA). U87MG-EGFP cells in media were Hoechst-stained and then 20,000 cells were seeded into the middle channel of the devices, using gentle suction to pull the cells in media all the way through the channel and not disturb the side channels full of hydrogels. Devices were put into incubation for 6 hours before imaging using wide field epifluorescence imaging using a Leica DM IRB series microscope (Leica Microsystems, Inc., IL). All assays were performed in triplicate. Tiled images were taken using 10X magnification and quantifications were performed using Volocity software (Perkin Elmers, MA) to analyze migrating cells moving through only the hydrogel-laden channels and ignoring the middle cell culture channel. Inserts were taken at 20X magnification. Devices were fixed using 4% paraformaldehyde in 0.4 M sucrose solution. Staining for Focal Adhesion Kinase (FAK) and Vinculin was done using two-part antibody staining (Thermo Fisher, MA). Staining for F-actin polymerization was performed using Texas Red-X Phalloidin (Thermo Fisher, MA).
2.8 Haptotaxis Assays
Prior to conducting the CXCL12 haptotaxis assays, the uniform diffusion of the chemokine through the different hydrogel matrices was ascertained. In order to accomplish this, sulfated and unsulfated hydrogel matrices were cast in the microfluidic devices as described above and incubated with a 50 μl solution of PBS containing 10ng/ml of Alexa Fluor 488-conjugated aprotinin, which has the same molecular weight (~8 kDa) as CXCL12. The diffusion of fluorophore conjugated aprotinin through the different sulfated and unsulfated hydrogels matrices was quantified at the end of 0, 3, and 6 h post-introduction and the fluorescence intensity quantified using methods described below.
The microfluidics platform was subsequently used to evaluate cell haptotaxis in response to CXCL12 presence. Each hydrogel type was tested in three microfluidics devices, where the same hydrogel was placed into both side channels with one side receiving 10 ng/mL CXCL12 (R&D Systems, NE) and the other side receiving media only. 20,000 cells in media were seeded into the middle channel. Devices were imaged at zero, three, and six hours to evaluate cellular haptotaxis response across AG, HA, CS-A and COMP hydrogels. Tiled images were taken using 10X magnification on a Leica DM IRB series microscope and quantifications were performed using Volocity software (PerkinElmer, MA) to analyze migrating cells moving through the hydrogel-laden channels. Devices were fixed using 4% paraformaldehyde in 0.4 M sucrose solution. Proof of a protein gradient was established using Alexa Fluor 488-conjugated Aprotinin (Thermo Fisher, MA and Sigma Aldrich, MO respectively) at zero, three, and six hours using Volocity software to calculate fluorescence within the channels of the microfluidics devices.
2.9 Sandwich ELISA
Specific binding of CXCL12 to immobilized CS-A and COMP was evaluated using a sandwich ELISA assay. The wells in the 96-well NeutrAvidin-coated plate (Thermo Fisher, MA) were washed with 1X PBS, then were blocked with 1%BSA in 1X PBS for one hour. After another wash step, biotinylated GAGs were added in a 1:10 ratio in PBS to each well and left overnight at 4°C. Control wells received no GAGs, only PBS. Next day the plate was blocked with 1%BSA, 5%sucrose, and 0.05% Tween 20 in PBS for one hour. After a wash step, 0–200nM concentrations of CXCL12 (R&D Systems, ND) were added on top of each treatment for one hour. After a wash step, a 1:100 dilution of anti-CXCL12 antibody (R&D Systems, ND) in PBS was added to wells for two hours. Wells were washed, then a 1:50k dilution of HRP conjugated secondary antibody (R&D Systems, ND) was added. Another final wash step was done, TMB Buffer (Thermo Fisher, MA) was added and after 30 minutes 2M sulfuric acid was added as stop solution to measure absorbance of the plate at 450nm.
2.10 Western Blotting
100k U87MG-EGFP cells were encapsulated in 2% CS-A, 2% COMP, 0.5% HA or 0.5% AG hydrogels, along with a media only control cultured as described above for 72 h. Cell lysates were extracted using 1X Mammalian Protein Extraction Buffer (GE Healthcare Life Sciences, PA) containing cOmplete ULTRA protease inhibitor cocktail (Sigma Aldrich, MO). 50 μg of total cell lysate protein each obtained from glioma cells subjected to media only (M), AG, HA, CS-A, and COMP treatments were resolved through a 4–20% gradient gel (Bio-Rad Mini Protean TGX Gels, CA), and subsequently transferred to pure nitrocellulose membranes (Osmonics Inc, MN). After transfer, blots were allowed to dry for two hours, then rehydrated in 1X TBS for 2 min. Membranes were blocked for 1 h with Odyssey TBS Blocking Buffer (LI-COR, NE), then placed in primary antibody solution containing the primary antibody, Odyssey TBS Blocking Buffer, and 0.02% Tween-20 and left at 4 °C overnight with gentle shaking. Primary antibodies used include: anti-CXCL12 (R&D Systems, NE), anti-CXCR4 (Thermo Scientific, CT), anti-LAR (BD Biosciences, CA), and anti-GAPDH (Abcam, MA). After removing primary antibody solution, membranes were washed with Odyssey TBS Blocking Buffer + 0.02% Tween-20, then overlaid with Odyssey TBS Blocking Buffer + 0.02% Tween-20 containing Odyssey IRDye 680RD (LI-COR, NE) for 1 h. Membranes were then washed with 1X TBS + 0.02% Tween-20, and then 1X TBS. Membranes were kept in 1X TBS until imaging using the LI-COR Odyssey CLx at 700 nm.
2.11 qRT-PCR
Total RNA was isolated using RNeasy Plus Mini kit (Qiagen, CA) from cells encapsulated in 2% CS-A, 2% COMP, 0.5% HA or 0.5% AG hydrogels after 72 h. Following genomic DNA elimination (Qiagen, CA) and following manufacturer protocol, cDNA was synthesized using the RT First Strand kit (Qiagen, CA). A total of 100 ng total RNA equivalent of cDNA template was used in 25 μL qRT-PCR reactions for each group along with SYBR green dye (Qiagen, CA), and primers targeting human CXCL12 (CXCL12, PPH00528B, NM_000609), human CXCR4 (CXCR4, PPH00621A, NM_001008540), and LAR (LAR, PPH02317F, NM_002840); and the endogenous housekeeping genes GAPDH and HPRT1 (GAPDH, PPH00150F, NM_001256799; HPRT1, PPH01018C, NM_000194), and amplified using a ABI 7900HT machine (Applied Biosystems, CA) using conditions described previously33, 37. Each sample was assayed in triplicate for both target and endogenous controls using cycle conditions: 95°C for 10 minutes, 40 cycles of 95 °C for 15 seconds, and 60 °C for 1 minute followed by a melting curve analysis. Relative quantitative gene expression was appraised using the ΔΔCT method. The levels of the target gene expression was calculated after normalization to media–only control and against endogenous controls for each sample and then presented as relative units. A greater than 2 fold increase in expression of CXCL12, CXCR4, or LAR when compared to media-only controls was considered significant.
2.12 Statistical Analysis
For all migration and haptotaxis experiments, precise cell counting, fluorescence quantification, and colocalization protocols were used in Volocity software to analyze raw data. All analyses for across-group variation were performed using one-way analysis of variance (ANOVA) for significance (p<0.05) with appropriate post-hoc tests using SigmaPlot software. Direct mean comparisons were evaluated using t-tests. All studies were performed in triplicate at the minimum.
3.0 Results
3.1 Biomechanically optimized hydrogel-based brain ECM mimics facilitate the assessment of glioma cell behavior in vitro
In order to evaluate glioma cell behavior in response to specific ECM components, and to prevent the confounding effects of varying biomechanical properties of hydrogel-based ECM mimics on cell behavior, we performed rigorous characterization of hydrogel porosity and elastic modulus. 0.5% (w/v) agarose, 0.5% (w/v) hyaluronic acid and 2% (w/v) monosulfated CS hydrogels demonstrated similar pore sizes, with the average pore size ranging between 25 and 45 μm2 (Fig. 1A & 1B). The hydrogel types tested displayed comparable storage moduli across a standard angular frequency sweep range of 0–100 rad/sec (Fig. 1C). The storage moduli obtained for the different hydrogel types tested were comparable to that of CNS tissue, which can range in storage modulus between <100 to a few hundred Pascal38. The U87MG-EGFP glioma cells encapsulated in AG, HA and CS hydrogels demonstrated a mean survival of ~85% as indicated by the calcein blue+ cells co-expressing GFP 48 h post hydrogel encapsulation (Fig. 2).
Fig.1.
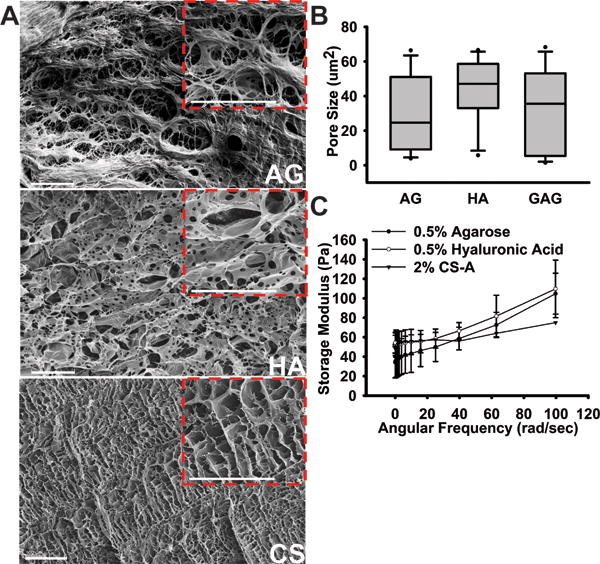
Evaluation of the biomechanical properties of hydrogel matrices. (A) 500X and 1000X (insert) magnification images of 0.5%AG, 0.5%HA, and 2%CS-A hydrogels showing relative porosity. Scale bars = 100 μm. (B) Pore size measurements done through quantitative ImageJ analysis shows comparable pore sizes in each hydrogel model. (C) Storage modulus measured using a parallel-plate rheometer over a standard 0–100 rad/sec frequency sweep for all hydrogels.
Fig. 2.
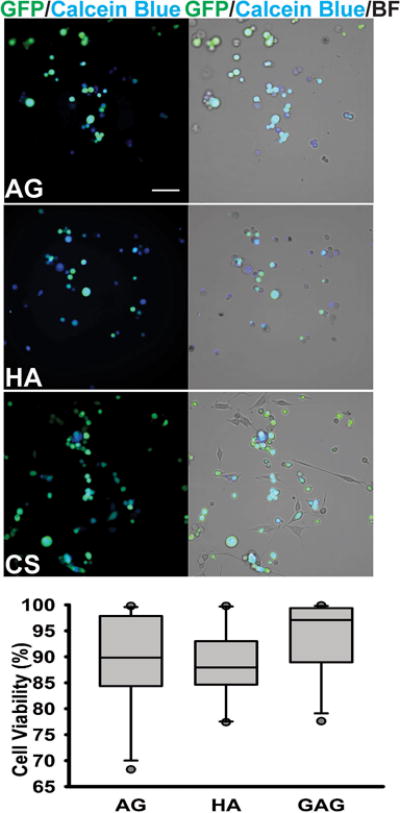
Viability assessment of cells encapsulated into different hydrogel matrices, as determined by a Calcein Blue AM assay 48h post-encapsulation. Representative 20X GFP/Calcein Blue and 20X GFP/Calcein Blue/Brightfield images of cells encapsulated in 0.5%AG, 0.5%HA, and 2%CS-A hydrogels. Scale bar = 50 μm. No significant differences in % live cells were observed between the three groups, as determined by a one-way ANOVA.
3.2 U87MG cells demonstrate significantly greater infiltration into sulfated CS-GAG hydrogels when compared to other hydrogel matrices
To assess the glioma cell preference for sulfate-rich environments, we modified the design of a three channel microfluidics platform as described below to present U87MG cells seeded in the central channel with a “choice” between a sulfated CS hydrogel, and an unsulfated hydrogel control (Fig. 3A). The number of cells in each of the two hydrogel types was quantified after 6 h, which represented the earliest time-point at which differences in glioma cell infiltration could be determined. Results from these assays demonstrate that a significantly greater percentage (p<0.05) of glioma cells infiltrated into sulfated CS-GAG hydrogels when compared to either unsulfated AG or HA hydrogels (Fig. 3A). When a head-to-head comparison of monosulfated CS hydrogels to COMP CS hydrogels was conducted, a significantly greater (p<0.05) percentage of the seeded glioma cells were found to infiltrate into the COMP hydrogels when compared to the monosulfated CS hydrogels (Fig. 3A). Immunocytochemical analyses of the focal adhesion (FA) adaptor protein vinculin and FAK demonstrated that a significantly (p<0.05) higher percentage of glioma cells encapsulated in sulfated CS-GAG hydrogels showed a significantly (p<0.05) higher percentage of colocalization of these cytoskeletal proteins when compared to unsulfated AG or HA hydrogels (Fig. 4B). No-significant differences in the expression of these proteins was observed in glioma cells encapsulated in monosulfated CS-A hydrogels when compared to composite CS hydrogels (Fig. 4B). A significantly higher (p<0.05) percentage of glioma cells encapsulated within the sulfated CS-GAG hydrogels demonstrated the presence of polymerized filamentous actin (F-actin) when compared to cells encapsulated in unsulfated AG or HA hydrogels (Fig. 4D). No significant differences in F-actin polymerization were observed when glioma cells encapsulated in monosulfated CS-GAG hydrogels were compared to those encapsulated in COMP CS-GAG hydrogels (Fig. 4D). In conjunction with increasing cytoskeletal remodeling, the morphology of cells encapsulated in CS-GAG hydrogels displayed increasing cytoplasmic prolongations into the surrounding 3D matrix (Supp. Fig. 3).
Fig. 3.
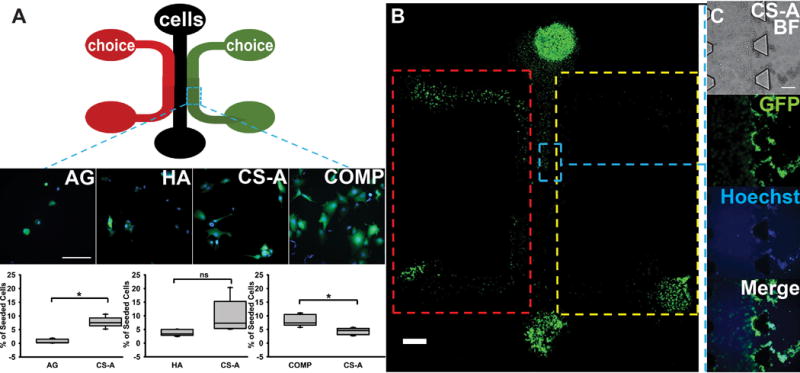
Microfluidics-based evaluation of cellular preference of hydrogel environment. (A) Schematic of three-channeled PDMS microfluidic devices. Channels are 1000 μm in width, with 100 μm trapezoidal barriers between channels and 4 mm diameter wells. Cells were seeded into center channels, with hydrogel choices placed into right and left channels. Representative 40X oil images of GFP/Hoechst-stained cells from each hydrogel channel shown below. Scale bar = 100 μm. Quantification of cell migration into from each type of choice assay was performed across n=4 for each choice. All choice assays were performed against the monosulfated CS-A. Significant differences were represented by ‘*’ indicating p<0.05. No significance is represented by ‘ns.’ (B) A 10X tiled image showing cell invasion into hydrogel choices. Areas represented by ROIs (red and yellow) indicate hydrogel channel and exclude cell-containing center channel. Scale bar = 1000 μm. (C) Blue ROI represents trapezoidal barriers, with 10X representative images of cells infiltrating into CS-A hydrogels at 6 h post cell-seeding. Scale bar = 100 μm.
Fig. 4.
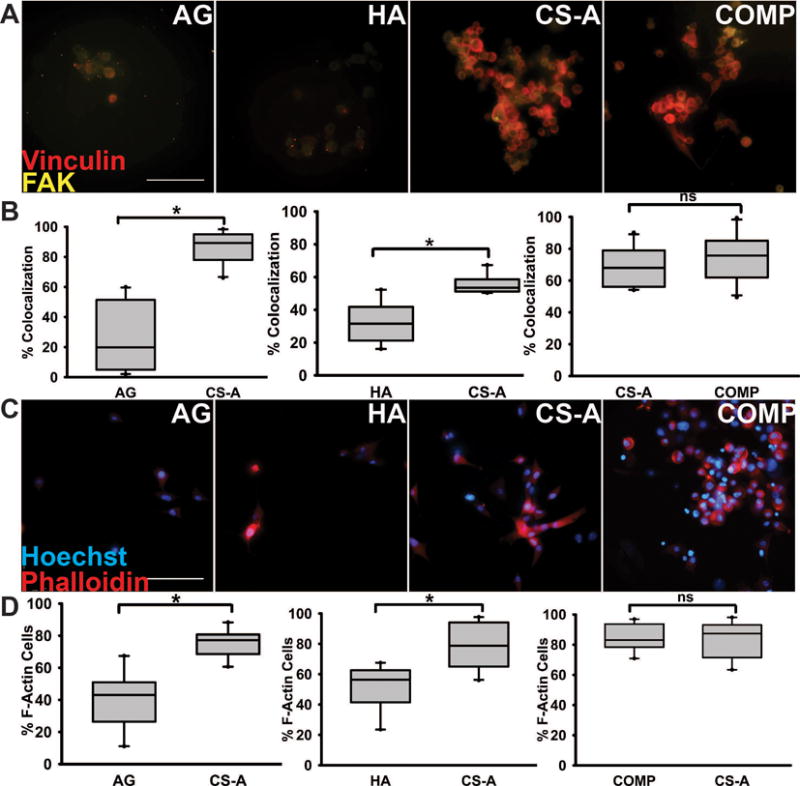
Immunocytochemical staining of encapsulated glioma cells within microfluidics devices 6 h post cell-seeding. (A) FAK (yellow) and vinculin (red) demonstrates evidence of cell migration in hydrogel matrices; (B) Quantification of % F-actin containing cells. Scale bar = 100 μm. (C) Phalloidin staining (red) to visualize F-actin polymerization among cells in each choice assay, with (D) t-test quantifications (p<0.05). Cells were also Hoechst stained (blue) to show cell nuclei. Scale bar 100 μm. Means with ‘*’ (p<0.05) are significantly different, ‘ns’ represents no significant difference.
3.3 The immobilization of CXCL12 in CS-GAG hydrogels enhances U87MG cell haptotaxis
The microfluidics platform described above was used to assess protein diffusion and subsequently the haptotaxis of glioma cells encapsulated in hydrogels, both in the presence and absence of 10 ng/mL CXCL12. Results from the protein diffusion assays demonstrate the steady temporal increase in fluorescence intensity as a function of distance from the epicenter of the well across all hydrogel matrices. No significant differences in the extent of protein diffusion were observed across the different sulfated and unsulfated hydrogel matrices tested after 3 h and 6 h (Fig. 5A). Subsequently, glioma cells were encapsulated in sulfated CS and unsulfated AG and HA hydrogels, and cellular haptotaxis in the presence and absence of 10ng/mL CXCL12 was quantified. Glioma cells displayed the significantly enhanced infiltration (p<0.05) into COMP hydrogels containing CXCL12 over and above COMP hydrogels without CXCL12 at 3 h post cell-seeding. No significant differences were observed in cellular chemotaxis across other hydrogels (p<0.05) (Fig. 5B & 6). At the 6 h time point, augmented cell migration was observed into both CXCL12-containing both CS-GAG hydrogels when compared to CS-GAG hydrogels without CXCL12 (Fig. 6C & D). No significant differences were observed in haptotaxis of glioma cells encapsulated in other hydrogel types (Fig. 6A & B).
Fig. 5.
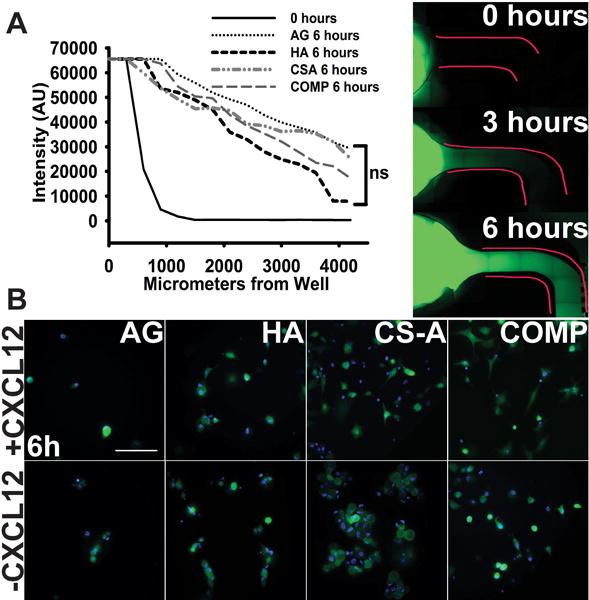
Haptotaxis of cells in response to matrix immobilized CXCL12 presence. (A) Proof of establishment of a chemokine gradient performed using Alexa Fluor 488-conjugated bovine aprotinin. Fluorescence was quantified at zero, three and six hour time points (six hour time point data shown in graph compared to zero hours). No significant differences in chemokine gradient diffusion was detected across different hydrogels as evaluated using a one-way ANOVA. Representative images shown from each time point to demonstrate chemokine diffusion through hydrogel matrices after 6 hours. Scale bar 100 μm. (B) Representative 40X GFP/Hoechst images of migrating cells in response to CXCL12 presence in hydrogel matrices after 6 hours. Scale bar = 100 μm.
Fig. 6.
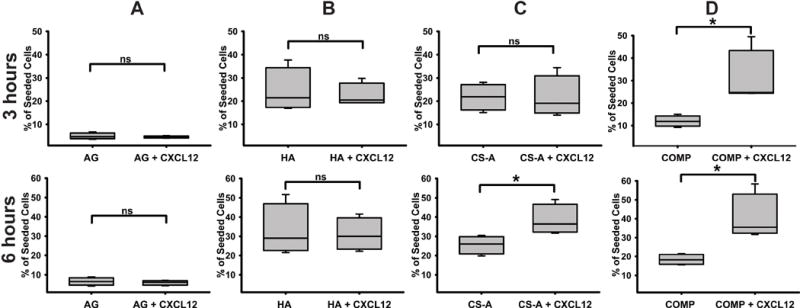
Quantification results of haptotaxis in hydrogel matrices with and without 10 ng/mL CXCL12 at three and six hours post-encapsulation within (A) AG, (B) HA, (C) CS-A, and (D) COMP hydrogels. Data are represented as mean ± SD, and means with ‘*’ (p<0.05) are significantly different from other treatments.
3.4 CS-GAG binding to CXCL12 is sulfation dependent
We performed sandwich ELISA binding assays using a range of CXCL12 concentrations (0–100nM) in order to evaluate the specific binding of CXCL12 to sulfated CS-GAGs and unsulfated HA. The immobilization of HA, monosulfated CS, and COMP GAGs, and subsequent detection of specific binding was performed according to methods described below and in Fig. 7A. Results from these assays demonstrate a significantly (p<0.05) greater concentration dependent binding of CXCL12 to COMP GAGs when compared to monosulfated CS-A or unsulfated HA across three of the four concentrations as indicated by the higher OD levels at these concentrations (Fig. 7B). There were no significant differences in CXCL12 binding to monosulfated CS-A when compared to HA in the lower three CXCL12 concentrations tested. However, a significant increase (p<0.05) in CXCL12 binding to monosulfated CS-A over unsulfated HA was observed at the highest concentration (100 nM) tested (Fig. 7B).
Fig. 7.
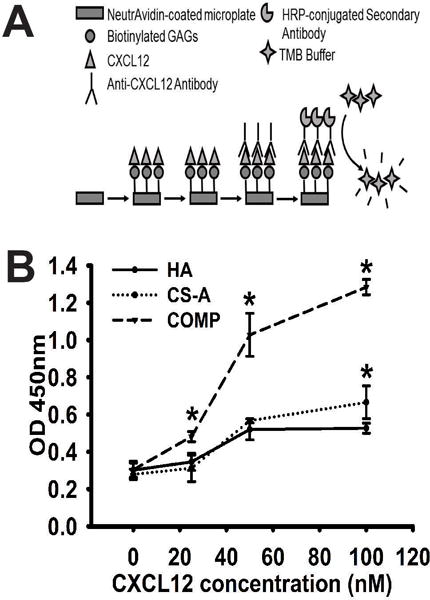
Binding of CXCL12 to immobilized GAGs as quantified by sandwich ELISA assay. (A) Schematic demonstrating ELISA methods to determine amount of bound CXCL12 to biotinylated HA, CS-A and COMP GAGs. (B) Data representing mean OD values obtained across four different CXCL12 concentrations against each GAG analyzed in quadruplicate. Data are represented as mean ± SD, and means with ‘*’ (p<0.05) are significantly different from other treatments.
3.5 Glioma cells encapsulated in CS-GAG hydrogels demonstrate enhanced expression of the CXCR4 and LAR transcripts
In order to further elucidate the potential mechanisms contributing to the observed selective differential infiltration of glioma cells in the different sulfated CS-GAG, and unsulfated HA and AG hydrogels, we quantified the mRNA expression levels of CXCL12, CXCR4 and LAR in hydrogel encapsulated glioma cells 72 h post encapsulation using methods described below and as previously published39. Results from these assays demonstrate the greater than two-fold upregulation of the transcript encoding CXCL12 in hydrogel encapsulated glioma cells across all hydrogel types, with no significant differences observed between groups (Fig. 8A). In contrast, glioma cells encapsulated in the sulfated CS-GAG hydrogels demonstrated a greater than two-fold increase, and a significantly greater (p<0.05) expression of transcripts encoding CXCR4 and LAR when compared to cells encapsulated in AG and HA hydrogels (Fig. 8B & C). No significant differences in expression of these transcripts were observed between glioma cells encapsulated in either monosulfated CS or COMP hydrogels. Protein presence was validated through western blotting of both cell lysates and harvested media from hydrogel encapsulations after 72 h (Fig. 8D). Results from these assays indicate the upregulation of CXCR4 protein expression in glioma cells encapsulated in HA and CS hydrogels when compared to media only and AG controls. Interestingly, a distinctly stable ~75 kDa protein band was observed in lysates obtained from glioma cells encapsulated in CS-A and COMP hydrogels when compared to lysates obtained from media only, AG, and HA encapsulated cells, which indicated the additional presence of a ~37 kDa protein band. No significant differences were observed in CXCL12 presence across cells encapsulated in different hydrogel matrices.
Fig. 8.
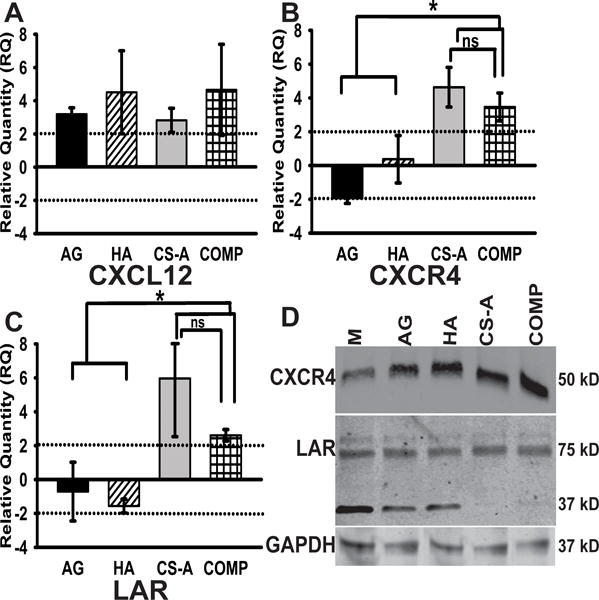
Quantitative RT-PCR results demonstrating relative expression levels of (A) CXCL12, (B) CXCR4 and (C) LAR transcripts isolated from encapsulated cells. All fold changes were calculated relative to expression levels in media-only controls, and normalized against expression levels of housekeeping genes GAPDH and HPRT1. Data are represented as mean ± SD, and means with ‘*’ (p<0.05) are significantly different. A label of ‘ns’ demonstrates no significant difference. (D) Western blot results demonstrating the differential expression levels of CXCR4 and LAR receptors in glioma cells encapsulated in CS-GAG hydrogels when compared to control treatments. GAPDH is presented as a loading control.
4.0 Discussion
Brain tumor cell invasion is an uncontainable problem with modern conventional therapies for GBM patients, often leading to recurrence of the tumor after complete surgical resection. In this study, we investigated the contextual relevance of mono- and disulfated CS-GAGs in triggering glioma cell invasion in vitro. Using a novel approach that exploits microfluidics technology to effectively present hydrogel-based ECM mimics to encapsulated glioma cells, we attempt to elucidate the potential mechanisms by which sulfated CS-GAGs associated with the tumor ECM may serve as instructive cues to direct glioma cell invasion.
The ECM of the CNS is unique in composition with an abundance of HA and CS-GAGs. Glioma are adept at altering this microenvironment to promote cellular proliferation and invasion40–43. The sulfated CS-GAGs linked to CSPGs have been documented to inhibit neurite outgrowth in adult CNS tissue in a sulfation dependent manner37. In contrast, the overexpression of transcripts encoding the enzyme N-Acetylgalactosamine 4-sulfate 6-O-sulfotransferase (GalNAc4S-6ST)18, which catalyzes the sulfation of monosulfated CS-A to disulfated CS-E around high-grade brain tumors points to the potential role of oversulfated CS-GAGs in mediating tumor invasion. Our data corroborate these previous findings, and further demonstrate that the alteration of CS-GAG sulfation from monosulfated CS to disulfated CS alone can enhance glioma cell invasion.
Glioma cells have been shown to differentially migrate through tissue and culture conditions depending on the biomechanical and chemical properties of the substrate. Previous studies have demonstrated the role of 3D tumor microenvironment in altering the gene expression levels of IGF binding proteins, SOX family transcription factors, among others that promote cell growth and survival in glioma cells44, 45. In this study, we aimed to focus instead on investigating the 3D microenvironment-related factors and mechanisms that may have contributed to the enhanced migration of glioma cells when encapsulated in 3D CS-GAG matrices as observed in the in vitro microfluidics based migration assays. We specifically focused on evaluating the gene and protein expression patterns of the chemokine CXCL12 and its high-affinity receptor CXCR4; as well as the cell surface receptor LAR since these factors have been implicated in CS-GAG mediated glioma cell haptotaxis, and CSPG binding respectively18, 46–48. Previous evidence also suggests that the extracellular tumor microenvironment could facilitate cytoskeletal rearrangement leading to glioma cell invasion49–52. Focal adhesion proteins such as FAK and vinculin mediate the cell-ECM interactions, allowing for mesenchymal migration and survival of glioma cells53, 54. In healthy tissue, FAK is recruited to adhesion complexes where the cell uses those attachments to move through the matrix. The localization of FAK in focal adhesions has been shown to be essential to invading glioma cells9, 55. Actin polymerization and the consequent changes in cell morphology are known to be closely interrelated with cell-ECM interactions56. Our results indicate that glioma cells encapsulated within sulfated CS-GAG hydrogel matrices showed an increased colocalization of FAK with the membrane-cytoskeletal protein vinculin when compared to glioma cells encapsulated in unsulfated HA or AG hydrogels, implicating the role of CS-GAGs in augmenting pro-migratory cytoskeletal processes. Finally, since the hydrogels used in this study were fabricated without the addition of integrin binding sites, the enhanced migration of glioma cells as observed in sulfated CS-GAG matrices is suggestive of alternative mechanisms that involve the CS-GAG mediated regulation of glioma cell adhesion as reported previously57. In other studies, Rao et. al. had demonstrated that edge effects between the hydrogel and underlying support (tissue culture plastic surface) could contribute to differential migration rates of mechanosensitive glioma cells encapsulated within hydrogel matrices58. In order to partially circumvent this problem, we used a microfluidics platform that was based on a device used to study tumor cell intravasation previously36. The device carefully controls the thickness of the hydrogel matrix, and incorporates other selective barriers that prevent both hydrogels and cells from spreading throughout the channels ubiquitously during cell-seeding, thereby ensuring specificity of cell invasion into these matrices. Our results demonstrate that the hydrogel matrices tested had uniform physicomechanical properties, as indicated by the comparable porosities and storage moduli obtained for the different hydrogel types tested. The storage moduli were comparable to that of CNS tissue, which can range in storage modulus between <100 to a few hundred Pascal38. As a result, the observed differences in migration patterns of the encapsulated glioma cells are likely due to changes in the chemical properties of the hydrogels, and not due to edge-effects and changes in mechanical properties of the hydrogels.
It is established that the chemokine CXCL12 and its associated cell receptor, CXCR4, are involved in tumorigenesis of glioma, and presence of the CXCR4 receptor is strongly correlated with glioma cell proliferation59. The alternate receptor for CXCL12, CXCR7, is highly expressed across differentiated glioma cells and participates in CXCL12-driven cell proliferation whereas the CXCR4 receptor is known to be expressed across the glioma stem cell populations and actively plays a role in promoting cell proliferation and migration47, 60, 61. Sulfated CS-GAGs in the tumor ECM carry a dominant negative charge, and possess unique structural and functional attributes that can facilitate differential binding and immobilization of growth factors and chemokines within the ECM20, 62, 63. Recent evidence suggests that sulfated CS-GAGs possess differential affinities to CXCL12, with the disulfated CS-E demonstrating greater CXCL12 specific affinity over and above that of monosulfated CS-A31, 64. Previous evidence also indicates that the alterations in CS-GAG sulfation from monosulfated CS to disulfated CS-E around high-grade tumors could potentially serve to enhance growth factor mediated glioma cell haptotaxis18. Our results are in agreement with these findings, and further provide evidence to suggest that high binding affinity of CXCL12 to disulfated CS-E could potentially serve to differentially immobilize CXCL12 in the tumor microenvironment, and accordingly augment glioma cell invasion. Interestingly, although we observed a greater than two-fold upregulation of CXCL12 in glioma cells encapsulated in all hydrogels tested, only cells encapsulated in the sulfated CS-GAG hydrogels expressed significantly greater amounts of CXCR4. Western blotting validated the increased presence of CXCR4 protein levels in glioma cells encapsulated within CS-GAG hydrogels, compared to AG and HA treatments. These results suggest that the upregulation of the CXCL12 binding receptor CXCR4 in the tumor environment might be equally important to mediate tumor invasion. Our gene expression results demonstrate that when levels of cellular CXCL12 are ubiquitous across hydrogel treatments, cells encapsulated in CS-GAG hydrogels produce significantly more of the transcripts encoding CXCR4 and LAR.
The cell membrane bound LAR phosphatases are known to bind to CSPGs to mediate neuronal growth inhibition48, 65, 66. LAR protein tyrosine phosphatases have also been documented as being overabundant in a multitude of different cancers as a marker of invasiveness46. We found that the presence of sulfated CS-GAGs in the extracellular microenvironment stimulates the significant overexpression of the CSPG binding LAR transcript in encapsulated glioma cells, which may have contributed to the observed increase in F-actin polymerization and colocalization of cytoskeletal adhesion proteins in encapsulated glioma cells. Western blotting detected the presence of a ~75 kDa transmembrane subunit of LAR across cells encapsulated within all hydrogel matrices (Fig. 8D), however the presence of an additional ~37 kDa protein was found solely within lysates extracted from the media only, AG, and HA treatments. This difference may signify a separate degradation product or domain of the receptor that is not present in the LAR protein expressed in CS-A or COMP-encapsulated glioma cells. The unique LAR isoform expressed specifically in glioma cells present in CS-GAG-rich environments as detected by western blot analysis may be contributing to the differential migration patterns observed in cells encapsulated within these sulfated CS-GAG matrices, and requires further investigation. The overexpression of LAR transcripts in glioma cells encapsulated within CS-GAG hydrogels seen in qRT-PCR as well as the absence of other degradation products in the western blotting is suggestive of an independent mechanism by which CS-GAGs could potentially regulate LAR receptor signaling, and promote glioma cell invasion. Additionally, since LAR has not been demonstrated to directly interact with the CSPG associated sulfated CS-GAGs, these results also suggest a potentially novel interaction of CS-GAGs with LAR.
Using brain mimetic hydrogel matrices, we have demonstrated that U87MG cells exhibit significantly more migration and cytoskeletal remodeling when encapsulated in sulfated CS-GAG hydrogels. Our results demonstrate that the unique sulfation patterns of ECM-associated CS-GAGs actively participate in glioma cell migration and chemokine interactions, via CS-GAG binding of the pro-migratory CXCL12, and in inducing the overexpression of CXCR4 receptor encoding transcripts. Although, our results demonstrate that glioma cells encapsulated in hydrogel matrices secreted a significantly greater amount of CXCL12 when compared to media-only controls, we found no evidence to suggest that sulfated CS-GAGs differentially affect cell-secreted CXCL12 when compared to unsulfated hydrogel matrices. However, we speculate that the ability of CS-GAGs to bind and present CXCL12 to local cells might be influencing the enhanced CXCR4 receptor expression in glioma cells, which may have contributed to the enhanced haptotaxis of these cells in CS-GAG hydrogels. Our findings also provide additional evidence to suggest the potential regulation of LAR by sulfated CS-GAGs, which may be involved in the activation of separate signaling pathways contributing to glioma cell migration67.
5.0 Conclusions
In summary, our results suggest that the heightened presence of extracellular CS-GAGs directly induces the enhanced cell migration and haptotaxis of glioma cells in a GAG sulfation dependent manner. The identification of the role of CS-GAGs in ECM-driven glioma behaviors would greatly advance our understanding of glioma invasion, and contribute to the design of novel therapeutic interventions to help stem invasion. Our study demonstrates that CS-GAG sulfation patterns could potentially mediate these outcomes by influencing cell membrane receptor expression and by selectively regulating chemokine presentation. The diffuse cellular invasion that characterizes glioblastoma multiforme is one of the biggest obstacles to successful treatment in the clinical setting, and though there is currently no effective treatment for malignant brain tumors, investigating the relationship between CS-GAGs and glioma invasion could help open doors for targeted therapy approaches to stem the invasive progression of these brain tumors.
Supplementary Material
Supplementary Fig. 1.
Strong Anion Exchange (SAX) HPLC of: (A) CS- standards (B) monosulfated CS-A (D0a4), consisting of trace amounts of monosulfated CS-C (D0a0) and (C) Regioselective sulfation of CS-A yielding dual sulfated semisynthetic CS-E (Doa10, 52%), which along with minor increases in 2O sulfation also consists of 17% CS-C and 19% CS-A.
Supplementary Fig. 2.
AutoCAD-generated schematic of the silicon wafer mold design used in fabricating the microfluidics devices for in vitro experiments. (A) The three main channels are 1000 μm wide with wells at each end measuring 5 mm in diameter. Insert shows (B) trapezoidal barriers that line the inner channel, with dimensions chosen to allow for the selective cell migration between channels without allowing hydrogel contents to mix within the middle channel.
Supplementary Fig. 3.
Representative brightfield images of U87MG-EGFP cells within AG, HA, CS-A, and COMP hydrogel matrices displaying differential cell morphology. Images were acquired 48h post-encapsulation. Scale bar = 50 μm.
Acknowledgments
This research was supported by startup funds awarded to Lohitash Karumbaiah by the University of Georgia CAES and OVPR, and in part by seed grant funding from the Georgia Institute of Technology/Emory University Regenerative Engineering and Medicine Center and The University of Georgia awarded to Lohitash Karumbaiah. This research was supported in part by the National Institutes of Health (NIH)-funded Research Resource for Integrated Glycotechnology (NIH grant no. P41GM103390) to the Complex Carbohydrate Research Center. We would also like to acknowledge Dr. Ravi Bellamkonda for the generous gift of the U87MG-EGFP human glioma cell line.
References
- 1.Ostrom QT, Gittleman H, Fulop J, Liu M, Blanda R, Kromer C, Wolinsky Y, Kruchko C, Barnholtz-Sloan JS. Neuro-oncology. 2015;17(Suppl 4):iv1–iv62. doi: 10.1093/neuonc/nov189. [DOI] [PMC free article] [PubMed] [Google Scholar]
- 2.Esiri M. Journal of neurology, neurosurgery, and psychiatry. 2000;68:538D. doi: 10.1136/jnnp.68.4.538c. [DOI] [PMC free article] [PubMed] [Google Scholar]
- 3.Holland EC. Proc Natl Acad Sci U S A. 2000;97:6242–6244. doi: 10.1073/pnas.97.12.6242. [DOI] [PMC free article] [PubMed] [Google Scholar]
- 4.Giese A, Bjerkvig R, Berens ME, Westphal M. J Clin Oncol. 2003;21:1624–1636. doi: 10.1200/JCO.2003.05.063. [DOI] [PubMed] [Google Scholar]
- 5.Ramirez YP, Weatherbee JL, Wheelhouse RT, Ross AH. Pharmaceuticals (Basel) 2013;6:1475–1506. doi: 10.3390/ph6121475. [DOI] [PMC free article] [PubMed] [Google Scholar]
- 6.Batzdorf U, Malamud N. Journal of neurosurgery. 1963;20:122–136. doi: 10.3171/jns.1963.20.2.0122. [DOI] [PubMed] [Google Scholar]
- 7.Paganetti PA, Caroni P, Schwab ME. J Cell Biol. 1988;107:2281–2291. doi: 10.1083/jcb.107.6.2281. [DOI] [PMC free article] [PubMed] [Google Scholar]
- 8.Kleihues P, Sobin LH. Cancer. 2000;88:2887. doi: 10.1002/1097-0142(20000615)88:12<2887::aid-cncr32>3.0.co;2-f. [DOI] [PubMed] [Google Scholar]
- 9.Demuth T, Berens ME. Journal of neuro-oncology. 2004;70:217–228. doi: 10.1007/s11060-004-2751-6. [DOI] [PubMed] [Google Scholar]
- 10.Diaz B, Shani G, Pass I, Anderson D, Quintavalle M, Courtneidge SA. Sci Signal. 2009;2:ra53. doi: 10.1126/scisignal.2000368. [DOI] [PMC free article] [PubMed] [Google Scholar]
- 11.Munson JM, Fried L, Rowson SA, Bonner MY, Karumbaiah L, Diaz B, Courtneidge SA, Knaus UG, Brat DJ, Arbiser JL, Bellamkonda RV. Sci Transl Med. 2012;4:127ra136. doi: 10.1126/scitranslmed.3003016. [DOI] [PubMed] [Google Scholar]
- 12.Berens ME, Rief MD, Loo MA, Giese A. Clinical & experimental metastasis. 1994;12:405–415. doi: 10.1007/BF01755884. [DOI] [PubMed] [Google Scholar]
- 13.Hynes RO, Lander AD. Cell. 1992;68:303–322. doi: 10.1016/0092-8674(92)90472-o. [DOI] [PubMed] [Google Scholar]
- 14.Tysnes BB, Larsen LF, Ness GO, Mahesparan R, Edvardsen K, Garcia-Cabrera I, Bjerkvig R. International journal of cancer Journal international du cancer. 1996;67:777–784. doi: 10.1002/(SICI)1097-0215(19960917)67:6<777::AID-IJC5>3.0.CO;2-O. [DOI] [PubMed] [Google Scholar]
- 15.Lau LW, Cua R, Keough MB, Haylock-Jacobs S, Yong VW. Nature reviews Neuroscience. 2013;14:722–729. doi: 10.1038/nrn3550. [DOI] [PubMed] [Google Scholar]
- 16.Ruoslahti E. Glycobiology. 1996;6:489–492. doi: 10.1093/glycob/6.5.489. [DOI] [PubMed] [Google Scholar]
- 17.Sugahara K, Mikami T. Current opinion in structural biology. 2007;17:536–545. doi: 10.1016/j.sbi.2007.08.015. [DOI] [PubMed] [Google Scholar]
- 18.Kobayashi T, Yan H, Kurahashi Y, Ito Y, Maeda H, Tada T, Hongo K, Nakayama J. PLoS One. 2013;8:e54278. doi: 10.1371/journal.pone.0054278. [DOI] [PMC free article] [PubMed] [Google Scholar]
- 19.Schrappe M, Klier FG, Spiro RC, Waltz TA, Reisfeld RA, Gladson CL. Cancer research. 1991;51:4986–4993. [PubMed] [Google Scholar]
- 20.Deepa SS, Umehara Y, Higashiyama S, Itoh N, Sugahara K. The Journal of biological chemistry. 2002;277:43707–43716. doi: 10.1074/jbc.M207105200. [DOI] [PubMed] [Google Scholar]
- 21.Mizumoto S, Fongmoon D, Sugahara K. Glycoconjugate journal. 2013;30:619–632. doi: 10.1007/s10719-012-9463-5. [DOI] [PubMed] [Google Scholar]
- 22.Nandini CD, Itoh N, Sugahara K. The Journal of biological chemistry. 2005;280:4058–4069. doi: 10.1074/jbc.M412074200. [DOI] [PubMed] [Google Scholar]
- 23.Zhou ZH, Karnaukhova E, Rajabi M, Reeder K, Chen T, Dhawan S, Kozlowski S. PLoS One. 2014;9:e94402. doi: 10.1371/journal.pone.0094402. [DOI] [PMC free article] [PubMed] [Google Scholar]
- 24.Mackay CR. Nature immunology. 2001;2:95–101. doi: 10.1038/84298. [DOI] [PubMed] [Google Scholar]
- 25.Barbero S, Bajetto A, Bonavia R, Porcile C, Piccioli P, Pirani P, Ravetti JL, Zona G, Spaziante R, Florio T, Schettini G. Ann N Y Acad Sci. 2002;973:60–69. doi: 10.1111/j.1749-6632.2002.tb04607.x. [DOI] [PubMed] [Google Scholar]
- 26.Goffart N, Kroonen J, Di Valentin E, Dedobbeleer M, Denne A, Martinive P, Rogister B. Neuro-oncology. 2015;17:81–94. doi: 10.1093/neuonc/nou144. [DOI] [PMC free article] [PubMed] [Google Scholar]
- 27.Zagzag D, Lukyanov Y, Lan L, Ali MA, Esencay M, Mendez O, Yee H, Voura EB, Newcomb EW. Laboratory investigation; a journal of technical methods and pathology. 2006;86:1221–1232. doi: 10.1038/labinvest.3700482. [DOI] [PubMed] [Google Scholar]
- 28.Ehtesham M, Winston JA, Kabos P, Thompson RC. Oncogene. 2006;25:2801–2806. doi: 10.1038/sj.onc.1209302. [DOI] [PubMed] [Google Scholar]
- 29.Laguri C, Arenzana-Seisdedos F, Lortat-Jacob H. Carbohydrate research. 2008;343:2018–2023. doi: 10.1016/j.carres.2008.01.047. [DOI] [PubMed] [Google Scholar]
- 30.Munson JM, Bellamkonda RV, Swartz MA. Cancer research. 2013;73:1536–1546. doi: 10.1158/0008-5472.CAN-12-2838. [DOI] [PubMed] [Google Scholar]
- 31.Zhou Y, Larsen PH, Hao C, Yong VW. The Journal of biological chemistry. 2002;277:49481–49487. doi: 10.1074/jbc.M206222200. [DOI] [PubMed] [Google Scholar]
- 32.Chagnon MJ, Uetani N, Tremblay ML. Biochemistry and cell biology = Biochimie et biologie cellulaire. 2004;82:664–675. doi: 10.1139/o04-120. [DOI] [PubMed] [Google Scholar]
- 33.Karumbaiah L, Enam SF, Brown AC, Saxena T, Betancur MI, Barker TH, Bellamkonda RV. Bioconjug Chem. 2015;26:2336–2349. doi: 10.1021/acs.bioconjchem.5b00397. [DOI] [PubMed] [Google Scholar]
- 34.Jeon O, Bouhadir KH, Mansour JM, Alsberg E. Biomaterials. 2009;30:2724–2734. doi: 10.1016/j.biomaterials.2009.01.034. [DOI] [PubMed] [Google Scholar]
- 35.Cai C, Solakyildirim K, Yang B, Beaudet JM, Weyer A, Linhardt RJ, Zhang F. Carbohydr Polym. 2012;87:822–829. doi: 10.1016/j.carbpol.2011.08.075. [DOI] [PMC free article] [PubMed] [Google Scholar]
- 36.Zervantonakis IK, Hughes-Alford SK, Charest JL, Condeelis JS, Gertler FB, Kamm RD. Proc Natl Acad Sci U S A. 2012;109:13515–13520. doi: 10.1073/pnas.1210182109. [DOI] [PMC free article] [PubMed] [Google Scholar]
- 37.Karumbaiah L, Anand S, Thazhath R, Zhong Y, McKeon RJ, Bellamkonda RV. Glia. 2011;59:981–996. doi: 10.1002/glia.21170. [DOI] [PMC free article] [PubMed] [Google Scholar]
- 38.Lu YB, Franze K, Seifert G, Steinhauser C, Kirchhoff F, Wolburg H, Guck J, Janmey P, Wei EQ, Kas J, Reichenbach A. Proc Natl Acad Sci U S A. 2006;103:17759–17764. doi: 10.1073/pnas.0606150103. [DOI] [PMC free article] [PubMed] [Google Scholar]
- 39.Valmikinathan CM, Chang W, Xu J, Yu X. Biofabrication. 2012;4:035006. doi: 10.1088/1758-5082/4/3/035006. [DOI] [PubMed] [Google Scholar]
- 40.Bellail AC, Hunter SB, Brat DJ, Tan C, Van Meir EG. The international journal of biochemistry & cell biology. 2004;36:1046–1069. doi: 10.1016/j.biocel.2004.01.013. [DOI] [PubMed] [Google Scholar]
- 41.Gladson CL. Journal of neuropathology and experimental neurology. 1999;58:1029–1040. doi: 10.1097/00005072-199910000-00001. [DOI] [PubMed] [Google Scholar]
- 42.Pilkington GJ. Anticancer Res. 1997;17:4103–4105. [PubMed] [Google Scholar]
- 43.Viapiano MS, Matthews RT. Trends in molecular medicine. 2006;12:488–496. doi: 10.1016/j.molmed.2006.08.007. [DOI] [PubMed] [Google Scholar]
- 44.Cooper LA, Gutman DA, Chisolm C, Appin C, Kong J, Rong Y, Kurc T, Van Meir EG, Saltz JH, Moreno CS, Brat DJ. Am J Pathol. 2012;180:2108–2119. doi: 10.1016/j.ajpath.2012.01.040. [DOI] [PMC free article] [PubMed] [Google Scholar]
- 45.Smith SJ, Wilson M, Ward JH, Rahman CV, Peet AC, Macarthur DC, Rose FR, Grundy RG, Rahman R. PLoS One. 2012;7:e52335. doi: 10.1371/journal.pone.0052335. [DOI] [PMC free article] [PubMed] [Google Scholar]
- 46.Du Y, Grandis JR. Chin J Cancer. 2015;34:61–69. doi: 10.5732/cjc.014.10146. [DOI] [PMC free article] [PubMed] [Google Scholar]
- 47.Gagliardi F, Narayanan A, Reni M, Franzin A, Mazza E, Boari N, Bailo M, Zordan P, Mortini P. Glia. 2014;62:1015–1023. doi: 10.1002/glia.22669. [DOI] [PubMed] [Google Scholar]
- 48.Shen Y, Tenney AP, Busch SA, Horn KP, Cuascut FX, Liu K, He Z, Silver J, Flanagan JG. Science. 2009;326:592–596. doi: 10.1126/science.1178310. [DOI] [PMC free article] [PubMed] [Google Scholar]
- 49.Ananthanarayanan B, Kim Y, Kumar S. Biomaterials. 2011;32:7913–7923. doi: 10.1016/j.biomaterials.2011.07.005. [DOI] [PMC free article] [PubMed] [Google Scholar]
- 50.Ulrich TA, de Juan Pardo EM, Kumar S. Cancer research. 2009;69:4167–4174. doi: 10.1158/0008-5472.CAN-08-4859. [DOI] [PMC free article] [PubMed] [Google Scholar]
- 51.Ulrich TA, Jain A, Tanner K, MacKay JL, Kumar S. Biomaterials. 2010;31:1875–1884. doi: 10.1016/j.biomaterials.2009.10.047. [DOI] [PubMed] [Google Scholar]
- 52.Rao SS, Dejesus J, Short AR, Otero JJ, Sarkar A, Winter JO. ACS Appl Mater Interfaces. 2013;5:9276–9284. doi: 10.1021/am402097j. [DOI] [PMC free article] [PubMed] [Google Scholar]
- 53.Magro AM, Magro AD, Cunningham C, Miller MR. Neoplasma. 2007;54:517–526. [PMC free article] [PubMed] [Google Scholar]
- 54.Shi Q, Hjelmeland AB, Keir ST, Song L, Wickman S, Jackson D, Ohmori O, Bigner DD, Friedman HS, Rich JN. Mol Carcinog. 2007;46:488–496. doi: 10.1002/mc.20297. [DOI] [PubMed] [Google Scholar]
- 55.Obara S, Nakata M, Takeshima H, Kuratsu J, Maruyama I, Kitajima I. Cancer Lett. 2002;185:153–161. doi: 10.1016/s0304-3835(02)00278-1. [DOI] [PubMed] [Google Scholar]
- 56.Chintala SK, Sawaya R, Aggarwal BB, Majumder S, Giri DK, Kyritsis AP, Gokaslan ZL, Rao JS. J Biol Chem. 1998;273:13545–13551. doi: 10.1074/jbc.273.22.13545. [DOI] [PubMed] [Google Scholar]
- 57.Aguiar CB, Lobao-Soares B, Alvarez-Silva M, Trentin AG. BMC Cell Biol. 2005;6:31. doi: 10.1186/1471-2121-6-31. [DOI] [PMC free article] [PubMed] [Google Scholar]
- 58.Rao SS, Bentil S, DeJesus J, Larison J, Hissong A, Dupaix R, Sarkar A, Winter JO. PLoS One. 2012;7:e35852. doi: 10.1371/journal.pone.0035852. [DOI] [PMC free article] [PubMed] [Google Scholar]
- 59.do Carmo A, Patrico I, Curz MT, Carvalheiro H, Oliveira CR, Lopes MC. Ann Neurosci. 2010;17:85–86. doi: 10.5214/ans.0972-7531.1017207. [DOI] [PMC free article] [PubMed] [Google Scholar]
- 60.Calatozzolo C, Canazza A, Pollo B, Di Pierro E, Ciusani E, Maderna E, Salce E, Sponza V, Frigerio S, Di Meco F, Schinelli S, Salmaggi A. Cancer Biol Ther. 2011;11:242–253. doi: 10.4161/cbt.11.2.13951. [DOI] [PubMed] [Google Scholar]
- 61.Hattermann K, Held-Feindt J, Lucius R, Muerkoster SS, Penfold ME, Schall TJ, Mentlein R. Cancer research. 2010;70:3299–3308. doi: 10.1158/0008-5472.CAN-09-3642. [DOI] [PubMed] [Google Scholar]
- 62.Esko JD, Kimata K, Lindahl U. In: Essentials of Glycobiology. 2nd. Varki A, Cummings RD, Esko JD, Freeze HH, Stanley P, Bertozzi CR, Hart GW, Etzler ME, editors. Cold Spring Harbor; NY: 2009. [PubMed] [Google Scholar]
- 63.Nandini CD, Mikami T, Ohta M, Itoh N, Akiyama-Nambu F, Sugahara K. The Journal of biological chemistry. 2004;279:50799–50809. doi: 10.1074/jbc.M404746200. [DOI] [PubMed] [Google Scholar]
- 64.Mizumoto S, Sugahara K. FEBS J. 2013;280:2462–2470. doi: 10.1111/febs.12156. [DOI] [PubMed] [Google Scholar]
- 65.Fisher D, Xing B, Dill J, Li H, Hoang HH, Zhao Z, Yang XL, Bachoo R, Cannon S, Longo FM, Sheng M, Silver J, Li S. J Neurosci. 2011;31:14051–14066. doi: 10.1523/JNEUROSCI.1737-11.2011. [DOI] [PMC free article] [PubMed] [Google Scholar]
- 66.Paul S, Lombroso PJ. Cell Mol Life Sci. 2003;60:2465–2482. doi: 10.1007/s00018-003-3123-7. [DOI] [PMC free article] [PubMed] [Google Scholar]
- 67.Pantazaka E, Papadimitriou E. Biochim Biophys Acta. 2014;1840:2643–2650. doi: 10.1016/j.bbagen.2014.01.009. [DOI] [PubMed] [Google Scholar]
Associated Data
This section collects any data citations, data availability statements, or supplementary materials included in this article.
Supplementary Materials
Supplementary Fig. 1.
Strong Anion Exchange (SAX) HPLC of: (A) CS- standards (B) monosulfated CS-A (D0a4), consisting of trace amounts of monosulfated CS-C (D0a0) and (C) Regioselective sulfation of CS-A yielding dual sulfated semisynthetic CS-E (Doa10, 52%), which along with minor increases in 2O sulfation also consists of 17% CS-C and 19% CS-A.
Supplementary Fig. 2.
AutoCAD-generated schematic of the silicon wafer mold design used in fabricating the microfluidics devices for in vitro experiments. (A) The three main channels are 1000 μm wide with wells at each end measuring 5 mm in diameter. Insert shows (B) trapezoidal barriers that line the inner channel, with dimensions chosen to allow for the selective cell migration between channels without allowing hydrogel contents to mix within the middle channel.
Supplementary Fig. 3.
Representative brightfield images of U87MG-EGFP cells within AG, HA, CS-A, and COMP hydrogel matrices displaying differential cell morphology. Images were acquired 48h post-encapsulation. Scale bar = 50 μm.