Abstract
Background:
Considering the clinical importance of high 5-year mortality, we performed a meta-analysis of maximum standardized uptake value (SUVmax), metabolic tumor volume (MTV), and total lesion glycolysis (TLG) from 18F-FDG PET-CT for overall survival (OS) and progression-free survival (PFS) in patients with soft tissue sarcoma.
Methods:
The search and selection of eligible articles was conducted on PubMed and EMBASE. We applied hazard ratio (HR) and odd ratio (OR) to measure the correlation between SUVmax, MTV, and TLG with PFS and OS. The SUVmax was analyzed through subgroup in terms of histological grade and HR of posttreatment SUVmax was also assessed.
Results:
Eleven studies with 582 patients were included. The pooled HRs of pretreatment SUVmax were 2.40 (95% CI: 1.38–4.17) for OS and 2.20 (95% CI: 1.47–3.30) for PFS. The HRs in terms of OS were 3.20 (95% CI: 1.71–5.98) based on MTV and 5.20 (95% CI: 2.34–11.56) based on TLG. Meanwhile, the predict results of pretreatment SUVmax on OR remained significant and the HRs of posttreatment SUVmax were 2.25 (95% CI: 1.33–3.80) for OS and 2.87 (95% CI: 1.81–4.55) for PFS.
Conclusions:
The pretreatment SUVmax, MTV, and TLG of 18F-FDG PET-CT showed significant prognostic value for OS and the PET-CT can be used in identifying high-risk patients about progression and survival. The analysis for posttreatment SUVmax suggested PET-CT as a promising equipment in monitoring therapy response.
Keywords: meta-analysis, PET-CT, prognosis, soft tissue sarcoma
1. Introduction
Soft tissue sarcomas are relatively rare kind of tumors with variety of presentations which arise from the mesenchyme, which can be derived from different types of tissue such as smooth muscle, bone, lymph, adipose tissue, or vascular tissues.[1] Although comprising only 1% of all cancers,[2] soft tissue sarcoma is difficult to diagnose and treat because of its diversity,[3] and with 5-year mortality rate as high as 50%.[4] Soft tissue sarcoma can be diagnosed by computed tomography (CT) and magnetic resonance imaging (MRI).[5] However, CT and MRI have limited capability in assessment of biological activity, malignant capacity, or potential metastatic process of tumors.[6]
As an advanced clinical imaging technique, the fluorine-18-fluorodeoxyglucose positron emission tomography with computed tomography (18F-FDG PET-CT) has shown high sensitivity, specificity, and safety to evaluate glucose metabolism of tumors for early diagnosis, staging, and monitoring of potential malignancies.[7,8] Maximum standardized uptake value (SUVmax), refers to the radioactivity of imaging agent in tumor, is the most widely used semiquantitative parameter.[9] Metabolic tumor volume (MTV), the tumor volume with high metabolic activity above a predefined SUV threshold (20–70%),[10] is a semiquantitative parameter that integrates the metabolism and volume. And total lesion glycolysis (TLG), the entire amount of tumor's glycolysis,[9] is also applied to represent the tumor malignant transformation. In particular, SUVmax is regarded as a limited parameter that can only represent the tumor activity and fail to signify the whole tumor volume.[11,12] However, there also existed studies which concluded that the volumetric parameter of PET-CT may not provide significant prognostic information.[13] Nevertheless, the overall analysis of the association between SUVmax, MTV, or TLG and prognosis in soft tissue sarcoma has not been systematically and scientifically assessed.
Therefore, we performed a meta-analysis in order to attain a more comprehensive estimate of the prognostic value of SUVmax, MTV, and TLG in predicting overall survival (OS) and progression-free survival (PFS) in patients with soft tissue sarcoma by combining data from relevant studies.
2. Materials and methods
2.1. Search strategy
Articles were identified about the assessment of PET-CT in prognosis of sarcoma by searching PubMed and EMBASE until July 31, 2016. The used terms include “soft tissue sarcoma”; “PET” or “PET-CT” or “positron emission tomography”; “prognosis”; “SUVmax” or “maximum standardized uptake value”; “MTV” or “Metabolic tumor volume” and “TLG” or “total lesion glycolysis.” We performed all the analyses based on previously published studies, thus no ethical approval was required.
2.2. Study inclusion/exclusion criteria
The inclusion criteria can be read as follows: studies which included patients with soft tissue sarcoma; studies which investigated the correlation between parameter of PET-CT (SUVmax, MTV, or TLG) and survival outcome (OS or PFS); studies which calculated the HRs and their 95% confidence interval (CI) for OS, PFS or can be calculated on key information by using methodology of Tierney et al[14] from original articles.
The exclusion criteria for this meta-analysis includes: studies which analyzed different kinds of tumors without specific results of soft tissue sarcoma; studies which lacked prognostic information of association between parameter of PET-CT (SUVmax, MTV, or TLG) and survival results; studies were other types of research, such as letters and case reports; or studies were non-English articles.
2.3. Data extraction
Main information were extracted from included studies according to predefined tables, which were divided into pretreatment and posttreatment table and included the primary information: survival endpoints, containing OS and PFS and the additional information: first author, publication year, country, patients’ characteristics (age, disease subtype, and histological grade), study design, cut-off values of SUVmax, MTV, or/and TLG.
2.4. Quality assessment
We used REMARK criteria[15] which consists of 20 items in sum to estimate the quality of articles. The reporting recommendations are comprised of 4 major aspects based on framework of articles: introduction, materials and methods, results, and discussion, which also contains several subdirectories in terms of specimen characteristics, analysis and presentation, and so on. Each characteristics according to REMARK criteria accounted for 5% of scores of a study and the quality scores ranged from 0% to 100%.
2.5. Statistical analysis
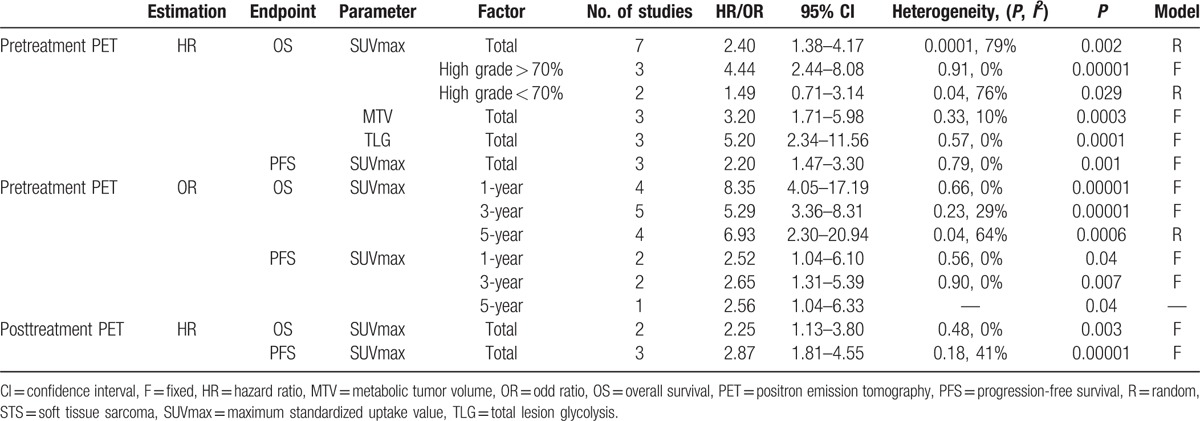
Hazard ratio (HR) was used to measure the correlation between SUVmax with PFS and OS, which are shown in Table 2. We calculated these logHR and standard error (SE) on the basis of following ways when either of the 2 groups of data were available: HR and 95% CI directly provided by the studies, the P-value from log-rank test and the number of patients and events by estimating the Kaplan–Meier survival curves on Engauge Digitizer 4.1. The calculation was finished through the software programmed by Tierney et al.[14]
Table 2.
Total and subgroup multivariate analyses for HR and OR of pretreatment or posttreatment PET.
The meta-analysis of SUVmax was also performed in each subgroup, which was classified by histological grade. Heterogeneity was evaluated using Higgins's definition.[16] The fixed effect model was selected when there existed no significant heterogeneity (P ≥ 0.10, I2 ≤ 50%) in the results of the literature studies. And we used a random effect model if heterogeneity was significant (P < 0.10 or I2 > 50%). An HR > 1 without the 95% CI overlapping 1 indicated that patients with high SUVmax not beneficial for patients’ survival while an HR < 1 implied that the low SUVmax related with worse survival outcome.
Survival outcomes were also assessed by odd ratio (OR) in terms of 1-, 3-, and 5-year OS and PFS, which are shown in Table 2. When the direct data of original articles were not available, OR could be calculated by estimating the survival rates on Kaplan–Meier curves through Engauge Digitizer 4.1. A pooled OR without 95% CI overlapping 1 is of great statistical significance. We still used Higgins's definition for the evaluation of heterogeneity as mentioned above. All above calculations were performed on Review Manager statistical software (RevMan5.2). The publication bias was estimated by means of Begg test performed on STATA 11.0 and P > 0.05 represents no significant publication bias.[17]
3. Results
The initial search contained 63 studies from PubMed databases and EMBASE did not provide with additional studies. And after 7 duplicate articles were excluded, another 39 studies were excluded by screening the titles and abstracts, 17 articles were remained for full texts reviewed. The studies which analyzed prognostic values of bone and soft tissue sarcoma without specific results of soft tissue sarcoma ware excluded. And 6 of these articles were excluded because survival outcome lacked or cannot be calculated and 2 studies only contained the posttreatment survival results were included to assess the prognostic capacity of PET-CT for therapeutic response. Finally, a total of 11 studies with 582 patients were included, which all reported the prognostic value of SUVmax, MTV, or/and TLG for survival in soft tissue sarcoma (Fig. 1).
Figure 1.
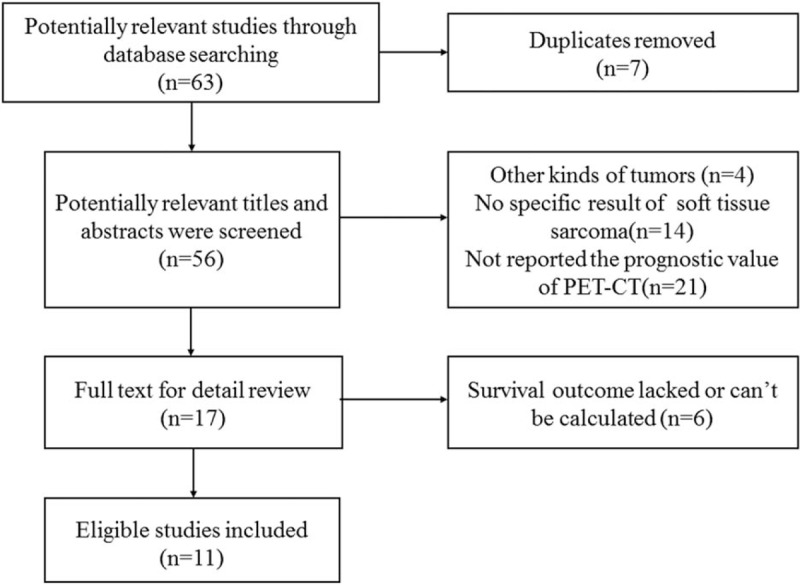
Study selection.
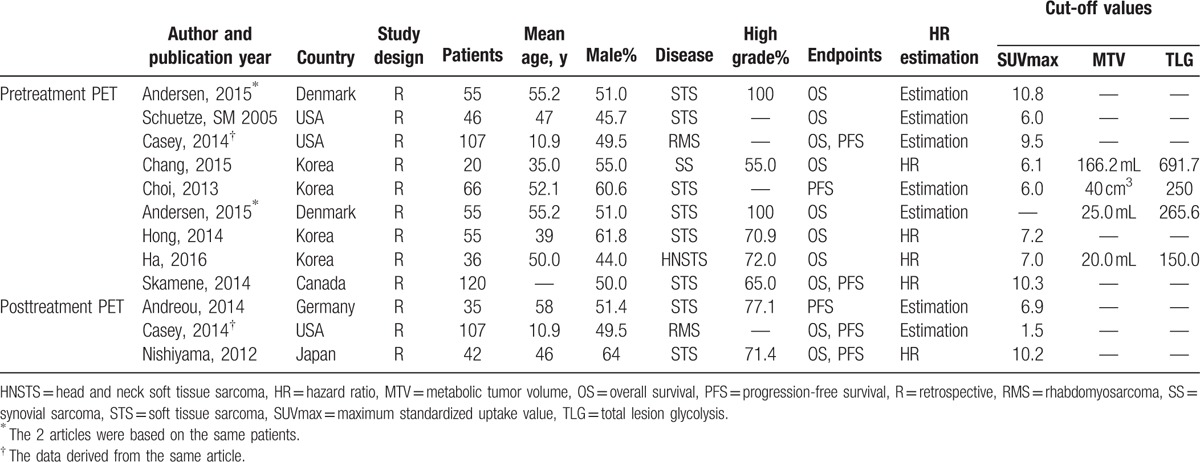
All 11 studies indicated high SUVmax, MTV, or/and TLG represented a worse prognosis than patients with low numerical value. In terms of association between PET parameters and OS and PFS, there are 7 studies[13,18–23] that only provided with prognostic information about SUVmax and 4 studies[11,12,24,25] analyzed prognostic value of MTV and TLG. The major characteristics of 11 publications are summarized in Table 1.
Table 1.
Main characteristics of the included studies with pretreatment or posttreatment PET.
3.1. Prognostic value of pretreatment SUVmax for OS
Seven studies (439 patients) in total were involved and represented a HR of 2.40 (95% CI: 1.38–4.17, P = 0.0001, I2 = 79%) (Fig. 2A). Result of Begg test represented no evident publication bias (z = 1.80, P = 0.072) (Fig. 5). The more significant HR and less heterogeneity were presented in a group of patients (3 studies, 154 patients) among which the percentage of histological high grade STS > 70% (HR = 4.44, 95% CI: 2.44–8.08, I2 = 0%, P = 0.91) (Table 2). There existed 2 studies (140 patients), whose proportion of histological high grade STS was less than 70% and subgroup analysis based on those studies revealed the smaller HR and greater I2 (HR = 1.49, 95% CI: 0.71–3.14, I2 = 76%, P = 0.04) (Table 2).
Figure 2.
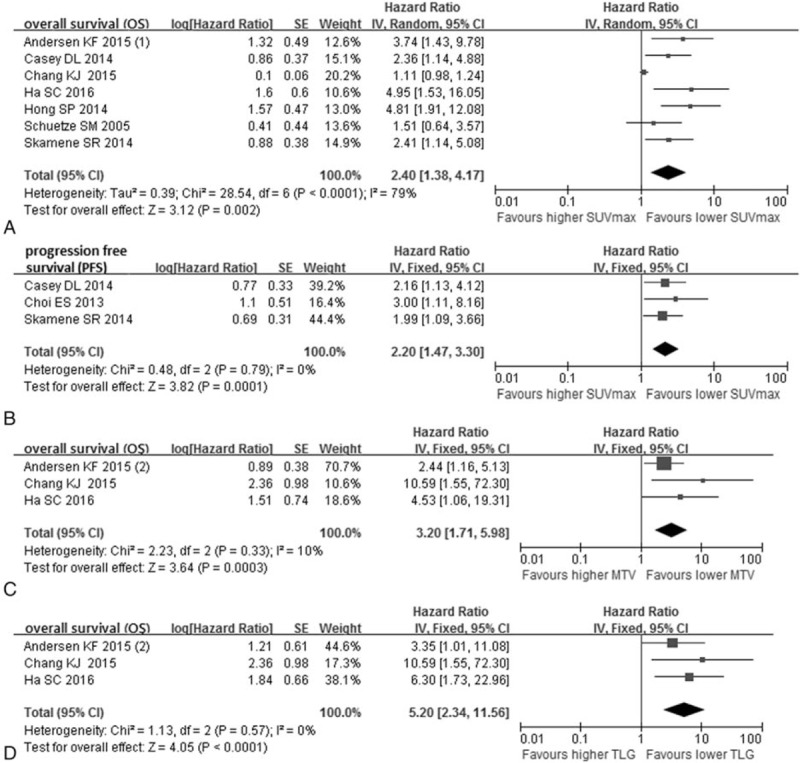
Forest plots of hazard ratio (HR) for overall survival (OS) and progression-free survival (PFS) of pretreatment PET. Meta-analysis of the association between SUVmax and OS (A), SUVmax and PFS (B), MTV and OS (C), TLG and OS (D).
Figure 5.
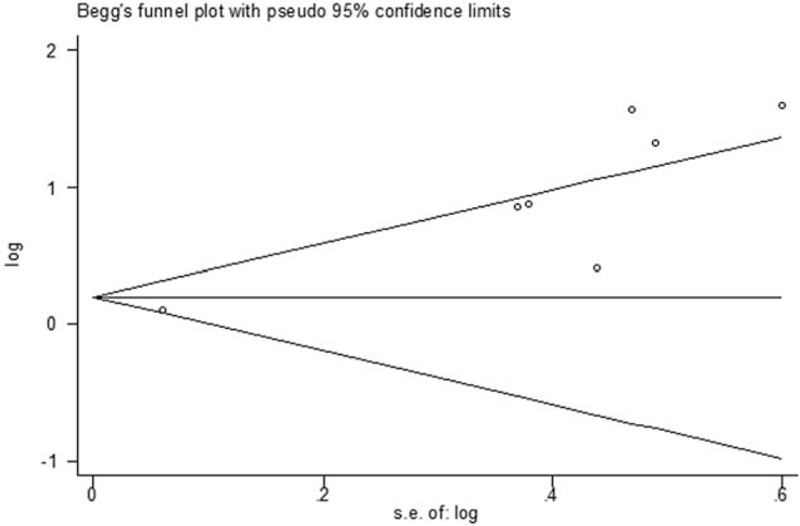
Funnel plot of potential publication bias for overall survival of pretreatment SUVmax.
The combined OR on 1-, 3-, and 5-year OS were 8.35 (95% CI: 4.05–17.19) (Fig. 4A), 5.29 (95% CI: 3.36–8.31) (Fig. 4B), and 6.93 (95% CI: 2.30–20.94) (Fig. 4C), respectively. Heterogeneity existed according to 5-year OS (I2 = 64%, P = 0.04) and there was no significant heterogeneity in 1- and 3-year OS.
Figure 4.
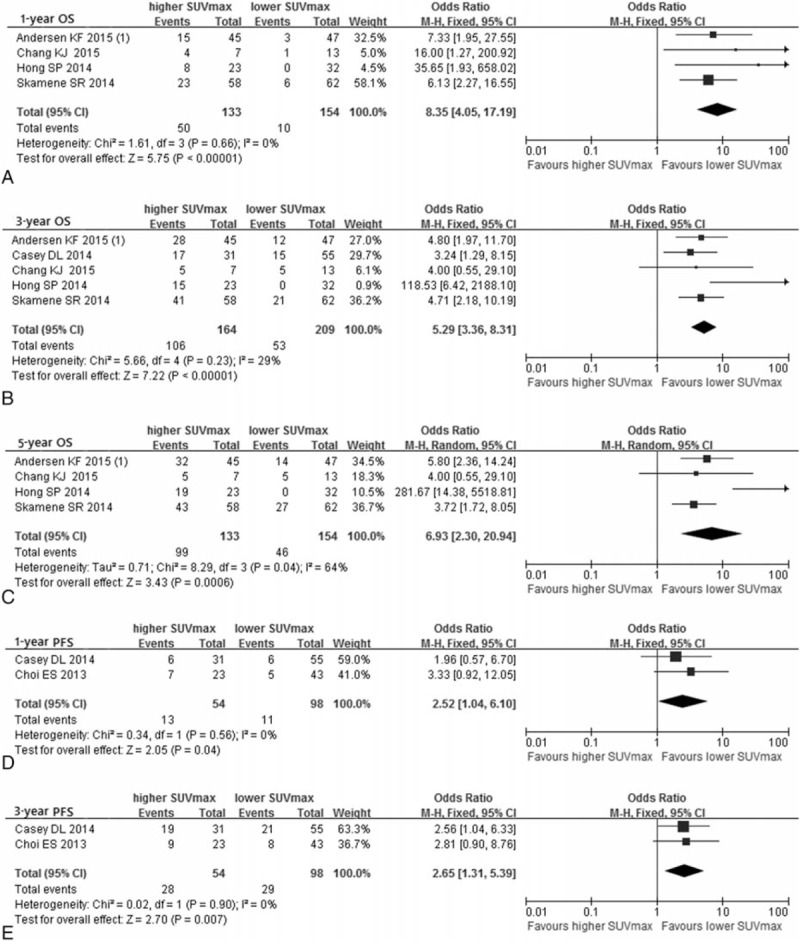
Forest plots of odd ratio (OR) for overall survival (OS) and progression-free survival (PFS) of pretreatment SUVmax. Meta-analysis of the association between SUVmax and 1-year OS (A), 3-year OS (B), 5-year OS (C), 1-year PFS (D), and 3-year PFS (E).
3.2. Prognostic value of pretreatment SUVmax for PFS
In this comparison, 3 studies involving 293 patients were included in the assessment. PFS was better with low SUVmax patients in comparison with patients with high SUVmax (HR = 2.20, 95% CI: 1.47–3.30, I2 = 0%, P = 0.79) (Fig. 2B). Significant publication bias was not existed according to Begg test (z = 1.04, P = 0.296).
The analysis of OR on 1-year and 3-year PFS involved 2 studies while the 5-year PFS only involved one study, and OR with 95% CI were 2.52 (1.04–6.10) (Fig. 4D), 2.65 (1.31–5.39) (Fig. 4E), and 2.56 (1.04–6.33) (Table 2), respectively. All heterogeneity of results was not significant.
3.3. Prognostic value of pretreatment MTV and TLG for OS and PFS
Significant prognostic value of MTV for OS was reflected in the analysis of 3 studies including 111 patients (HR = 3.20, 95% CI: 1.71–5.98) (Fig. 2C). And the heterogeneity (I2 = 10%, P = 0.33) and publication bias (z = 1.04, P = 0.296) were insignificant in the assessment. Meanwhile, the combined HR of TLG for OS according to 3 studies (111 patients) in the analysis was 5.20 (95% CI: 2.34–11.56) (Fig. 2D). The pooled HR showed the significant survival advantage for low TLG over high TLG patients with sarcoma. And there was no obvious proof of heterogeneity (I2 = 0%, P = 0.57) and publication bias (z = 1.04, P = 0.296).
The analysis of prognostic value of MTV and TLG for PFS only contained one study[12] (66 patients). And the HRs were 3.22 (95% CI: 1.19–8.75) for MTV and 4.81 (95% CI: 1.51–15.28) for TLG, respectively.
3.4. Prognostic value of posttreatment SUVmax for OS and PFS
There were 2 studies (149 patients) about posttreatment SUVmax for OS and three studies (184 patients) about posttreatment SUVmax for PFS involved in the comparison, and the pooled significant HR were 2.25 (95% CI: 1.33–3.80) (Fig. 3A) and 2.87 (95% CI: 1.81–4.55) (Fig. 3B), respectively. Moreover, the significant heterogeneity in OS and PFS analysis were not found (I2 = 0%, P = 0.49; I2 = 41%, P = 0.18).
Figure 3.
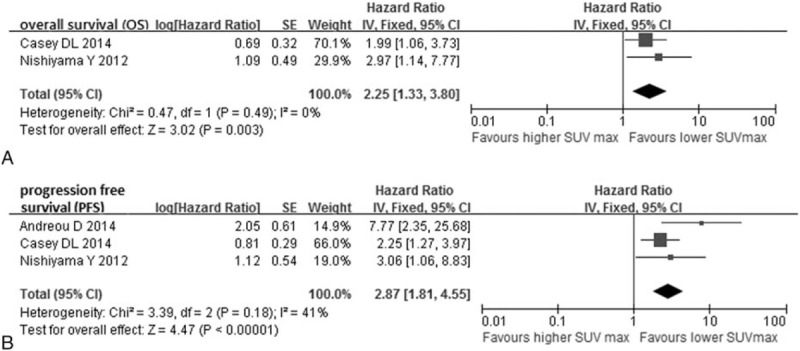
Forest plots of hazard ratio (HR) for overall survival (A) and progression-free survival (B) of posttreatment SUVmax.
4. Discussion
Standard uptake value (SUV) was consistently related with metabolic rate of FDG (MRFDG) in soft tissue sarcoma, which makes SUV a feasible way of detecting tumor malignancy.[26] And SUVmax, most widely reported, was considered as potential prognostic indicator in patients with sarcoma according to previous studies.[27] However, only providing information about the maximum value of a single voxel volume, SUVmax fails to measure the volume, burden, and heterogeneity of tumors with the shortcoming of reflecting significant prognostic value.[18] And volumetric measurements such as MTV and TLG, representing the whole metabolic volume, may have the capability to overcome limitations of SUVmax.[28,29] Nevertheless, there was a relationship between these parameters. TLG is influenced by SUV and MTV, and SUV as well as tumor volume have an impact on MTV, moreover, SUV itself can also vary with influencing factors.[30]
However, there are several contradictions existing in included studies of this meta-analysis. There existed a study[11] which reported significant association between pretherapeutic higher SUVmax, higher MTV, higher TLG and poorer OS in patients with synovial sarcoma. However, in another study,[13] SUVmax was regarded as a significant independent prognostic marker for OS in STS while MTV and TLG failed to provide with significant prognostic information. On the contrary, 1 article[12] reported the superiority of TLG being a more accurate predictor than MTV or SUVmax for PFS in patients with STS.
According to the proposed prognostic factor categories of Hayes et al,[31] a HR greater than 2 might be regarded as a strong prognostic factor while a moderate or weak prognostic factor would be defined as a HR of 1.5 to 2.0 and <1.5, respectively. Therefore, in this meta-analysis, the SUVmax represented significant prognostic value for OS and PFS on soft tissue sarcoma, whose HRs were 2.40 (95% CI: 1.38–4.17) and 2.20 (95% CI: 1.47–3.30), respectively. Of seven studies[11,13,18,20,22–24] in which multivariate analysis about SUVmax for OS was conducted, four[13,18,20,22] showed that SUVmax was independent prognostic marker. And in two[20,22] of three studies,[12,20,22] SUVmax was considered as independent prognostic factor for PFS. Meanwhile, the MTV and TLG both represented significant prognostic value for OS on soft tissue sarcoma, whose HRs were 3.20 (95% CI: 1.71–5.98) and 5.20 (95% CI: 2.34–11.56). However, due to the small amount of included articles, whether MTV and TLG were significant prognostic factors of PFS still needs further study.
The meta-analyses compared odds ratios (OR) on 1-, 3-, and 5-year of SUVmax for OS and PFS. Results demonstrated the correlation between survival outcome and PET parameters. According to the combined OR based on 1-, 3-, and 5-year OS and PFS, high SUVmax was associated with worse short- and long-term survival outcome and lesser survival benefit in patients with sarcoma. Combined with the conclusion in previous section, not only can SUVmax be prognostic marker but also may be used as predictors of survival or progression for both short and long term.
Histological grade systems applied in included studies were consist of the French Federation of Cancer Centers Sarcoma Group (FNCLCC) grading system,[32] the grade system established by Hasegawa et al.[33] By comparison, we found the survival results of SUVmax for OS and PFS were associated with higher risk among patients with high grade STS at higher proportion. These differences may probably be due to the many different histological types and large variation of malignancy of soft tissue sarcoma.[34] However, since that the related studies were too scanty to draw any conclusion, more large-scale studies are requisite to assess whether PET-CT shows unequal prognostic accuracy based on varied subgroups with soft tissue sarcoma.
Since PET-CT can be also used for monitoring the response of treatment in patients with STS, the posttreatment SUVmax can be regarded as a factor to prognosticate therapy response. The meta-analyses of posttreatment SUVmax for OS and PFS were statistically significant, and the HRs were 2.25 (95% CI: 1.33–3.80, I2 = 0%, P = 0.49) and 2.87 (95% CI: 1.81–4.55, I2 = 41%, P = 0.18), respectively. Widely used for evaluating therapy response of solid tumor, RECIST criteria divides tumor response into CR, PR, SD, and PD by measuring the tumor size based on the maximum length.[35] In consideration of the significant relation between SUVmax and survival outcome, PET-CT may be suggested as a promising tool to monitoring therapy response and marker of follow-up in patients with STS since the metabolic activity rather than morphologic information provided, which could exert an influence on the choice of surgical strategy and treatment.[36]
Significant heterogeneity was found when SUVmax predicts OS (I2 = 79%, P = 0.0001) (Fig. 2A). We made efforts to reduce the heterogeneity, and after the study[11] (HR = 1.11, 95% CI: 0.98–1.24) is excluded, the I2 and Chi-square value were reduced from 79% to 0% and 28.54 to 4.92. There were patients with synovial sarcoma alone in the study,[11] which may explain the insignificant differences in OS. In fact, soft tissue sarcoma is a kind of heterogeneous disease; the tumor can be derived from many types of tissue varying from place to place.[37] Moreover, the patient heterogeneity such as different histological types, grades, and stages, the data selection, acquisition, and calculation, and clinical treatment such as surgery, neoadjuvant chemotherapy, and radiotherapy, are all important and inevitable factors account for the heterogeneity between studies.[38]
There were several limitations. First, the meta-analysis was limited in published articles in English, that language bias may exist. Furthermore, due to the general low incidence of soft tissue sarcoma, only a few articles can be used for the analysis, and the studies available to analyze the prognostic values of SUVmax, MTV, and TLG were much fewer, which may influence the reliability of results. Moreover, the study designs of included articles were all retrospective. Thus considering the heterogeneity existed in the results, the small quantities of included studies and the retrospective design, larger and high-quality prospective studies especially related to volumetric parameters need to be conducted for evaluation of the prognostic value of PET-CT in soft tissue sarcoma.
5. Conclusion
In summary, the present meta-analysis demonstrated that the pretreatment SUVmax, MTV, and TLG from 18F-FDG PET-CT are significant prognostic markers for OS. The PET-CT can be effective tool in identifying high-risk patients with sarcoma referring to disease progression and patients’ survival. The results suggested that patients showing high SUVmax, MTV, or TLG may be related with poor survival. And the analysis for posttreatment SUVmax suggested PET-CT as a promising equipment in monitoring therapy response.
Footnotes
Abbreviations: CI = confidence interval, HR = hazard ratio, MTV = metabolic tumor volume, OR = odd ratio, OS = overall survival, PFS = progression-free survival, STS = soft tissue sarcoma, SUVmax = maximum standardized uptake value, TLG = total lesion glycolysis.
LC, XW, XM, and LG contributed equally to this work.
The authors have no conflicts of interest to disclose.
References
- [1].Thway K. Pathology of soft tissue sarcomas. Clin Oncol 2009;21:695–705. [DOI] [PubMed] [Google Scholar]
- [2].Zambo I, Vesely K. WHO classification of tumours of soft tissue and bone 2013: the main changes compared to the 3rd edition. Cesk Patol 2014;50:64–70. [PubMed] [Google Scholar]
- [3].Klein MJ, Siegal GP. Osteosarcoma: anatomic and histologic variants. Am J Clin Pathol 2006;125:555–81. [DOI] [PubMed] [Google Scholar]
- [4].Siegel R, Naishadham D, Jemal A. Cancer statistics for Hispanics/Latinos, 2012. CA Cancer J Clin 2012;62:283–98. [DOI] [PubMed] [Google Scholar]
- [5].Kauczor HU, Schwickert HC, Mayer E, et al. Pulmonary artery sarcoma mimicking chronic thromboembolic disease: computed tomography and magnetic resonance imaging findings. Cardiovasc Intervent Radiol 1994;17:185–9. [DOI] [PubMed] [Google Scholar]
- [6].Aisen AM, Martel W, Braunstein EM, et al. MRI and CT evaluation of primary bone and soft-tissue tumors. AJR Am J Roentgenol 1986;146:749–56. [DOI] [PubMed] [Google Scholar]
- [7].Garcia R, Kim EE, Wong FC, et al. Comparison of fluorine-18-FDG PET and technetium-99m-MIBI SPECT in evaluation of musculoskeletal sarcomas. J Nucl Med 1996;37:1476–9. [PubMed] [Google Scholar]
- [8].Ioannidis JP, Lau J. 18F-FDG PET for the diagnosis and grading of soft-tissue sarcoma: a meta-analysis. J Nucl Med 2003;44:717–24. [PubMed] [Google Scholar]
- [9].Jaskowiak CJ, Bianco JA, Perlman SB, et al. Influence of reconstruction iterations on 18F-FDG PET/CT standardized uptake values. J Nucl Med 2005;46:424–8. [PubMed] [Google Scholar]
- [10].Biehl KJ, Kong FM, Dehdashti F, et al. 18F-FDG PET definition of gross tumor volume for radiotherapy of non-small cell lung cancer: is a single standardized uptake value threshold approach appropriate? J Nucl Med 2006;47:1808–12. [PubMed] [Google Scholar]
- [11].Chang KJ, Lim I, Park JY, et al. The role of (18)F-FDG PET/CT as a prognostic factor in patients with synovial sarcoma. Nucl Med Mol Imaging 2015;49:33–41. [DOI] [PMC free article] [PubMed] [Google Scholar]
- [12].Choi ES, Ha SG, Kim HS, et al. Total lesion glycolysis by 18F-FDG PET/CT is a reliable predictor of prognosis in soft-tissue sarcoma. Eur J Nucl Med Mol Imaging 2013;40:1836–42. [DOI] [PubMed] [Google Scholar]
- [13].Hong SP, Lee SE, Choi YL, et al. Prognostic value of 18F-FDG PET/CT in patients with soft tissue sarcoma: comparisons between metabolic parameters. Skeletal Radiol 2014;43:641–8. [DOI] [PubMed] [Google Scholar]
- [14].Tierney JF, Stewart LA, Ghersi D, et al. Practical methods for incorporating summary time-to-event data into meta-analysis. Trials 2007;8:16. [DOI] [PMC free article] [PubMed] [Google Scholar]
- [15].McShane LM, Altman DG, Sauerbrei W, et al. Reporting recommendations for tumor marker prognostic studies (remark). Exp Oncol 2006;28:99–105. [PubMed] [Google Scholar]
- [16].Higgins JP, Thompson SG, Deeks JJ, et al. Measuring inconsistency in meta-analyses. BMJ 2003;327:557–60. [DOI] [PMC free article] [PubMed] [Google Scholar]
- [17].Begg CB, Mazumdar M. Operating characteristics of a rank correlation test for publication bias. Biometrics 1994;50:1088–101. [PubMed] [Google Scholar]
- [18].Andersen KF, Fuglo HM, Rasmussen SH, et al. Semi-quantitative calculations of primary tumor metabolic activity using F-18 FDG PET/CT as a predictor of survival in 92 patients with high-grade bone or soft tissue sarcoma. Medicine 2015;94:e1142. [DOI] [PMC free article] [PubMed] [Google Scholar]
- [19].Casey DL, Wexler LH, Fox JJ, et al. Predicting outcome in patients with rhabdomyosarcoma: role of [(18)f]fluorodeoxyglucose positron emission tomography. Int J Radiat Oncol Biol Phys 2014;90:1136–42. [DOI] [PubMed] [Google Scholar]
- [20].Skamene SR, Rakheja R, Dahlstrom KR, et al. Metabolic activity measured on PET/CT correlates with clinical outcomes in patients with limb and girdle sarcomas. J Surg Oncol 2014;109:410–4. [DOI] [PubMed] [Google Scholar]
- [21].Andreou D, Boldt H, Pink D, et al. Prognostic relevance of (1)(8)F-FDG PET uptake in patients with locally advanced, extremity soft tissue sarcomas undergoing neoadjuvant isolated limb perfusion with TNF-alpha and melphalan. Eur J Nucl Med Mol Imaging 2014;41:1076–83. [DOI] [PubMed] [Google Scholar]
- [22].Nishiyama Y, Tateishi U, Kawai A, et al. Prediction of treatment outcomes in patients with chest wall sarcoma: evaluation with PET/CT. Jpn J Clin Oncol 2012;42:912–8. [DOI] [PubMed] [Google Scholar]
- [23].Schuetze SM, Rubin BP, Vernon C, et al. Use of positron emission tomography in localized extremity soft tissue sarcoma treated with neoadjuvant chemotherapy. Cancer 2005;103:339–48. [DOI] [PubMed] [Google Scholar]
- [24].Ha SC, Oh JS, Roh JL, et al. Pretreatment tumor SUVmax predicts disease-specific and overall survival in patients with head and neck soft tissue sarcoma. Eur J Nucl Med Mol Imaging 2016;1–8. [DOI] [PubMed] [Google Scholar]
- [25].Andersen KF, Fuglo HM, Rasmussen SH, et al. Volume-based F-18 FDG PET/CT imaging markers provide supplemental prognostic information to histologic grading in patients with high-grade bone or soft tissue sarcoma. Medicine 2015;94:e2319. [DOI] [PMC free article] [PubMed] [Google Scholar]
- [26].Eary JF, Mankoff DA. Tumor metabolic rates in sarcoma using FDG PET. J Nucl Med 1998;39:250–4. [PubMed] [Google Scholar]
- [27].Rakheja R, Makis W, Tulbah R, et al. Necrosis on FDG PET/CT correlates with prognosis and mortality in sarcomas. AJR Am J Roentgenol 2013;201:170–7. [DOI] [PubMed] [Google Scholar]
- [28].Larson SM, Erdi Y, Akhurst T, et al. Tumor treatment response based on visual and quantitative changes in global tumor glycolysis using PET-FDG imaging. The visual response score and the change in total lesion glycolysis. Clin Positron Imaging 1999;2:159–71. [DOI] [PubMed] [Google Scholar]
- [29].Lee P, Weerasuriya DK, Lavori PW, et al. Metabolic tumor burden predicts for disease progression and death in lung cancer. Int J Radiat Oncol Biol Phys 2007;69:328–33. [DOI] [PubMed] [Google Scholar]
- [30].Im HJ, Pak K, Cheon GJ, et al. Prognostic value of volumetric parameters of (18)F-FDG PET in non-small-cell lung cancer: a meta-analysis. Eur J Nucl Med Mol Imaging 2015;42:241–51. [DOI] [PubMed] [Google Scholar]
- [31].Hayes DF, Isaacs C, Stearns V. Prognostic factors in breast cancer: current and new predictors of metastasis. J Mammary Gland Biol Neoplasia 2001;6:375–92. [DOI] [PubMed] [Google Scholar]
- [32].Guillou L, Coindre JM, Bonichon F, et al. Comparative study of the National Cancer Institute and French Federation of Cancer Centers Sarcoma Group grading systems in a population of 410 adult patients with soft tissue sarcoma. J Clin Oncol 1997;15:350–62. [DOI] [PubMed] [Google Scholar]
- [33].Hasegawa T, Yamamoto S, Nojima T, et al. Validity and reproducibility of histologic diagnosis and grading for adult soft-tissue sarcomas. Hum Pathol 2002;33:111–5. [DOI] [PubMed] [Google Scholar]
- [34].Coindre JM, Terrier P, Guillou L, et al. Predictive value of grade for metastasis development in the main histologic types of adult soft tissue sarcomas: a study of 1240 patients from the French Federation of Cancer Centers Sarcoma Group. Cancer 2001;91:1914–26. [DOI] [PubMed] [Google Scholar]
- [35].Eisenhauer EA, Therasse P, Bogaerts J, et al. New response evaluation criteria in solid tumours: revised RECIST guideline (version 1.1). Eur J Cancer (Oxford, England: 1990) 2009;45:228–47. [DOI] [PubMed] [Google Scholar]
- [36].Schulte M, Brecht-Krauss D, Werner M, et al. Evaluation of neoadjuvant therapy response of osteogenic sarcoma using FDG PET. J Nucl Med 1999;40:1637–43. [PubMed] [Google Scholar]
- [37].O'Sullivan F, Roy S, Eary J. A statistical measure of tissue heterogeneity with application to 3D PET sarcoma data. Biostatistics (Oxford, England) 2003;4:433–48. [DOI] [PubMed] [Google Scholar]
- [38].Eary JF, O'Sullivan F, Powitan Y, et al. Sarcoma tumor FDG uptake measured by PET and patient outcome: a retrospective analysis. Eur J Nucl Med Mol Imaging 2002;29:1149–54. [DOI] [PubMed] [Google Scholar]


