Supplemental Digital Content is available in the text
Keywords: arterial stiffness, community-based, longitudinal study, predictor, uric acid
Abstract
Hyperuricemia has been demonstrated to be a risk factor for cardiovascular diseases. Though the association between uric acid (UA) and arterial stiffness has been investigated previously in patients with basic diseases, the predictive value of baseline UA level for arterial stiffness has not been conducted. We aimed at identifying the predictive role of UA for arterial stiffness prospectively.
A longitudinal follow-up study in a routine health check-up population was performed with an average follow-up of 4.8 years. The demographic information, baseline and follow-up anthropometric parameters, arterial stiffness (pulse-wave velocity, PWV), and biomarker variables including UA have been measured and analyzed.
A total of 1447 valid follow-ups were available for the final analysis. Both of the baseline and follow-up UA levels were significantly higher in the arterial stiffness groups than that in the nonarterial stiffness groups (all P values <0.001). The follow-up carotid-femoral PWV [(cf-PWV), r = 0.161, P < 0.001] was strongly correlated with baseline UA. At the follow-up cross-section, cf-PWV was also closely associated with UA (r = 0.101, P < 0.001). Logistic regressions revealed that a higher baseline UA level was an independent predictor of follow-up arterial stiffness assessed by cf-PWV [odds ratio (OR): 1.824; P = 0.046].
A higher baseline level of UA is closely related to arterial stiffness and is an independent predictor of arterial stiffening.
1. Introduction
Hyperuricemia has been demonstrated to be an independent risk factor for cardiovascular diseases including arterial stiffness, atherosclerosis, and hypertension.[1–3] Uric acid (UA) abnormalities are also associated with hypertension, regional arterial stiffness in patients with renal failure, and diabetes mellitus (DM).[4–8] Furthermore, a relationship between normal serum UA and arterial stiffness has also been reported before.[9–11] UA may be involved in the pathogenesis of arterial stiffness and hypertension potentially as a result of thickening vessel walls (intima-media) by promoting smooth muscle cell proliferation and endothelial cell dysfunction.[12–14]
It is well known that arterial stiffness is a marker of aging including blood vessel aging, and arterial stiffness has been identified as a risk factor for prepathophysiological processes in numerous cardiovascular (such as hypertension and other cardiovascular diseases) and cerebrovascular diseases.[15–19] Furthermore, there are several cardiocerebral diseases may be subsequences of arterial stiffening. Arterial stiffening is also the hallmark of normal vascular aging, and early acceleration of the stiffening process represents one of the major pathologies of the cardiovascular system.[20] There are several methods for quantifying arterial mechanical properties have been proposed.[21,22] The most commonly used technique is measurement of the pulse-wave velocity (PWV) which provides a noninvasive method of assessing stiffness along an arterial section in the clinical practice.[21,23] Currently, PWV is used as a reproducible and valid noninvasive “gold standard indicator” in the assessment of arterial stiffness.[23] Nevertheless, PWVs from different arteries usually represent stiffening in distinct regions of the vasculature. Particularly, carotid-femoral PWV (cf-PWV) and carotid-radial PWV (cr-PWV) are often applied to assess stiffness in the aorta and arterioles.
Though the previous results are inconsistent, evidence is accumulating to indicate an association between serum UA level and arterial stiffness. The previous studies have documented that the UA were associated with hypertension, arterial stiffness, and other vascular alterations.[8,24] However, most of the studies have been conducted based on the patients with various disorders such as DM, hypertension, and chronic kidney disease, as well as among various ethnic groups.[25–27] To the best of our knowledge, there are few reports of follow-up studies evaluating the role of the baseline level of UA in arterial stiffness. Thus, we postulated that a higher UA level may also play a critical role in aggravating arterial stiffness as evaluated by cf-PWV, and UA has a critical role in increasing arterial stiffness. We have conducted this follow-up observational study with the aim of providing novel indices for stratification and risk management of arterial stiffness.
2. Methods
2.1. Participants and procedures
A total of 1680 participants who underwent a routine health examination were recruited between September 2007 and January 2009 from the Pingguoyuan area in the Shijingshan district in this community-based follow-up cohort study. Residents who received a routine health check-up in the community were eligible for inclusion. Subjects with any of the follow conditions were excluded: infection, and neoplastic or severe liver or renal diseases.
2.2. Follow-up and outcome assessment
All participants were followed up for all-cause mortality, cardiovascular disease mortality, arterial stiffness, and the development of DM from the initial screening to September 2013. During a median of 4.8-year follow-up of the 1680 subjects, 181 participants were lost to follow up and were excluded from the final analysis. Thus, 1499 subjects (follow-up rate 89.2%) completed the follow-up, and 52 were excluded because of death. Finally, 1447 participants were valid for the analysis.
The present study was reviewed and approved by the Ethics Committee at the People's Liberation Army General Hospital. The study was explained in detail to all of the subjects who agreed to participate in, and all of the subjects signed informed consent forms before their examinations.
2.3. Clinical data collection
The participants were followed up by our trained physicians, and a standardized self-report questionnaire form was used to record demographic information, lifestyle factors, prevalent diseases, family history, and medication use. Anthropometrics were evaluated by trained medical doctors. Height was measured in centimeters using a wall-mounted measuring tape, and weight was measured using a digital scale in kilograms (without shoes). Self-reported smoking status was categorized as current, former, or never smoking. Systolic blood pressure (SBP) and diastolic blood pressure (DBP) were measured on the right arm in a sitting position after a 5-minute rest period.
2.4. Biomarker variable determination
Venous blood samples were obtained from subjects between 8 am and 10 am after an overnight fast (at least 12 hours). Plasma aliquots were obtained and stored at −80°C for further assays. Plasma UA, fasting blood glucose (FBG), triglyceride (TG), low-density lipoprotein cholesterol (LDL-C), and high-density lipoprotein cholesterol (HDL-C) concentrations were measured from venous blood samples using commercially available ELISA kits by Roche enzymatic assays (Roche Diagnostics GmbH, Mannheim, Germany). The concentration of plasma creatinine (Cr) was measured by an enzymatic assay (Roche Diagnostics GmbH) on a Hitachi 7600 autoanalyzer (Hitachi, Tokyo, Japan). In addition, the non-DM subjects received the standard 75-g oral glucose tolerance test.
All of the biochemical variables were measured from the blood specimens in the Clinical Laboratory Department, Chinese PLA General Hospital, following the criteria of the World Health Organization Lipid Reference Laboratories.
2.5. Assessment of arterial stiffness
Baseline and follow-up arterial stiffness was assessed by automatic carotid-femoral PWV (cf-PWV) measurement using a Complior SP device (Createch Industrie, Massy, France) after a 5- to 10-minute rest. PWV (m/s) = distance (m)/transit time (s). The detailed procedure was described in Appendix 1 (assessment of arterial stiffness in detail).
2.6. Definitions of variables
Hypertension was defined as a SBP ≥140 mm Hg and/or a DBP ≥90 mm Hg or the use of antihypertensive medications. Other variables such as body mass index (BMI) and smoking were defined in Appendix 1 (definition of variables in detail). Arterial stiffness group (AS-group) was defined as: patients with a follow-up cf-PWV ≥12 m/s.[22,28] The detailed definition of variables is described in Appendix 1.
2.7. Statistical analysis
Normally distributed baseline continuous variables are expressed as the mean ± standard deviation (SD) and were analyzed with Student t tests, while the baseline dichotomous variables are presented as numbers (percentages) and compared using the Chi-square test. Nonnormally distributed variables, such as UA levels and other biomarkers, were normalized by natural logarithm transformation as necessary.
A Pearson regression analysis, a multivariable linear regression analysis, and a multicollinearity analysis were performed to evaluate the associations of UA (natural logarithm transformed) level with arterial stiffness and other parameters at both baseline and the end of the follow-up.
Further analysis by a forward stepwise multivariable logistic regression analysis were performed to identify the association between UA (baseline) and the follow-up arterial stiffness (cf-PWV ≥12 m/s vs cf-PWV <12 m/s). Regression models were adjusted for age and sex as the independent variable (Model 1) and additionally adjusted for smoking, alcohol use (g/d), DM, SBP, DBP, TG, LDL-C, HDL-C, and Cr as the independent variables (Model 2, Fig. 1).
Figure 1.
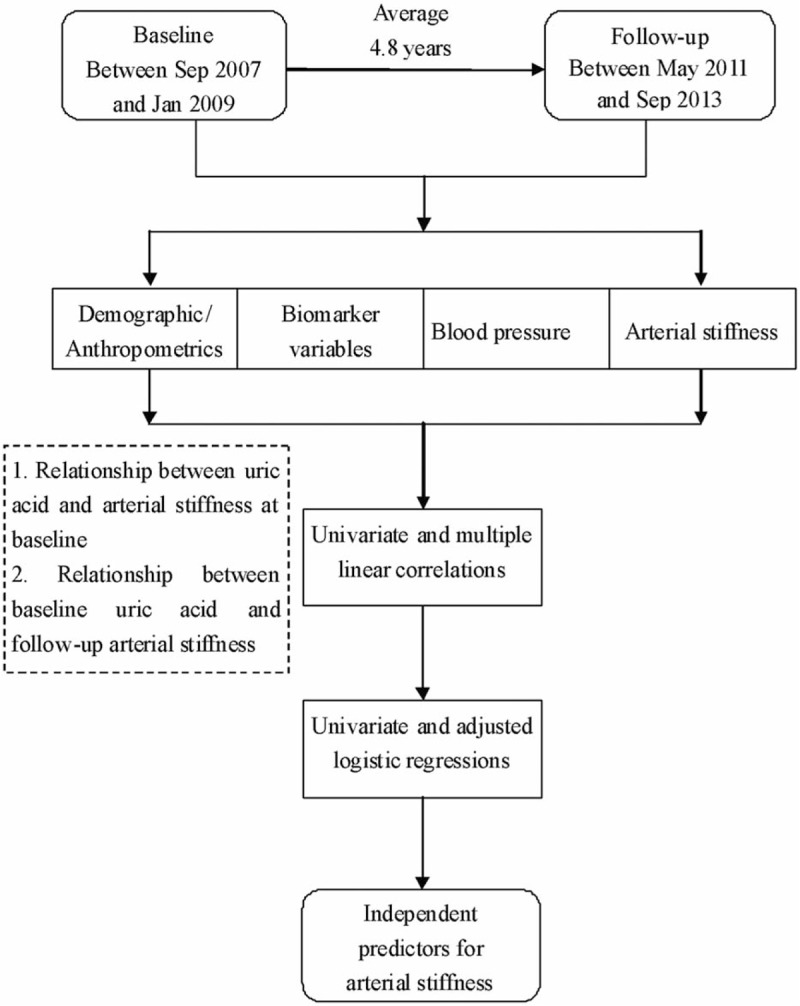
Flow diagram of this study.
All analyses were performed using SPSS 19.0 for Windows (SPSS, Chicago, IL). P-value < 0.05 is considered to be statistically significant. Statisticians from the People's Liberation Army General Hospital were consulted regarding all of the statistical methods and results.
3. Results
3.1. Baseline clinical characteristics
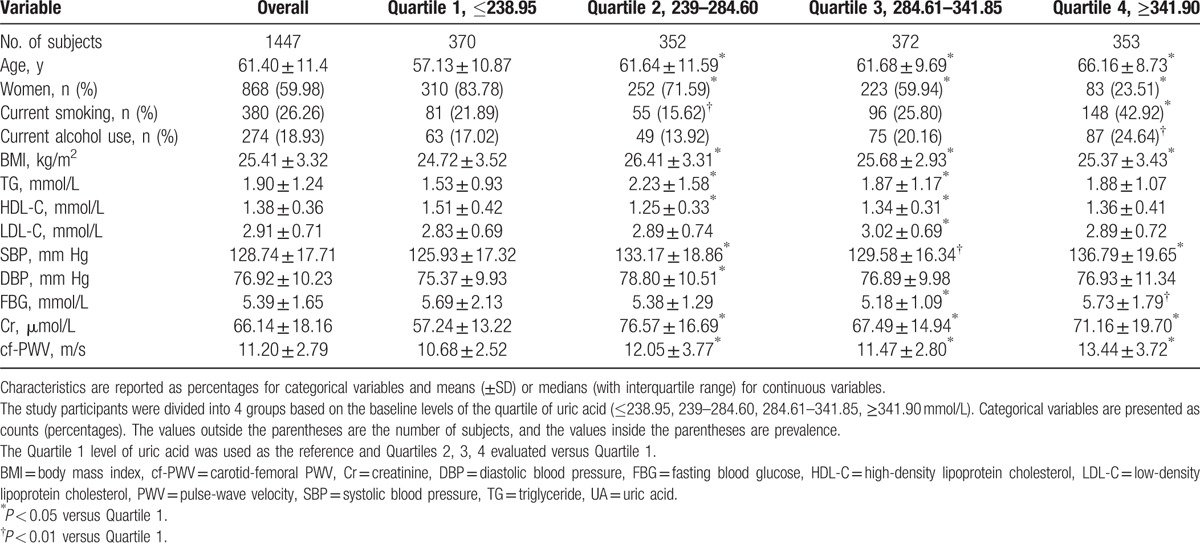
The mean age of the subjects was 61.40 ± 11.4 years, and 59.98% were women. The body mass index (BMI) of the subjects in the study was 25.41 ± 3.32 kg/m2. Altogether, 26.26% and 18.93% of the subjects smoke and drink currently. The characteristics of the subjects categorized by UA levels at baseline are shown in Table 1.
Table 1.
Characteristics of the subjects categorized by uric acid levels at baseline.
3.2. Associations between UA level and arterial stiffness at baseline
At baseline, Pearson analysis showed that the UA level was strongly related to baseline cf-PWV (r = 0.183, P < 0.001). Additionally, age (r = 0.509, P < 0.001), SBP (r = 0.351, P < 0.001), LDL-C (r = 0.069, P = 0.014), HDL-C (r = −0.101, P < 0.001), Cr (r = 0.140, P < 0.001), and TG (r = 0.111, P < 0.001) were also closely associated with cf-PWV in the univariate linear analysis (Table 1A in Appendix 2). However, in the multivariable analysis, UA level was not correlated with cf-PWV (β = 0.555, P = 0.065), which was adjusted by age, DBP, Cr, and TG in the multivariable linear analysis (Appendix 2, Table 1A).
3.3. Baseline UA level was closely associated with follow-up arterial stiffness
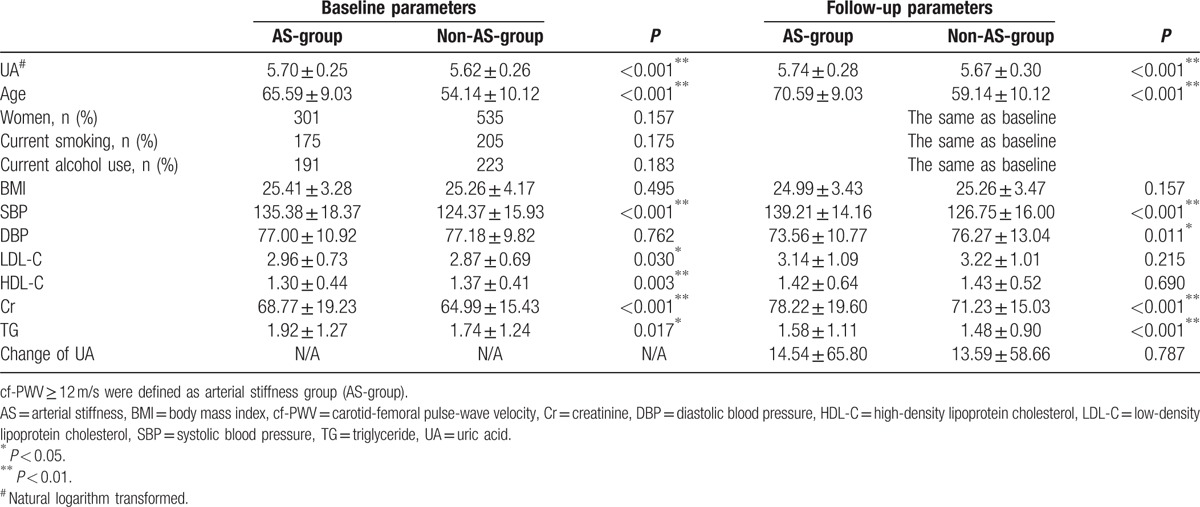
The UA level at baseline in the AS-group was significantly higher than that in the non-AS-group, while it was similar between the 2 groups at the follow-up cross-section (Table 2). Differences in other baseline parameters including age, BMI, cholesterol, and blood pressure between the 2 groups are shown in Table 2.
Table 2.
Differences in baseline and follow-up perimeters between AS and non-AS-groups.
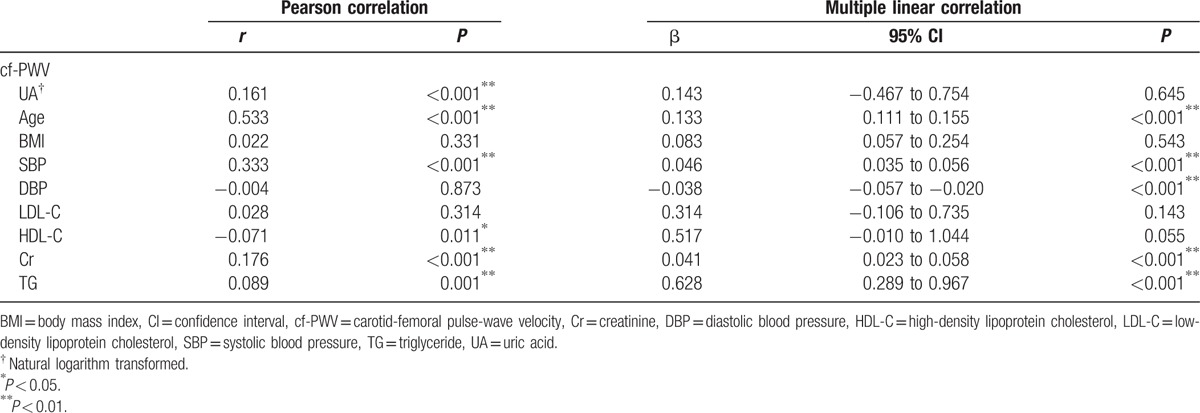
To identify the association between baseline UA and follow-up arterial stiffness, Pearson correlation analyses were employed. The univariate analysis revealed that baseline UA (r = 0.161, P < 0.001), age (r = 0.533, P < 0.001), SBP (r = 0.333, P < 0.001), Cr (r = 0.176, P < 0.001), and TG (r = 0.089, P < 0.001) were positively correlated with the follow-up cf-PWV, while HDL-C (r = −0.071, P = 0.011) was negatively associated with the follow-up cf-PWV. Though the multiple linear regression analysis revealed no association between baseline UA and follow-up cf-PWV (β = 0.143, P = 0.645), the baseline age, SBP, DBP, Cr, and TG were still strongly correlated with the follow-up cf-PWV (Table 3).
Table 3.
Univariate and multiple linear correlation analysis of baseline parameters and follow-up cf-PWV.
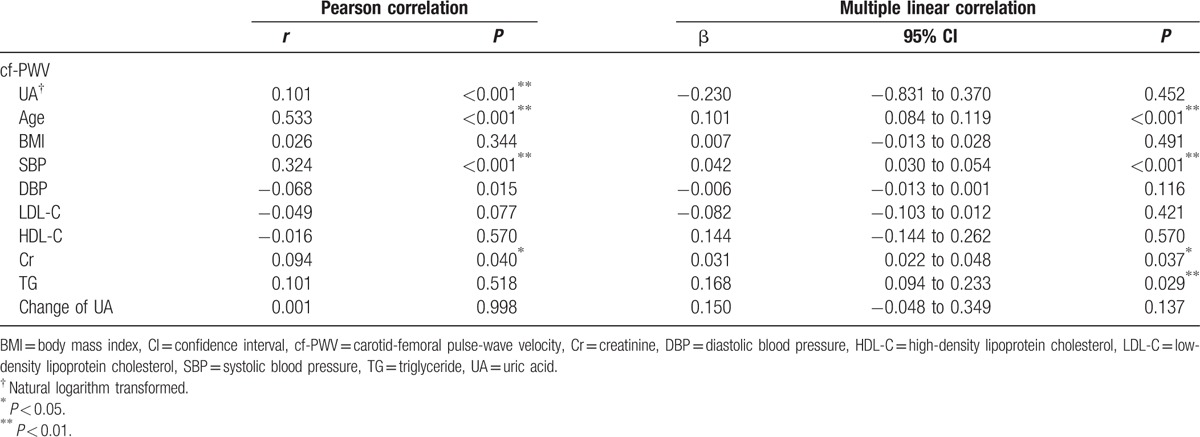
The results of the univariate and multiple Pearson linear regression analyses for cf-PWV and other parameters at follow-up cross-section are summarized in Table 4 which also showed the association between cf-PWV and UA level at the follow-up cross-section. We have also analyzed the association between the changes of UA levels and cf-PWV. However, we have observed no significant associations (Tables 2 and 4).
Table 4.
Univariate and multiple linear correlation analysis of the parameters and arterial stiffness at follow-up.
3.4. Logistic regressions for UA and arterial stiffness
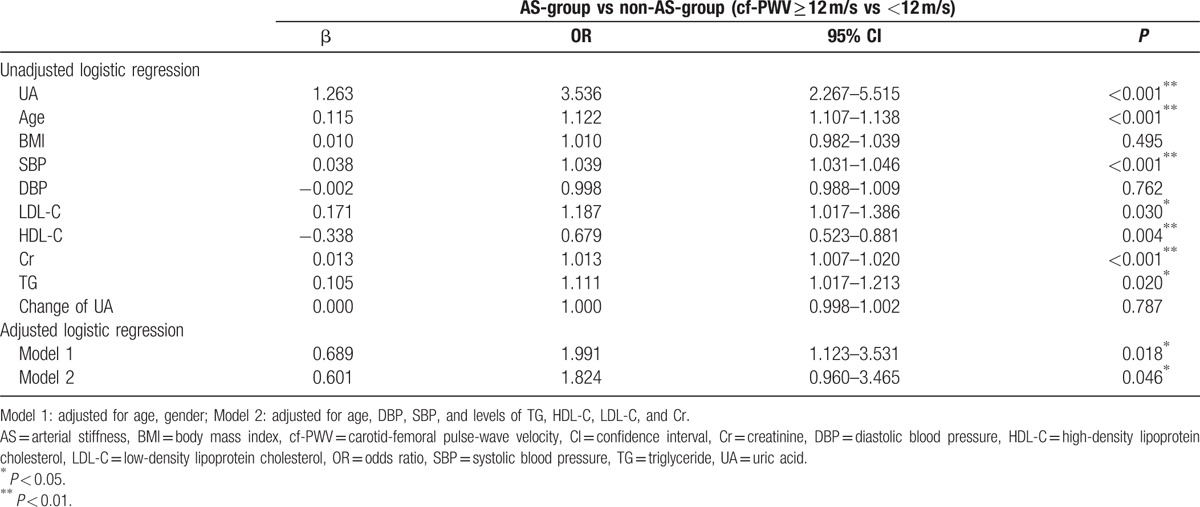
Univariate logistic regression showed that a higher baseline UA level was a risk factor for follow-up arterial stiffness measured by cf-PWV [β = 1.263, OR (odds ratio): 3.536, 95% CI (confidence interval): 2.267–5.515, P < 0.001]. Additionally, a higher baseline age, SBP, LDL-C, Cr, and TG were also shown to be risk factors for arterial stiffness (all P values < 0.05). Whilst, a higher baseline HDL-C level was a protective factor for arterial stiffness. Furthermore, the age- and gender-adjusted model also revealed that a higher baseline UA level was associated with a greater risk for arterial stiffness (β = 0.689, OR: 1.991, 95% CI: 1.123–3.531, P = 0.018). Importantly, a higher baseline UA level remained a predictor of arterial stiffening measured by cf-PWV at follow-up (β = 0.601, OR: 1.824, 95% CI: 0.960–3.465, P = 0.046) in Model 2, which was adjusted by age, DBP, SBP, and levels of TG, HDL-C, LDL-C, and Cr. Thus, these results demonstrate that a higher baseline UA level is an independent predictor of central arterial stiffening (Table 5).
Table 5.
Univariate and multiple logistic regressions for baseline parameters and follow-up cf-PWV.
4. Discussion
In the present 4.8-year follow-up study, we found that the baseline UA level was associated with a measurement of arterial stiffness, cf-PWV. Furthermore, a higher baseline UA level was an independent predictor of follow-up central arterial stiffness (cf-PWV).
4.1. UA and its distribution in the health check-up population
As the end-product of purine nucleotide metabolism, UA participates in many pathophysiological processes of vascular diseases. Over the past few decades, hyperuricemia has been found to be a risk factor for cardiovascular and cerebrovascular diseases, such as atherosclerosis and hypertension.[4,7] However, the predictive role of UA in health examinations is unclear.
In the present study, we observed that higher UA levels are accompanied with higher cf-PWV values, indicating that the higher range of UA may contribute to arterial stiffening. This result was partly consistent with previous studies. Furthermore, individuals with higher levels (such as Quartiles 3 and 4) of UA accounted for almost half of the health check-up population and usually presented with multiple cardiovascular risk factors. Thus, individuals with higher UA levels require proper cardiovascular risk stratification and management.
4.2. UA level was associated with arterial stiffness
Arterial stiffness occurs in both aortic and peripheral arteries. A large number of studies have indicated that UA is related to arterial stiffening as assessed by brachial-ankle PWV or heart-femoral PWV.[11,24] In the present study, we employed cf-PWV which is a more specific measurement of central arterial stiffness, and also found an association with baseline UA.
Though previous cross-sectional studies have evaluated risk factors for arterial stiffness,[11,24,26,27] the predictive value of UA level for arterial stiffness has not been confirmed. Our longitudinal survey revealed that a high UA level is an independent predictor of arterial stiffness. The present study prospectively revealed that UA correlated with aortic arterial stiffening at baseline and, in particular, a higher baseline UA was independently associated with follow-up arterial stiffness. Subclinical arterial stiffening may already exist in healthy individuals, and a high UA level may be useful in predicting the incidence of arterial stiffening prospectively.
To date, although various studies have focused on the association between UA and arterial stiffness, the mechanisms underlying the UA contribution to arterial stiffening have not been clearly elucidated. Several scientific investigations have demonstrated significant roles of UA in arterial stiffness.[12,13,29]
Firstly, UA contributes to the thickening of the vascular wall via promoting proliferation and differentiation of smooth muscle cells. The biological behaviors of smooth muscle cells above-mentioned are triggered by the activated renin-angiotensin system and reactive oxygen species.[30–32] Secondly, studies have also indicated that the essential role of UA in arterial stiffness before the development of hypertension may be attributed to the activation of inflammatory pathways (increased levels of C-reactive protein and other proinflammatory factors).[33] Thirdly, UA has also been implicated in endothelial cell dysfunction, which plays a crucial role in arterial stiffening. UA may participate in arterial stiffness via the nitric oxide pathway dysfunction, oxidative stress, and insulin resistance, which cause endothelial cell dysfunction. Endothelial cell dysfunction further leads to increased proliferation and migration of smooth muscle cells and the rearrangement of artery wall components.[12,29] These changes decrease the compliance and stiffen arteries functionally and structurally.
4.3. Higher baseline UA level was an independent predictor of arterial stiffness
Further analysis by logistic regressions indicated that a higher baseline UA level was an independent risk factor/predictor of central stiffness. In both adjusted models, higher UA levels were associated with arterial stiffness measured by cf-PWV, indicating that a higher UA level was an independent predictor of central arterial stiffening.
Although other cross-sectional studies have identified that UA is risk for arterial stiffness, the predictive value of UA for arterial stiffness has not been confirmed in a long-term longitudinal study.[11,24,25,34] Thus, we conducted this follow-up study and demonstrated that a high UA level is an independent predictor of arterial stiffness. Our observations confirm the association between UA and arterial stiffness and its predictive value for arterial stiffness.
5. Conclusions
A higher baseline level of UA is closely related to arterial stiffness and is an independent risk factor for and predictor of arterial stiffness. Thus, plasma UA levels may be useful for arterial stiffness risk stratification and management.
6. Limitations
The participants in this study were recruited from 2 districts in Beijing instead of from random sampling all over the country. The results may not be representative of Chinese individuals from other regions. The unavoidable limitation is that a total of 181 subjects (10.7%) were lost to follow-up, which may introduce bias in the conclusions.
Supplementary Material
Acknowledgments
We are also grateful to all the study participants for their participation in the study. We thank colleagues at the Department of Laboratory Medicine, the PLA General Hospital, for help with the biochemical measurements. We also thank Xiaona Wang for the suggestions on statistics.
Footnotes
Abbreviations: AS-group = arterial stiffness group, BMI = body mass index, cf-PWV = carotid-femoral pulse-wave velocity, CI = confidence interval, Cr = creatinine, cr-PWV = carotid-radial pulse-wave velocity, DBP = diastolic blood pressure, DM = diabetes mellitus, FBG = fasting blood glucose, HDL-C = high-density lipoprotein cholesterol, LDL-C = low-density lipoprotein cholesterol, OR = odds ratio, PWV = pulse-wave velocity, SBP = systolic blood pressure, SD = standard deviation, TG = triglyceride, UA = uric acid.
This research was supported by a grant from the National Nature Science Foundation of China (81270941), the Key National Basic Research Program of China (2012CB517503, 2013CB530804) to Dr. Ye Ping.
X-HD and XW contributed equally to this study.
Authors’ contributions: PY participated in the design of this research. X-HD and PY also drafted the manuscript and performed the statistical analyses. PY and RC reviewed and revised this manuscript critically for important intellectual content. X-HD, XW, XY, WX, YZ, YB, and HW completed the collection of clinical data and performed the measurements of BP, HR, and the biomarker. YB and XW conducted the arterial stiffness measurements.
The authors have no conflicts of interest to disclose.
Supplemental Digital Content is available for this article.
References
- [1].Abeles AM. Hyperuricemia, gout, and cardiovascular disease: an update. Curr Rheumatol Rep 2015;17:13. [DOI] [PubMed] [Google Scholar]
- [2].Gudino Gomezjurado A. Hyperuricemia as a risk factor for cardiovascular disease: clinical review. Medwave 2016;16:e6606. [DOI] [PubMed] [Google Scholar]
- [3].Winter WE. Hyperuricemia and Cardiovascular Disease: What is Left to Prove? Metab Syndr Relat Disord 2016;10:1–2. [DOI] [PubMed] [Google Scholar]
- [4].Borghi C, Rosei EA, Bardin T, et al. Serum uric acid and the risk of cardiovascular and renal disease. J Hypertens 2015;33:1729–41. discussion 1741. [DOI] [PubMed] [Google Scholar]
- [5].Dai XM, Wei L, Ma LL, et al. Serum uric acid and its relationship with cardiovascular risk profile in Chinese patients with early-onset coronary artery disease. Clin Rheumatol 2015;34:1605–11. [DOI] [PubMed] [Google Scholar]
- [6].Iliesiu A, Campeanu A, Dusceac D. Serum uric acid and cardiovascular disease. Maedica (Buchar) 2010;5:186–92. [PMC free article] [PubMed] [Google Scholar]
- [7].Kawai T, Ohishi M, Takeya Y, et al. Serum uric acid is an independent risk factor for cardiovascular disease and mortality in hypertensive patients. Hypertens Res 2012;35:1087–92. [DOI] [PubMed] [Google Scholar]
- [8].Tangri N, Weiner DE. Uric acid, CKD, and cardiovascular disease: confounders, culprits, and circles. Am J Kidney Dis 2010;56:247–50. [DOI] [PMC free article] [PubMed] [Google Scholar]
- [9].Canepa M, Viazzi F, Strait JB, et al. Longitudinal association between serum uric acid and arterial stiffness: results from the Baltimore Longitudinal Study of Aging. Hypertension 2017;69:228–35. [DOI] [PMC free article] [PubMed] [Google Scholar]
- [10].Elsurer R, Afsar B. Serum uric acid and arterial stiffness in hypertensive chronic kidney disease patients: sex-specific variations. Blood Press Monit 2014;19:271–9. [DOI] [PubMed] [Google Scholar]
- [11].Zhang J, Xiang G, Xiang L, et al. Serum uric acid is associated with arterial stiffness in men with newly diagnosed type 2 diabetes mellitus. J Endocrinol Invest 2014;37:441–7. [DOI] [PubMed] [Google Scholar]
- [12].Kanellis J, Watanabe S, Li JH, et al. Uric acid stimulates monocyte chemoattractant protein-1 production in vascular smooth muscle cells via mitogen-activated protein kinase and cyclooxygenase-2. Hypertension 2003;41:1287–93. [DOI] [PubMed] [Google Scholar]
- [13].Park JH, Jin JM, Hwang S, et al. Uric acid attenuates nitric oxide production by decreasing the interaction between endothelial nitric oxide synthase and calmodulin in human umbilical vein endothelial cells: a mechanism for uric acid-induced cardiovascular disease development. Nitric Oxide 2013;32:36–42. [DOI] [PubMed] [Google Scholar]
- [14].Rao GN, Corson MA, Berk BC. Uric acid stimulates vascular smooth muscle cell proliferation by increasing platelet-derived growth factor A-chain expression. J Biol Chem 1991;266:8604–8. [PubMed] [Google Scholar]
- [15].Lee HY, Oh BH. Aging and arterial stiffness. Circ J 2010;74:2257–62. [DOI] [PubMed] [Google Scholar]
- [16].Ma Y, Zhou L, Dong J, et al. Arterial stiffness and increased cardiovascular risk in chronic kidney disease. Int Urol Nephrol 2015;47:1157–64. [DOI] [PubMed] [Google Scholar]
- [17].Mestanik M, Jurko A, Mestanikova A, et al. Arterial stiffness evaluated by cardio-ankle vascular index (CAVI) in adolescent hypertension. Can J Physiol Pharmacol 2016;94:112–6. [DOI] [PubMed] [Google Scholar]
- [18].Palombo C, Kozakova M. Arterial stiffness, atherosclerosis and cardiovascular risk: pathophysiologic mechanisms and emerging clinical indications. Vascul Pharmacol 2016;77:1–7. [DOI] [PubMed] [Google Scholar]
- [19].Sun Z. Aging, arterial stiffness, and hypertension. Hypertension 2015;65:252–6. [DOI] [PMC free article] [PubMed] [Google Scholar]
- [20].Protogerou AD, Papaioannou TG, Vlachopoulos C. Arterial stiffness mapping: a better navigation to Ithaca? J Am Coll Cardiol 2014;63:1748–50. [DOI] [PubMed] [Google Scholar]
- [21].Jadhav UM, Kadam NN. Non-invasive assessment of arterial stiffness by pulse-wave velocity correlates with endothelial dysfunction. Indian Heart J 2005;57:226–32. [PubMed] [Google Scholar]
- [22].Vriz O, Caterina C, Salvatore LA, et al. Comparison of sequentially measured Aloka echo-tracking one-point pulse wave velocity with SphygmoCor carotid-femoral pulse wave velocity. SAGE Open Med 2013;1: 2050312113507563. [DOI] [PMC free article] [PubMed] [Google Scholar]
- [23].Covic A, Siriopol D. Pulse wave velocity ratio: the new “gold standard” for measuring arterial stiffness. Hypertension 2015;65:289–90. [DOI] [PubMed] [Google Scholar]
- [24].Tsai WC, Huang YY, Lin CC, et al. Uric acid is an independent predictor of arterial stiffness in hypertensive patients. Heart Vessels 2009;24:371–5. [DOI] [PubMed] [Google Scholar]
- [25].Ishizaka N, Ishizaka Y, Toda Y, et al. Higher serum uric acid is associated with increased arterial stiffness in Japanese individuals. Atherosclerosis 2007;192:131–7. [DOI] [PubMed] [Google Scholar]
- [26].Lim JH, Kim Y-K, Kim Y-S, et al. Relationship between serum uric Acid levels, metabolic syndrome, and arterial stiffness in Korean. Korean Circ J 2010;40:314–20. [DOI] [PMC free article] [PubMed] [Google Scholar]
- [27].Lin Y, Lai X, Chen G, et al. Association among serum uric acid, cardiovascular risk, and arterial stiffness: a cross-sectional study in She ethnic minority group of Fujian Province in China. J Endocrinol Invest 2012;35:290–7. [DOI] [PubMed] [Google Scholar]
- [28].Millasseau SC, Stewart AD, Patel SJ, et al. Evaluation of carotid-femoral pulse wave velocity: influence of timing algorithm and heart rate. Hypertension 2005;45:222–6. [DOI] [PubMed] [Google Scholar]
- [29].Corry DB, Eslami P, Yamakoto K, et al. Uric acid stimulates vascular smooth muscle cell proliferation and oxidative stress via the vascular renin-angiotensin system. J Hypertens 2008;26:269–75. [DOI] [PubMed] [Google Scholar]
- [30].Kotliar C, Kempny Y, Gonzalez S, et al. Lack of RAAS inhibition by high-salt intake is associated with arterial stiffness in hypertensive patients. J Renin Angiotensin Aldosterone Syst 2014;15:498–504. [DOI] [PubMed] [Google Scholar]
- [31].Madlala HP, Maarman GJ, Ojuka E. Uric acid and transforming growth factor in fructose-induced production of reactive oxygen species in skeletal muscle. Nutr Rev 2016;74:259–66. [DOI] [PMC free article] [PubMed] [Google Scholar]
- [32].Kruger R, Mothae M, Smith W. Yia 03-07 reactive oxygen species adversely relates to early vascular changes and arterial stiffness in black normotensive smokers: the African-Predict Study. J Hypertens 2016;34(suppl 1):e205–6. [Google Scholar]
- [33].Kang DH, Park SK, Lee IK, et al. Uric acid-induced C-reactive protein expression: implication on cell proliferation and nitric oxide production of human vascular cells. J Am Soc Nephrol 2005;16:3553–62. [DOI] [PubMed] [Google Scholar]
- [34].Yang TY, Fang CY, Chen JS, et al. Association of serum uric acid with cardiovascular disease in Taiwanese patients with primary hypertension. Acta Cardiol Sin 2015;31:42–51. [DOI] [PMC free article] [PubMed] [Google Scholar]
Associated Data
This section collects any data citations, data availability statements, or supplementary materials included in this article.


