

Supplemental Digital Content is available in the text
Keywords: healthy lifestyle, impaired glucose tolerance, metabolic syndrome, predictive index, psychosocial health
Abstract
Type 2 diabetes mellitus (DM) is known to be closely associated with lifestyle and obesity and has a prevalence that increases with age. This study aimed to assess the short-term composite effect of diet, physical activity, psychosocial health, and waist circumference (WC) on the incidence of DM in the elderly and to provide a lifestyle-based predictive index.
We used baseline measurements (2009–2013) of 5349 community-dwelling participants (aged 55 years and older, 52% female) of the Healthy Aging Longitudinal Study in Taiwan (HALST) for fasting plasma glucose, HbA1C, serum cholesterol, triglycerides, blood pressures, WC, and outcomes of home-visit questionnaire. Principal component analysis (PCA) was used to identify participants with a healthy lifestyle (HLF: higher diet, physical activity, and psychosocial scores) and a lower WC, with cutoffs determined by the receiver-operating characteristics. A Cox regression model was applied to 3424 participants without DM at baseline by linking to their National Health Insurance records (median follow-up of 3.1 years).
In total, 247 new DM cases (7.2%) were identified. The HLF and lower WC group had a relative risk (RR) of DM of 0.54 (95% CI 0.35–0.82) compared to the non-HLF and higher WC group. When stratified by the presence of impaired glucose tolerance (IGT) or metabolic syndrome (MS), only participants with IGT/MS showed significant risks (RR 0.55; 95% CI 0.33–0.92). However, except for WC, the individual lifestyle factors were nonsignificant in the overall model without PCA.
A composite protective effect of HLF and normal WC on DM within 5 years was observed, especially in those with IGT or MS. Psychosocial health constituted an important lifestyle factor in the elderly. The cutoffs identified could be used as a lifestyle-based risk index for DM. Maintaining an HLF to prevent DM is especially important for the elderly.
1. Introduction
A lack of exercise, an unhealthy diet, and obesity are closely associated with type 2 diabetes mellitus (DM), which is also considered a lifestyle disease.[1–5] Aging is associated with an increase in insulin resistance and postprandial hyperglycemia, which are prominent characteristics of DM in the elderly.[6–8] It has also been shown that elderly men who are physically inactive or obese or who consume a high-carbohydrate diet are associated with a higher risk of metabolic syndrome (MS).[9] Globally, it is estimated that 3.8 million people will die of DM and its complications each year, and with the increase in the age of the population and the rates of overweight and obese people worldwide, the prevalence of DM is expected to increase by 39% between 2000 and 2030, up to 366 million.[10–12] Currently, the prevalence of DM in the general population in Taiwan has increased from 5.8% in 2000 to 12.4% in 2014.[13] The proportion of the population aged 65 years and older was approximately 12% in 2014 and is projected to reach 41% in 2061, a rapid increase that is following a global trend.[14] The effects of modifiable lifestyle factors on DM with aging have thus become an important issue for preventive medicine and related health policies.
Many epidemiological studies and randomized clinical trials have suggested that lifestyle interventions, such as diet and exercise, have beneficial effects, especially in high-risk patients with impaired glucose tolerance (IGT).[4,5,10,15] A community-based study reported that a lifestyle intervention reduced weight and improved diet and physical activity at 12 months among 50- to 65-year-old participants at high risk of developing DM.[16] However, home-based physical activity counseling may be insufficient to improve glycemic indicators in older adults with IGT.[17] Although depression and poor structural social support have been shown to be associated with an increased risk of DM,[18–20] psychosocial behaviors are seldom considered as a modifiable lifestyle factor.
In this study, we investigated the cross-sectional and longitudinal associations between healthy lifestyle (HLF) and DM among middle-aged and elderly participants in the Healthy Aging Longitudinal Study in Taiwan (HALST). Psychosocial health, physical activity, diet, smoking, alcohol consumption, and waist circumference (WC) were considered to be lifestyle factors.
2. Methods
2.1. Participants
The HALST was designed as a multisite longitudinal cohort study, with assessments including home interviews and hospital-based clinical examinations every 5 years. In addition, a telephone inquiry about new cardiovascular and frailty-related events was conducted annually after recruitment. Seven townships, representing the spectrum of sociodemographic characteristics in Taiwan, were chosen, including 2 in the north (Taipei, Yangmei), 2 in the center (Miaoli, Changhua), 2 in the south (Chiayi, Kaohsiung), and 1 in the east (Hualien). All eligible residents were identified from the household registry archives and recruited through a systematic sampling method. Older adults were over-sampled (≥65 years: 55–64 years = 70%: 30%) to ensure a sufficient number of the elderly, whereas gender and educational level were sampled based on the demographic distribution of the site. Approximately 700 residents aged 55 years and over who were living within a 2-km radius of a local hospital in each township participated in the study, for a total number of participants close to the targeted sample size of 5000. Individuals with any of the following conditions were excluded: highly contagious infectious diseases including scabies and open tuberculosis; severe illnesses including currently treated cancer; physician-diagnosed dementia; state of being bedridden and/or too frail to stand and walk; severe mental disorder or cognitive impairment; mental retardation or severe hearing loss; hospitalization; or institutionalization.[21]
Between January 2009 and March 2013, a total of 5349 participants (2551 men and 2798 women) from the HALST study were analyzed for DM status and cross-sectional association with an HLF. For longitudinal analyses, 3424 participants who did not have DM at baseline were linked to their personal National Health Insurance (NHI) records until the end of 2013 to monitor for DM-related events: 4890 agreed to be linked, 11 had missing NHI records, and 1454 had DM at baseline. The median follow-up period was 3.1 years (minimum 3 days, maximum 4.9 years). Participants were defined as a DM case if their fasting glucose level was ≥126 mg/dL, their HbA1c ≥6.5% was 47.5 mmol/mol, they were diagnosed with DM by a medical doctor, or they were receiving treatment for an elevated glucose level. Participants were defined as having IGT if their fasting glucose level was between 100 and 125 mg/dL, and they were considered a case of MS case if they met the clinical guidelines of the National Cholesterol Education Program Adult treatment Panel III (NCEP ATP III, modified for Asian populations).[22] New cases of DM were determined by one of the following criteria: hospitalization for diabetes-related illness (ICD-9-CM 250.xx) or prescription of antidiabetic drugs during follow-up; at least 1 prescription of oral antidiabetic agents and 1 ambulatory visit for diabetes-related illness within 1 year (ICD-9-CM 250.xx or A181, an abridged diabetes code used by physicians in Taiwan prior to 2000 for ambulatory visits); or at least 3 ambulatory visits for diabetes-related illness within 1 year.[23] The study was approved by the Research Ethics Committee of the National Health Research Institutes of Taiwan.
2.2. Measurements
During the home visits, a questionnaire was administered to establish the participant's age, gender, physical health status, medical history, occupation, income, and lifestyle factors, including smoking history, alcohol consumption, physical activity, diet, social network, cognition, and mental and psychological health. Participants who had smoked fewer than 5 packs of cigarettes in their lifetime were classified as nonsmokers. Women who consumed between 0 and 15 g of alcohol daily and men who consumed between 0 and 30 g of alcohol daily were defined as nonalcohol drinkers. A physical examination, including measurements of height, weight, WC/hip circumference (WC/HC), and seated blood pressure, was performed by centrally trained staff at the designated hospital following the home visit. The total cholesterol (CHOL), high/low-density lipoprotein cholesterol (HDL-C/LDL-C), uric acid, glucose, and triglycerides levels were determined from fasting blood samples.
2.3. Diet, physical activity, and psychosocial health
The Dietary Approaches to Stop Hypertension (DASH) score was calculated for each participant's diet based on a food frequency questionnaire. DASH scores range from 8 to 40 and favor a high average intake of fruits, vegetables, nuts and legumes, low-fat dairy products, and whole grains, with a low intake of sodium, sweetened beverages, and red and processed meats.[24]
Participants were asked about specific exercises and laborious work during the previous year. For each self-reported item, the frequency per month, week, or day; duration in minutes and hours; and months performing the physical activity were recorded, including the effect on breathing (not affected, accelerated a bit, wheezy, or hardly able to breathe) and sweating (none, a little, or a lot). The recorded activities were converted to metabolic equivalent task (MET)-minutes. For each participant, the mean total energy consumption in kcals per week was calculated as the sum of the MET score (1 MET is equivalent to an energy consumption of 1.2 kcal per minute for an adult weighing 70 kg) of the specific physical activity multiplied by the frequency and duration in the past 2 weeks and body weight on average.[25–28] Participants were defined as having a disability if they did not complete the 6-minute walk test and did not respond to the questionnaires on exercise and laborious work.
A psychosocial health score (maximum 99 points) was created based on the sum of the score of the questionnaire items on social networks (maximum 39 points) and the score for psychological health status (maximum 60 points). Participants were evaluated on their interactions with neighbors, friendliness with neighbors, involvement in community activities, and time spent with family members, relatives, and close friends, with 1 to 5 points awarded for the 1st 3 items and 1 to 8 points for the next 3 items. Psychological health status was determined from the psychological stress score, which was the total score of the 20 item Center for Epidemiologic Studies Depression Scale questionnaire.[29]
2.4. Statistical analysis
The differences between the DM and non-DM participants at baseline were examined using chi-square test (for categorical variables) or t test (for continuous variables). To assess the possible heterogeneity by age, stratified analyses were performed separately for participants aged 55 to 64, 65 to 74, and 75 years and older (75+). For cross-sectional associations between HLF and IGT and between HLF and DM at baseline, a generalized liner mixed model was applied with study sites as the random effects to assess for possible heterogeneous effects by site. Possible confounding variables, including gender, age group, education, and income, were adjusted for in the model. Additional cardiovascular risk factors, such as systolic blood pressure (SBP), CHOL, and medications for SBP and CHOL, were adjusted for in a separate analysis to control for these possible intermediate cardiovascular risk factors.
To assess the composite effect of the combined lifestyle factors of diet score, physical activity, psychosocial score, and WC, a principal component analysis (PCA) was applied to the baseline measurements of 4879 participants and their linked NHI records for dimension reduction. The loadings of the 1st factor (F1) mainly consisted of diet, physical activity (log-transformed), and psychosocial score, whereas the loadings of the 2nd factor (F2) were exclusively WC for each of the age and gender subgroups (see Table S1, Supplementary Content), accounting for approximately 34% and 25% of the total variations, respectively. Therefore, participants with higher factor loadings on F1 and lower loadings on F2 (group 0) were presumed to be at a lower risk of DM compared with participants at a higher risk with lower F1 and higher F2 loadings (group 1). The cutoffs for F1 and F2 were determined by the maximum sum of the sensitivity and specificity of DM at baseline using the receiver-operating characteristic (see Table S1, Supplementary Content). Separate cutoffs for the factors stratified by age and gender were determined in the same manner. A Cox regression model for time to new DM cases was applied to the 3425 participants who did not have DM at baseline. In addition, for the 1737 participants who were either in the low-risk group (group 0, n = 1444) or high-risk group (group 1, n = 293), a Cox regression model was applied to compare group differences. Participants with IGT or MS and those without IGT and MS at baseline were further analyzed separately. The analyses were performed using SAS software version 9.3 (SAS Institute Inc., Cary, NC).
3. Results
3.1. Baseline characteristics
The baseline characteristics of the study population stratified by DM status and age groups are listed in Table 1. The prevalence of DM increased with age, such that 23% of the 55- to 64-year-old age group and 32% of the 75+ group were considered DM cases, which is similar to the figures for the elderly U.S. population.[6] Although individuals with DM had a higher body mass index (BMI) and WC than individuals without DM, they were, on average, not obese (the overall mean BMI for the DM participants was 25.6 kg/m2). There was a significant difference in DM prevalence by gender and site in the 55 to 64 age group, but not in the 65 to 75 or 75+ age groups. Women had a lower mean WC than men in the 55 to 64 age group, but not in the older age groups. DM participants tended to have slightly higher SBP measurements, whereas their association with diastolic blood pressure measurements was reversed. For all age groups, the CHOL, LDL-C, and HDL-C levels for individuals without DM were higher than those of individuals with DM. As expected, the CHOL to HDL-C ratio (CHOL/HDL-C) and triglyceride levels were significantly higher for participants with DM in all age groups. Non-DM participants had significantly higher physical activity, diet, and psychosocial scores compared to DM participants in the 75+ age groups, while the associations of diet and psychosocial scores were significant only in the 55 to 64 and 65 to 74 age groups, respectively. Noticeably, the DM participants had even higher mean physical activity scores than the non-DM participants in the 55 to 64 age group (Table 1).
Table 1.
Baseline characteristics of the HALST participants stratified by age group and type 2 diabetes mellitus status.
3.2. Cross-sectional associations
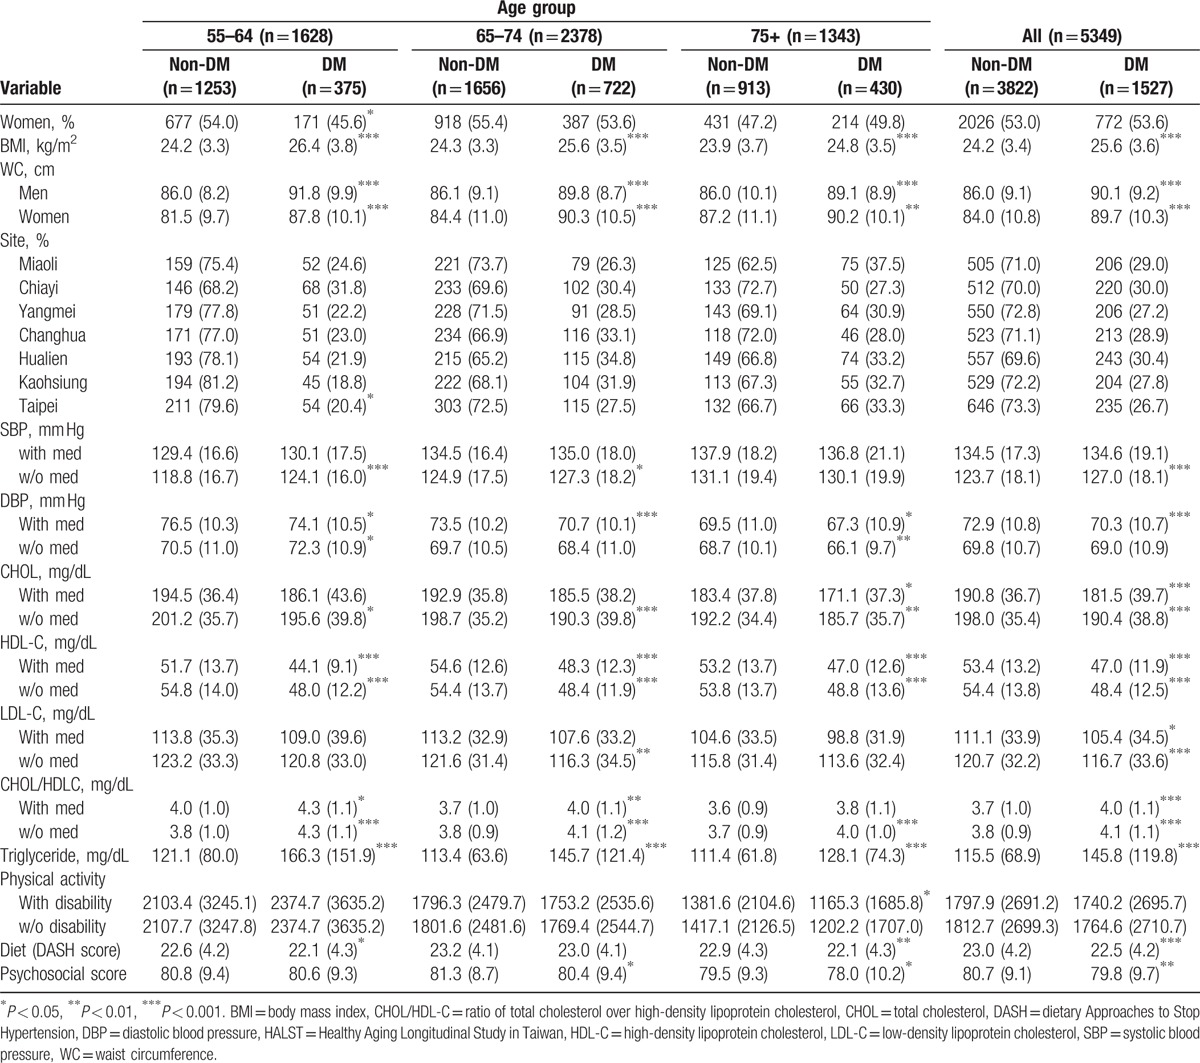
We grouped participants with physical activity, diet, and psychosocial scores in the top 30%, 40%, and 40%, respectively, based on the receiver-operating characteristic curve, as having a corresponding HLF factor. Figure 1 shows the DM prevalence in each of the 3 age groups for participants with different HLF numbers (together with normal WC, no smoking, and no alcohol/betel nut consumption). The prevalence of DM decreased consistently with the number of HLFs for all age groups with a significant trend (P < 0.001) (Fig. 1).
Figure 1.
Diabetes mellitus (DM) prevalence according to the number of healthy lifestyle factors fulfilled for the 55 to 64 (blue), 65 to 74 (red), and 75+ (yellow) age groups. (n = 5349).
To assess the associations between lifestyle factors and progressive DM status (normal, IGT, and DM), we estimated the odds ratio (OR) and corresponding 95% confidence interval of the non-DM (including normal participants with fasting glucose level < 100 mg/dL and IGT participants) versus DM, IGT versus DM, and non-DM versus IGT participants for each of the lifestyle factors. The results are summarized in Table S2 (see Supplementary Content). In general, each of the HLFs had a protective effect with an OR less than one for the non-DM versus DM and IGT versus DM participants, with the exception of psychosocial health in the 55 to 64 age group. Normal WC had an especially significant negative association with DM status. Notably, a healthy diet was highly protective for participants who were 75 years of age and older. However, there were no significant differences between normal versus IGT participants, with most ORs greater than one, except for a significant association for WC.
3.3. Healthy lifestyle and normal WC on the incidence of DM
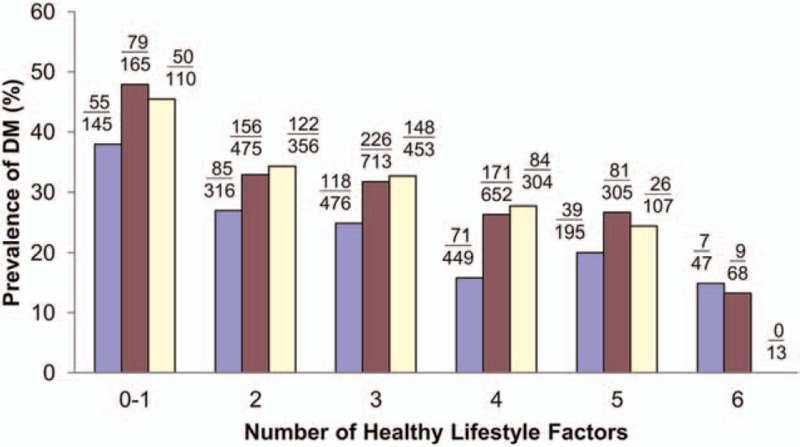
After a median follow-up of 3.1 years, the linked NHI records showed that of the 3425 participants without DM at baseline, 247 had developed into DM cases. At baseline, 1973 participants had IGT or MS and 174 of them developed DM (in contrast with 73 new DM cases out of 1452 participants without IGT/MS at baseline). Figure 2 shows the proportions of new DM cases in each of the 4 quadrants formed by the weighted cutoffs of F1 and F2 for the 55 to 64, 65 to 74, and 75+ years age groups. The proportions of DM cases in the upper left quadrant (low risk group 0) were clearly smaller than those of the lower right quadrant (high risk group 1), especially for the 75+ age group. The proportions of new DM cases among participants with higher F1 and F2 (upper right quadrant) and lower F1 and F2 (lower left quadrant) were greater than those of group 0 but smaller than those of group 1. However, the differences varied by age group (Fig. 2).
Figure 2.
Proportion of diabetes mellitus (DM) incidence in different quadrants formed by the weighted cutoffs for factors F1 and F2: high F1 and low F2 (A); high F1 and high F2 (B); low F1 and low F2 (C); and low F1 and high F2 (D). O, 55 to 64 age group; ⊕, 65 to 74 age group; and •, 75+ age group. (n = 3424).
Table 2 summarizes the results of the Cox regression model applied to the 3425 participants without baseline DM to determine the survival time to DM of different lifestyle factors. Only WC was highly significant (P < 0.001) when considered together with diet, physical activity, and psychosocial score in the model without PCA (1st 2 columns). However, when diet, physical activity, and psychosocial score were combined as F1, all 3 models with different cutoff points (models 1, 2, and 3 adopted a cutoff without stratification, a separate cutoff for each age and gender subgroup, and a cutoff weighted by the proportion of subjects in each age and gender subgroup, respectively) showed that the low-risk group 0 had a significantly lower relative risk (RR) of DM than the high-risk group 1 (RRs ranging from 0.50 to 0.63). The results of the models with and without adjusting for SBP, CHOL, and medications for SBP and CHOL were similar. For all the fitted models, there were no significant effects of gender, smoking, or alcohol consumption. The younger age groups, that is, 55 to 64 and 65 to 74, had a smaller RR than the 75+ age group, as expected (Table 2).
Table 2.
Relative risk of healthy lifestyle factors and WC on DM incidence.
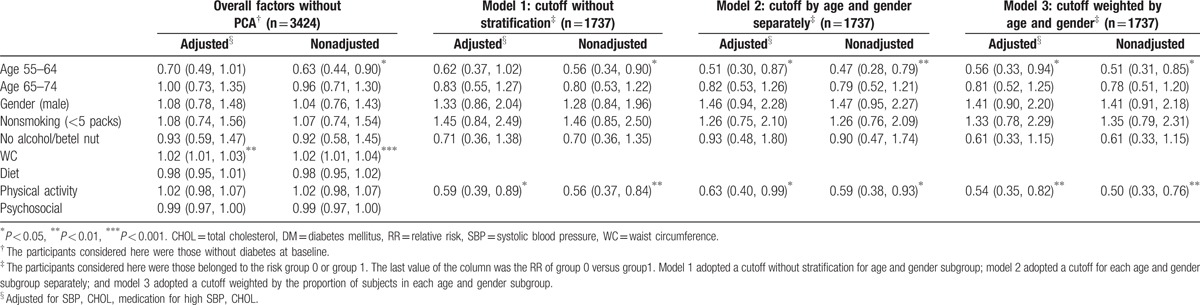
A further stratified analysis was separately performed for participants with and without IGT/MS at baseline. During the follow-up, the proportions of DM cases in each quadrant were similar to those shown in Fig. 2 for the overall participants (see Fig. S1, Supplementary Content). However, none of the HLF factors had a significant RR < 1 for the overall model without PCA. For participants with IGT/DM at baseline, significantly lower RRs of DM were found in all 3 models with different F1 and F2 cutoff selections for those who adopted an HLF and those with a lower WC (group 0). In contrast, the RRs of all 3 models showed no significant effects between groups 0 and 1 for non-IGT/MS participants (see Table S3, Supplementary Content, which lists the RRs for participants with and without IGT/MS at baseline).
4. Discussion
The primary findings of the current study were that middle-aged and elderly participants with a combined lifestyle of moderate-to-rigorous physical activity, a healthy diet, and healthy psychosocial functioning, together with normal WC had a lower RR of DM (0.50–0.63) within a relatively short 3- to 5-year follow-up period compared with participants without these factors (Table 2). This association was particularly evident among those who had IGT or MS at baseline. However, physical activity, diet, and psychosocial score did not have a significant RR when analyzed separately without PCA. PCA of the multivariate lifestyle factors and WC showed that physical activity, diet, and psychosocial score formed the primary factor and that WC was the single secondary principal factor. The cutoffs for factors F1 and F2 could serve as short-term risk predictors of DM for the elderly based on lifestyles and WC. The cross-sectional results suggested that physical activity, healthy diet, and psychosocial scores had an overall positive association with nondevelopment of DM (Table 1). Although not significant, not smoking, and not consuming alcohol/betel nut had a modifiable effect together with other HLF factors, as shown by the decreasing trend of DM prevalence with the corresponding number of HLFs (Fig. 1).
Consistent with the strong link between DM and obesity,[30] WC had the most significant association with DM status across all age groups of the HLFs included in this study (Tables 1 and 2). Consequently, even within a short follow-up of 5 years, abdominal obesity had a strong effect on the incidence of DM, in contrast with other lifestyle factors that may need a longer time to have individual significant effects. The strong association of WC with DM was also reflected in the PCA results, which showed that WC constituted a single secondary component, whereas diet, physical activity, and psychosocial health formed a composite effect as the primary component.
Biologically, the abdominal-perivisceral region is a site of preferential fat accumulation. Due to an excess of glucocorticoid activity, more free fatty acids (FFA) are released and circulated. Additionally, hypertrophic adipocytes begin to secrete low levels of TNF-α, which induces insulin resistance together with FFA.[31] Alternatively, obesity leads to an increased expression of proinflammatory adipokines and a diminished expression of antiinflammatory adipokines, resulting in the development of a chronic, low-grade inflammatory state.[32] Additionally, visceral fat accumulation is associated with impaired insulin sensitivity through dysregulated production of adipocytokines, which is the pathophysiological mechanism responsible for DM.[33] However, the mean BMI was only 25.5 among the study participants with DM. Furthermore, 48.2% of the participants with DM had a normal BMI (<25 kg/m2) and 33.4% had a normal WC.[34] Other therapeutic targets to reduce the risk of DM, in addition to weight loss, may need to be explored further among this study population.
Diet and exercise for weight loss are the key lifestyle interventions for DM patients and have been shown to consistently reduce the incidence of DM in interventional clinical trials and epidemiological studies.[11,15,35] In addition to weight control, the adoption of diets with a higher intake of plant-based foods and lower intake of red meat, sweets, high-fat dairy, and refined grains or a Mediterranean dietary pattern rich in olive oil, fruits, and vegetables has been found to be the best strategy for decreasing the risk of DM.[15] As individuals age, there are increased nutritional needs with fewer energy requirements, which makes malnutrition a major problem for the elderly.[36,37]
The study results showed that DM participants had consistently lower DASH scores than their counterparts without DM, especially in the 75+ age group (Table 1 and Table S2, Supplementary Content). In this study, we adopted the DASH score to assess the association between dietary intake and incidence of type 2 DM rather than alternative diet scores such as the Healthy Eating Index (HEI) and Alternate HEI (AHEI). The rationale for this decision was that: it is relatively easy to quantify DASH scores without calculating fatty acids or trans fat, which would inevitably increase the amount of uncertainty; the DASH score has been shown to have consistent results with other diet scores (eg, the HEI, AHEI) in assessing associations with the incidence of DM;[38–41] and the DASH score has been used as the main dietary score to assess DM incidence in the literature.[42] Therefore, the use of the DASH diet score in the current study should be well justified.
Exercise can limit the accumulation of adipose tissue and improve the blood lipid profile, and it also creates an antiinflammatory effect by releasing relative mediators.[43] However, exercises, such as resistance training, require intensive training and supervision, which is not feasible via home-based telephone counseling in older, overweight patients with IGT.[17] The study findings showed that while the association between higher physical activity and lower DM prevalence remained true in the 65 to 74 age group, especially for participants over 75 years old, the association was reversed in the 55 to 64 age group. As 5 of the 7 study sites were rural with relatively higher percentages of laborers, it is likely that the DM participants in the 55 to 64 age group were still involved in more laborious work, were of lower socioeconomic status and met fewer criteria for other HLFs. This assumption is supported by the fact that for the 55 to 64 age group, 55% of the DM patients reported involvement in labor work, in contrast with 44% of those who did not have DM (the relative percentages in the 65–74 and 75+ age groups were 47% vs 54% and 48% vs 44%, respectively). Furthermore, we compared the non-DM and physically inactive (<top 40%) participants with the DM and physical active participants (>=top 40%) regarding whether they met other HLF criteria (met >=3 other HLF). The relative percentages were 69% versus 57%, respectively (chi-square test P-value = 0.01). However, the relative percentages in the 65 to 74 and 75+ age groups were not significantly different (72% vs 72% and 68% vs 72%, respectively).
In addition to the common HLFs for preventing cardio-metabolic disease,[2,5,17,44,45] we included psychosocial health and other modifiable lifestyle factors of DM. Previous studies showed that stress contributed to the incidence of DM.[18,46] In a 21-year prospective study in Australian women, persistent depressive symptoms were associated with an increased risk of DM.[19] A study in the U.S. also reported that the psychological aspects of social determinants were associated with glycemic control in adults with DM.[47] Our study showed that with the exception of the 55 to 64 age group, participants with DM had a significantly lower psychosocial scores than participants without DM, which was consistent with previous findings. It is worth noting that the level of significance increased with age (Table 1), which indicated that psychosocial health plays an important role among HLFs in an aging population. This fact was further supported by the PCA results, which showed that psychosocial health, together with physical activity and diet, constituted a primary factor in predicting DM in the longitudinal study (Table 2).
Consistent with the cross-sectional results of marginal and nonsignificant associations, the longitudinal effects of physical activity, diet, and psychosocial scores were nonsignificant when analyzed separately in the Cox regression model. This result could misrepresent the importance of the composite effect of HLF in the elderly. Our results showed that when physical activity, diet, and psychosocial scores were aggregated using PCA, together with normal WC, the low-risk group had an RR of 0.50 to 0.63 compared with the high-risk group, which indicates the clinically important role of HLF in preventing DM, especially for IGT or MS patients. In addition to the cardiovascular risk factors of SBP and cholesterol, the cutoffs of F1 and F2 can be used as predictors of the risk of DM based on lifestyle. The risk score identified is similar to those of other studies,[48,49] but is more specific to the elderly and is exclusively based on lifestyle and WC (see Supplementary Content for numerical examples). In contrast with the long follow-up period used in other studies,[49,50] the current study showed that maintaining an HLF and normal WC had a significantly protective effect for DM within 5 years in the elderly.
Because there are currently few large aging studies conducted in Asia, the close link between the HALST study and the Chicago Healthy Aging Study[51] may provide a good opportunity to compare the results of a Chinese population with the results of a Caucasian population. The participants were from 7 sites, including both rural and urban areas across northern, central, southern, and eastern Taiwan, covering the general elderly population across the island. The linked NHI dataset covered over 95% of the entire study population, which enabled us to trace the participants’ incidence of DM to the nearest time of onset and to exclude the misclassified cases at baseline, as this could potentially bias the study outcomes.
There were some limitations to this study. First, the study participants were recruited according to their residential areas rather than by random sampling. The exclusion criteria might also have generated some bias in the representativeness of the participants regarding the general elderly population in Taiwan. Second, physical activity was not validated with an objective measure such as heart rate monitoring. The participants’ estimated physical activity scores also ranged widely and were highly skewed. Habitual physical activity measured by questionnaires is known to have the limited reliability and validity.[52] The physical activity questionnaire used in the HALST follows that of the National Health Interview Survey (NHIS), a nationwide survey conducted every 4 years in Taiwan.[53] The METs calculation of various physical activities at different levels adopted by the NHIS, including duration, strength, and frequency, have been validated by expert judgment and actual measurements of the corresponding energy consumptions, as reported by Wen et al.[27,54] Therefore, the validity of the questionnaire in the current study should be well justified. Furthermore, the interviews were conducted face-to-face with the participants during home visits and were collected by well-trained staff, who have maintained long-term relationships with the participants for follow-up studies. The double-check procedure used while entering the questionnaire outcomes for quality control also ensured the reliability of the data. The log-transformed physical activity scores should, however, be able to partially remedy the wide and highly skewed problem. We also reconducted the statistical analyses replacing the physical activity scores with their equivalent deciles. The results were essentially the same (data not shown). Third, there might have been some new patients with DM who were unidentified and accordingly unaware of their disease status and thus did not have corresponding NHI records.
In conclusion, while higher physical activity, a healthy diet, and psychosocial health had nonsignificant or marginal associations with DM individually, the composite of these HLF factors had a clear protective effect among the middle-aged and elderly participants. Maintaining an HLF and a normal WC to postpone the incidence of DM is especially important for the elderly, and the effects can be observed within a short follow-up period, possibly due to the aging process. Psychosocial health constitutes an HLF factor that is important to preventing DM. Together with a lower WC, the cutoffs identified in this study may be used as lifestyle-based risk indices to adjust for these modifiable lifestyle behaviors.
Supplementary Material
Acknowledgments
The authors thank National Health Research Institutes in Taiwan (Project Nos. BS-097-SP-04, PH-098-SP-02, PH-099-SP-01, PH-100-SP-01, PH-101-SP-01, PH-102-SP-01, PH-103-SP-01, PH-104-SP-01, and PH-105-SP-01) for the support.
Footnotes
Abbreviations: CHOL = total cholesterol, DASH = Dietary Approaches to Stop Hypertension, DM = diabetes mellitus, HALST = Healthy Aging Longitudinal Study, HDL-C = high-density lipoprotein cholesterol, HLF = healthy lifestyle, IGT = impaired glucose tolerance, MET = metabolic equivalent task, MS = metabolic syndrome, NHI = National Health Insurance, OR = odds ratio, PCA = principal component analysis, RR = relative risk, SBP = systolic blood pressure, WC = waist circumference.
Funding/support: This study was supported by the National Health Research Institutes in Taiwan (Project Nos. BS-097-SP-04, PH-098-SP-02, PH-099-SP-01, PH-100-SP-01, PH-101-SP-01, PH-102-SP-01, PH-103-SP-01, PH-104-SP-01, and PH-105-SP-01).
The authors have no conflicts of interest to disclose.
Supplemental Digital Content is available for this article.
References
- [1].Hu FB. Globalization of diabetes: the role of diet, lifestyle, and genes. Diabetes Care 2011;34:1249–57. [DOI] [PMC free article] [PubMed] [Google Scholar]
- [2].Esposito K, Giugliano D. Healthy lifestyle for metabolic health: no more excuse!. Endocrine 2014;46:176–8. [DOI] [PubMed] [Google Scholar]
- [3].Nylen ES, Kokkinos P, Myers J, et al. Prognostic effect of exercise capacity on mortality in older adults with diabetes mellitus. J Am Geriatr Soc 2010;58:1850–4. [DOI] [PubMed] [Google Scholar]
- [4].Gibbs BB, Gabriel KP, Reis JP, et al. Cross-sectional and longitudinal associations between objectively measured sedentary time and metabolic disease: The Coronary Artery Risk Development in Young Adults (CARDIA) Study. Diabetes Care 2015;38:1835–43. [DOI] [PMC free article] [PubMed] [Google Scholar]
- [5].Djoussé L, Driver JA, Gaziano JM, et al. Association between modifiable lifestyle factors and residual lifetime risk of diabetes. Nutr Metab Cardiovasc Dis 2013;23:17–22. [DOI] [PMC free article] [PubMed] [Google Scholar]
- [6].Kirkman MS, Briscoe VJ, Clark N, et al. Diabetes in older adults: a consensus report. J Am Geriatr Soc 2012;60:2342–56. [DOI] [PMC free article] [PubMed] [Google Scholar]
- [7].Szoke E, Meyer C, Shrayyef MZ, et al. Effect of aging on glucose homeostasis: accelerated deterioration of beta-cell function in individuals with impaired glucose tolerance. Diabetes Care 2008;31:539–43. [DOI] [PubMed] [Google Scholar]
- [8].De Tata V. Age-related impairment of pancreatic beta-cell function: pathophysiological and cellular mechanisms. Front Endocrinol 2014;5:138. [DOI] [PMC free article] [PubMed] [Google Scholar]
- [9].Wannamethee SG, Shaper AG, Whincup PH. Modifiable lifestyle factors and the metabolic syndrome in older men: effects of lifestyle changes. J Am Geriatr Soc 2006;54:1909–14. [DOI] [PubMed] [Google Scholar]
- [10].Yoon U, Kwok LL, Magkidis A. Efficacy of lifestyle interventions in reducing diabetes incidence in patients with impaired glucose tolerance: a systematic review o randomized controlled trials. Metabolism 2013;62:303–14. [DOI] [PubMed] [Google Scholar]
- [11].Asif M. The prevention and control the type-2 diabetes by changing lifestyle and dietary pattern. J Educ Health Prom 2014;3:1. [DOI] [PMC free article] [PubMed] [Google Scholar]
- [12].Wild S, Roglic G, Green A, et al. Global prevalence of diabetes: estimates for the year 2000 and projections for 2030. Diabetes Care 2004;27:1047–53. [DOI] [PubMed] [Google Scholar]
- [13].Health Promotion Administration, Ministry of Health and Welfare of Taiwan. Diabetes patients waist circumference and glucose control. Available at http://www.hpa.gov.tw/Bhpnet/Web/News/News.aspx?No=201510270001 [Accessed March 10, 2016]. [Google Scholar]
- [14].National Development Council, Republic of China. Projections of the population of Republic of China, 2014–2061. Available at http://www.ndc.gov.tw/m1.aspx?sNo=0000455#.VP6MqvmUe1c [Accessed March 1, 2016]. [Google Scholar]
- [15].Salas-Salvadó J, Martinez-González MÁ, Bulló M, et al. The role of diet in the prevention of type 2 diabetes. Nutr Metab Cardiovasc Dis 2011;21:B32–48. [DOI] [PubMed] [Google Scholar]
- [16].Vita P, Cardona-Morrell M, Bauman A, et al. (2015) Type 2 diabetes prevention in the community: 12-month outcomes from the Sydney Diabetes Prevention Program. Diabetes Res Clin Pract 2016;112:13–6. [DOI] [PubMed] [Google Scholar]
- [17].Morey MC, Pieper CF, Edelman DE, et al. Enhanced fitness: a randomized controlled trial of the effects of home-based physical activity counseling on glycemic control in older adults with prediabetes mellitus. J Am Geriatr Soc 2012;60:1655–62. [DOI] [PMC free article] [PubMed] [Google Scholar]
- [18].Vimalananda VG, Palmer JR, Gelovin H, et al. Depression symptoms, antidepressant use, and the incidence of diabetes in the Black Women's Health Study. Diabetes Care 2014;37:2211–7. [DOI] [PMC free article] [PubMed] [Google Scholar]
- [19].Hasan SS, Clavarino AM, Dingle K, et al. Psychological health and the risk of diabetes mellitus in Australian women: A 21-year prospective study. J Womens Health 2014;23:912–9. [DOI] [PubMed] [Google Scholar]
- [20].Altevers J, Lukascheck K, Baumert J, et al. Poor structural social support is associated with an increased risk of type 2 diabetes mellitus: findings from the MONICA/KORA Augsburg cohort study. Diabet Med 2016;33:47–54. [DOI] [PubMed] [Google Scholar]
- [21].Hsu CC, Chang HY, Wu IC, et al. Cohort profile: The Healthy Aging Longitudinal Study in Taiwan (HALST). Int J Epidemiol 2017;in press. [DOI] [PMC free article] [PubMed] [Google Scholar]
- [22].Heng D, Ma S, Lee JJM, et al. Modification of the NCEP ATP III definitions of the metabolic syndrome for use in Asians identifies individuals at risk of ischemic heart disease. Atherosclerosis 2006;186:367–73. [DOI] [PubMed] [Google Scholar]
- [23].Hsu CC, Shih SF, Lee CH, et al. Poverty increases type 2 diabetes incidence and inequality of care despite universal health coverage. Diabetes Care 2012;35:2286–92. [DOI] [PMC free article] [PubMed] [Google Scholar]
- [24].Forman JP, Stampfer MJ, Curhan GC. Diet and lifestyle risk factors associated with incident hypertension in women. JAMA 2009;302:401–11. [DOI] [PMC free article] [PubMed] [Google Scholar]
- [25].Chen YJ, Huang YH, Lu FH, et al. The correlates of leisure time physical activity among an adults population from southern Taiwan. BMC Public Health 2011;11:427. [DOI] [PMC free article] [PubMed] [Google Scholar]
- [26].Lin YP, Huang YH, Lu FH, et al. Non-leisure time physical activity is an independent predictor of longevity for a Taiwanese elderly population: an eight-year follow-up study. BMC Public Health 2011;11:428. [DOI] [PMC free article] [PubMed] [Google Scholar]
- [27].Wen CP, Wei PW, Chan WT, et al. Taiwanese citizens exercise policy based on analyses of energy consumption of exercise: comparisons of exercise habits, strength, and frequencies of Taiwanese and American citizens. Taiwan J Public Health 2007;5:386–97. (In Chinese, with English Abstract). [Google Scholar]
- [28].Ainsworth BE, Haskell WL, Herrmann SD, et al. Compendium of physical activities: a second update of codes and MET values. Med Sci Sports Exerc 2011;43:1575–81. [DOI] [PubMed] [Google Scholar]
- [29].Radloff LS. The CES-D scale: a self report depression scale for research in the general population. Appl Psychol Meas 1977;1:385–401. [Google Scholar]
- [30].Niswender K. Diabetes and obesity: therapeutic targeting and risk reduction – a complex interplay. Diabetes Obes Metab 2010;12:267–87. [DOI] [PubMed] [Google Scholar]
- [31].Capurso C, Capurso A. From exess adiposity to insulin resistance: the role of free fatty acids. Vascul Pharmacol 2012;57:91–7. [DOI] [PubMed] [Google Scholar]
- [32].Nakamura K, Fuster JJ, Walsh K. Adipokines: a link between obesity and cardiovascular disease. J Cardiol 2014;63:250–9. [DOI] [PMC free article] [PubMed] [Google Scholar]
- [33].Kishida K, Funahashi T, Shimomura I. Molecular mechanisms of diabetes and atherosclerosis: role of adiponectin. Endocr Metab Immune Disord Drug Targets 2012;12:118–31. [DOI] [PubMed] [Google Scholar]
- [34].Kuo JF, Hsieh YT, Mao IC, et al. The association between body mass index and all-cause mortality in patients with type 2 diabetes mellitus. Medicine 2015;94:e1398. [DOI] [PMC free article] [PubMed] [Google Scholar]
- [35].Zhao G, Ford ES, Li C, et al. Physical activity in U.S. older adults with diabetes mellitus: prevalence and correlates of meeting physical activity recommendations. J Am Geriatr Soc 2011;59:132–7. [DOI] [PubMed] [Google Scholar]
- [36].Agarwal E, Miller M, Yaxley A, et al. Malnutrition in the elderly: a narrative review. Maturitas 2013;76:296–302. [DOI] [PubMed] [Google Scholar]
- [37].Stanga Z. Basics in clinical nutrition: nutrition in the elderly. e-SPEN. Eur J Clin Nutr Metab 2009;4:e289–99. [Google Scholar]
- [38].de Koning L, Willett WC, Chiuve SE, et al. Diet-Quality scores and the risk of type 2 diabetes in men. Diabetes Care 2011;34:1150–6. [DOI] [PMC free article] [PubMed] [Google Scholar]
- [39].Schwingshackl L, Hoffmann G. Diet quality as assessed by the Healthy Eating Index, the Alternate Healthy Eating Index, the Dietary Approaches to Stop Hypertension Score, and health outcomes: a systematic review and meta-analysis of cohort studies. J Acad Nutr Diet 2015;115:780–800. [DOI] [PubMed] [Google Scholar]
- [40].Jacobs S, Harmon BE, Boushey CJ, et al. A priori-defined diet quality indexes and risk of type 2 diabetes: The Multiethnic Cohort. Diabetologia 2015;58:98–112. [DOI] [PMC free article] [PubMed] [Google Scholar]
- [41].Cespedes EM, Hu FB, Tinker L, et al. Multiple healthful dietary patterns and type 2 diabetes in the Women's Health Initiative. Am J Epidemiol 2016;183:622–33. [DOI] [PMC free article] [PubMed] [Google Scholar]
- [42].Liese AD, D’Agostino RB, Nichols M, et al. Adherence to the DASH diet is inversely associated with incidence of type 2 diabetes: The Insulin Resistance Atherosclerosis Study. Diabetes Care 2009;32:1434–6. [DOI] [PMC free article] [PubMed] [Google Scholar]
- [43].Nimmo MA, Leggate M, Viana JL, et al. The effect of physical activity on mediators of inflammation. Diabetes Obes Metab 2013;15(Suppl 3):51–60. [DOI] [PubMed] [Google Scholar]
- [44].Chiuve SE, Fung TT, Rexrode KM, et al. Adherence to a low-risk, healthy lifestyle and risk of sudden cardiac death among women. JAMA 2011;306:62–9. [DOI] [PMC free article] [PubMed] [Google Scholar]
- [45].Stampfer MJ, Hu FB, Manson JE, et al. Primary prevention of coronary heart disease in women through diet and lifestyle. N Engl J Med 2000;343:16–22. [DOI] [PubMed] [Google Scholar]
- [46].Kelly SJ, Ismail M. Stress and type 2 diabetes: a review of how stress contributes to the development of type 2 diabetes. Ann Rev Public Health 2015;36:441–62. [DOI] [PubMed] [Google Scholar]
- [47].Walker RJ, Gebregziabher M, Martin-Harris B, et al. Relationship between social determinants of health and processes and outcomes in adults with type 2 diabetes: validation of a conceptual framework. BMC Endocr Disord 2014;14:82. [DOI] [PMC free article] [PubMed] [Google Scholar]
- [48].Salinero-Fort MA, de Burgos-Lunar C, Prieto JM, et al. Validating prediction scales of type 2 diabetes mellitus in Spain: the SPREDIA-2 population-based prospective cohort study protocol. BMJ Open 2015;5:e007195. [DOI] [PMC free article] [PubMed] [Google Scholar]
- [49].Chien K, Cai T, Hsu H, et al. A prediction model for type 2 diabetes risk among Chinese people. Diabetologia 2009;52:443–50. [DOI] [PubMed] [Google Scholar]
- [50].Lindstrom J, Peltonen M, Eriksson JG, et al. Improved lifestyle and decreased diabetes risk over 13 years: long-term follow-up of the randomized Finnish Diabetes Prevention Study (DPS). Diabetologia 2013;56:284–93. [DOI] [PubMed] [Google Scholar]
- [51].Vu THT, Liu K, Lloyd-Jones DM, et al. Favorable levels of all major cardiovascular risk factors at younger ages and high-sensitivity C-reactive protein 39 years later – The Chicago Healthy Aging Study. Prev Med Rep 2015;2:235–40. [DOI] [PMC free article] [PubMed] [Google Scholar]
- [52].Shephard RJ. Limits to the measurement of habitual physical activity by questionnaires. Br J Sports Med 2003;37:197–206. [DOI] [PMC free article] [PubMed] [Google Scholar]
- [53].Wang WS, Wahlqvist ML, Hsu CC, et al. Age and gender attribution of obesity-related metabolic disorders for six-year all-cause and cause-specific mortality in Taiwanese. BMC Public Health 2012;12:111. [DOI] [PMC free article] [PubMed] [Google Scholar]
- [54].Wen CP, Wai JPM, Tsai MK, et al. Minimum amount of physical activity for reduced mortality and extended life expectancy: a prospective cohort study. Lancet 2011;378:1244–53. [DOI] [PubMed] [Google Scholar]
Associated Data
This section collects any data citations, data availability statements, or supplementary materials included in this article.