Abstract
Claudin-2 is highly expressed in lung adenocarcinoma tissues and increases proliferation in adenocarcinoma cells. The chemicals that reduce claudin-2 expression may have anti-cancer effects, but such therapeutic medicines have not been developed. We found that azacitidine (AZA), a DNA methylation inhibitor, and trichostatin A (TSA) and sodium butyrate (NaB), histone deacetylase (HDAC) inhibitors, decrease claudin-2 levels. The effect of AZA was mediated by the inhibition of phosphorylated Akt and NF-κB. LY-294002, an inhibitor of phosphatidylinositol 3-kinase (PI3K), and BAY 11-7082, an NF-κB inhibitor, decreased claudin-2 levels. The reporter activity of claudin-2 was decreased by AZA and LY-294002, which was blocked by the mutation in a putative NF-κB-binding site. NF-κB bound to the promoter region of claudin-2, which was inhibited by AZA and LY-294002. AZA is suggested to decrease the claudin-2 mRNA level mediated by the inhibition of a PI3K/Akt/NF-κB pathway. TSA and NaB did not change phosphorylated Akt and NF-κB levels. Furthermore, these inhibitors did not change the reporter activity of claudin-2 but decreased the stability of claudin-2 mRNA mediated by the elevation of miR-497 microRNA. The binding of histone H3 to the promoter region of miR-497 was inhibited by TSA and NaB, whereas that of claudin-2 was not. These results suggest that HDAC inhibitors decrease claudin-2 levels mediated by the elevation of miR-497 expression. Cell proliferation was additively decreased by AZA, TSA, and NaB, which was partially rescued by ectopic expression of claudin-2. We suggest that epigenetic inhibitors suppress the abnormal proliferation of lung adenocarcinoma cells highly expressing claudin-2.
Keywords: epigenetics, lung cancer, NF-κB, proliferation, tight junction
Introduction
Epithelial cells form intercellular junction complexes such as tight junctions (TJs),2 adherence junctions, and desmosomes. Among them, TJs are located at the most apical region of the lateral membrane and play critical roles in the establishment and maintenance of cell proliferation, differentiation, polarity, and paracellular permeability (1–3). TJs consist of over 40 proteins, including transmembrane proteins, adaptor proteins, and signaling proteins (4, 5). Claudins are major components of TJs, with four transmembrane domains and molecular masses of 20–27 kDa (6, 7). Claudins constitute a family of over 20 members in mammals, and subtypes form homo- and heterotypic associations with each other (8, 9). Different combinations of claudin subtypes can confer different properties to epithelial cells in terms of physiological and pathophysiological functions.
Cancer cells have basic characteristics of unlimited proliferation, invasion, and metastasis. Claudin-2 expression in human lung adenocarcinoma tissues is higher than that in normal tissues (10). Similarly, the elevation of claudin-2 expression is reported in liver (11), colon (12), and stomach (13) cancer tissues. A549 cells derived from human lung adenocarcinoma showed claudin-2-dependent proliferation (14) and migration (15). Forced expression of claudin-2 in colon cancer cells increases tumor growth in mice (16). In addition, overexpression of claudin-2 in weakly aggressive breast cancer cells increases liver metastasis (17). Claudin-2 may be involved in the tumorigenesis and metastasis in these cancer tissues. However, a key signaling pathway and transcription factors that control claudin-2 expression have not been fully clarified in cancer tissues. We recently reported that the inhibition of mitogen-activated protein kinase kinase (MEK)/extracellular signal-regulated kinase (ERK)/c-Fos and phosphatidylinositol-3 kinase (PI3K)/Akt pathways decreases claudin-2 expression in A549 cells (18).
Epigenetics is defined as heritable change in gene expression that occurs without direct alteration of the DNA sequence. Aberrant epigenetic regulation and epigenetic patterns are reported in various cancer tissues (19–21). Different from genetic mutations, the epigenetic changes are reversible and modulated by pharmacologic agents (22). The hypermethylation of CpG islands in the promoter for tumor suppression genes leads to transcriptional repression resulting in unlimited proliferation and survival of cancer cells. Aberrant promoter methylation of multiple genes is detected in non-small cell lung cancers (NSCLC), including adenocarcinoma (23). DNA methyltransferase inhibitors such as azacitidine (AZA) and decitabine are approved by the Food and Drug Administration (FDA) for use in the treatment of myelodysplastic syndrome. Histone acetylation is another important factor in transcriptional modulation, and the status of acetylation is oppositely regulated by histone acetyltransferases (HATs) and histone deacetylases (HDACs). HDACs are overexpressed in solid human cancers, including lung cancer (24). HDAC inhibitors induce differentiation, growth arrest, and apoptosis in cancer cells (25, 26). Several HDAC inhibitors are approved by the FDA for use in the treatment of T-cell lymphoma. The application of epigenetic drugs may be expanded to treatment of patients with various cancer types. Epigenetic regulation of claudin-7, -11, and -1 expression has been reported in colon (27), stomach (28), and breast (29) cancer cells, respectively. There are, however, no reports showing that epigenetic inhibitors affect claudin-2 expression in lung cancer cells.
In this study, we found that the expression of claudin-2 is decreased by epigenetic inhibitors in human lung adenocarcinoma A549 cells. AZA decreased the phosphorylation levels of NF-κB and the binding of NF-κB to the promoter region of claudin-2 mediated by inhibition of phosphorylated Akt. Trichostatin A (TSA) and sodium butyrate (NaB), HDAC inhibitors, decreased the stability of claudin-2 mRNA mediated by the elevation of miR-497 miRNA without affecting the phosphorylation levels of Akt and NF-κB. Cell proliferation was additively suppressed by the epigenetic inhibitors, which was recovered by the ectopic expression of claudin-2. The epigenetic inhibitors may be useful to treat lung adenocarcinoma that highly expresses claudin-2.
Results
Effect of AZA on the Expression of Junctional Protein in A549 Cells
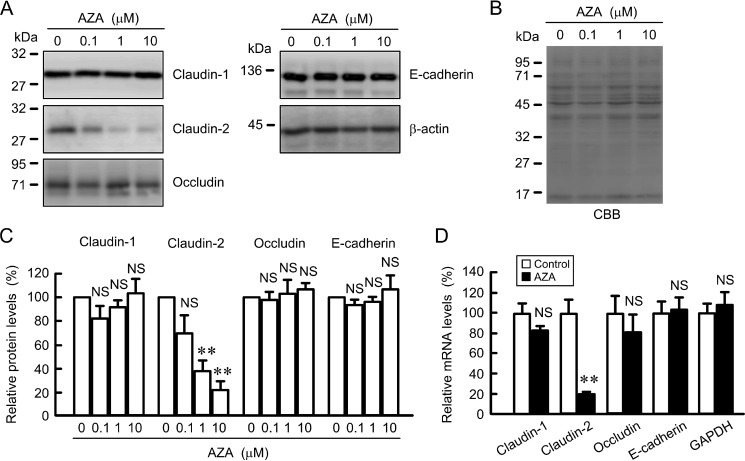
We examined the effect of AZA on the expression of junctional proteins in A549 cells. AZA decreased the protein levels of claudin-2 in a dose-dependent manner, whereas it did not change those of claudin-1, occludin, and E-cadherin (Fig. 1, A and C). Equal protein loading is verified by Coomassie Brilliant Blue G-250 (CBB) staining (Fig. 1B). The relative levels normalized by CBB staining were similar to that by β-actin (data not shown). Therefore, we used β-actin to normalize the expression levels of protein. The relative levels of glyceraldehyde-3-phosphate dehydrogenase (GAPDH) mRNA normalized by β-actin were not significantly different in control and AZA-treated cells (data not shown). Therefore, we used β-actin to normalize the expression levels of mRNA. AZA decreased the mRNA levels of claudin-2 without affecting those of claudin-1, occludin, and E-cadherin (Fig. 1D). These results are similar to those in immunoblotting. The down-regulation of claudin-2 expression is closely related to the regulation of cell proliferation and migration. Therefore, we examined what regulatory mechanism is involved in the decrease in claudin-2 by AZA.
FIGURE 1.
Effect of AZA on the expression of junctional proteins. A, A549 cells were treated with dimethyl sulfoxide (DMSO) vehicle (0 μm) or AZA for 24 h at the indicated concentration. Cell lysates were immunoblotted with anti-claudin-1, anti-claudin-2, anti-occludin, anti-E-cadherin, and anti-β-actin antibodies. B, PVDF membrane was stained with CBB after immunoblotting. C, expression levels of claudin-1, claudin-2, occludin, and E-cadherin are represented as percentage of the values in 0 μm. D, cells were treated with DMSO vehicle (control) or AZA for 6 h. After isolation of total RNA and reverse transcription, quantitative real time PCR was performed using primers for claudin-1, claudin-2, occludin, E-cadherin, and GAPDH. β-Actin served as an internal control. The expression levels of mRNA are represented as percentage of the values in the control cells. n = 3–4. **, p < 0.01 compared with control or 0 μm. NS, p > 0.05.
Effect of AZA on Reporter Activity and mRNA Stability of Claudin-2
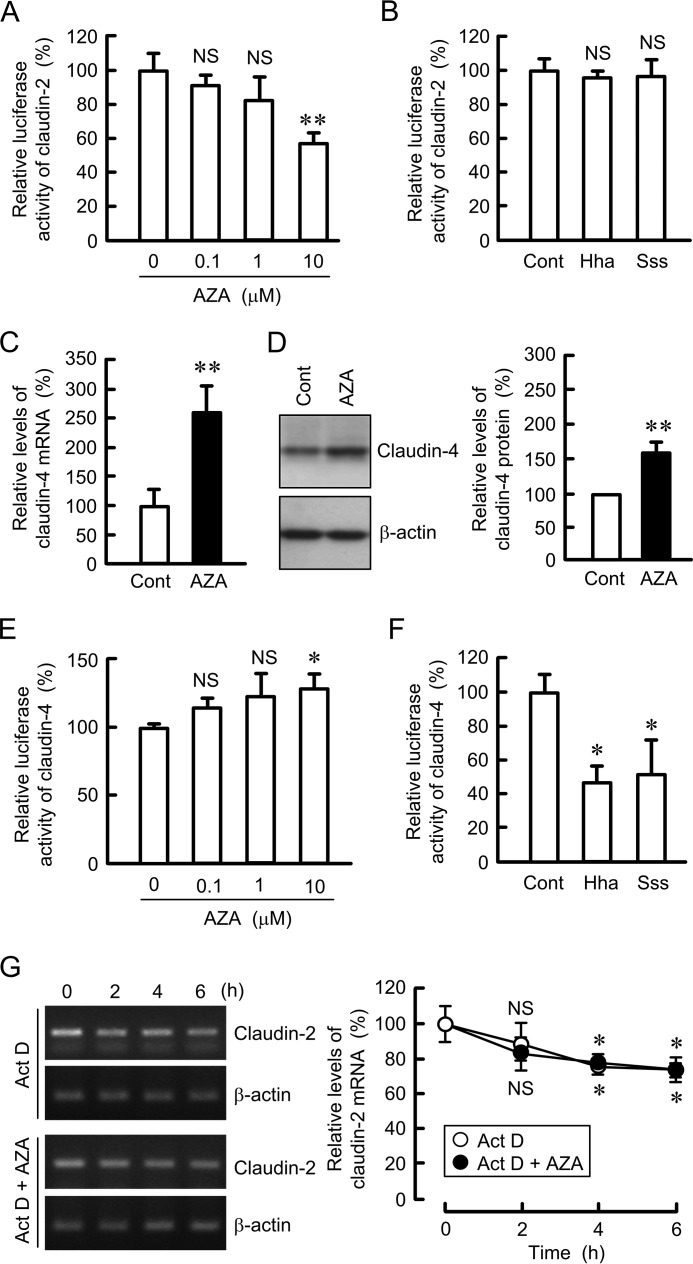
The expression level of mRNA is regulated by the transcriptional activity and mRNA stability. AZA decreased the reporter activity of claudin-2 in a dose-dependent manner (Fig. 2A). However, the reporter activity of claudin-2 was not inhibited by HhaI and SssI, DNA methylases, in the in vitro methylation assay (Fig. 2B). In contrast, AZA increased the expression levels of mRNA and protein and reporter activity of claudin-4 (Fig. 2, C and D). The in vitro methylation assay showed that the reporter activity of claudin-4 is significantly inhibited by HhaI and SssI (Fig. 2F). These results indicate that methyltransferases may not directly affect the transcriptional activity of claudin-2, whereas they may methylate the promoter region of claudin-4. The mRNA stability of claudin-2 was investigated in the presence of actinomycin D, a transcriptional inhibitor. Actinomycin D decreased the mRNA level of claudin-2 in a time-dependent manner (Fig. 2G). The effects were significant at 4 and 6 h compared with 0 h. AZA did not significantly decrease the mRNA level of claudin-2 compared with that in the absence of AZA. These results indicate that AZA may decrease the mRNA level of claudin-2 mediated by the inhibition of transcriptional activity but not by the decrease in the stability.
FIGURE 2.
Effect of AZA on the promoter activity and mRNA expression of claudins. A and E, claudin-2 or claudin-4 promoter luciferase vector was co-transfected with the pRL-TK vector into the cells. At 24 h after transfection, the cells were treated with DMSO vehicle (0 μm) or AZA for 8 h at the indicated concentration. The promoter activity is represented as percentage relative to the values in 0 μm. B and F, claudin-2 or claudin-4 promoter vector was preincubated in the absence (cont) and presence of HhaI or SssI. The promoter activity is represented as percentage relative to the values in control. C, cells were treated with DMSO vehicle (cont) or AZA (10 μm) for 6 h. Quantitative real time PCR was performed using primers for claudin-4. D, cells were treated with DMSO vehicle (cont) or AZA for 24 h. Cell lysates were immunoblotted with anti-claudin-4 and anti-β-actin antibodies. The expression levels of claudin-4 are represented as percentage of the values in control. G, cells were treated with 4 μm actinomycin D (Act D) in the absence and presence of 10 μm AZA for the period indicated. After isolation of total RNA, semi-quantitative PCR (left image) and quantitative real time PCRs (right graph) were performed using specific primers for claudin-2 and β-actin. n = 3–4. *, p < 0.05, and **, p < 0.01 compared with control or 0 μm. NS, p > 0.05 compared with control, 0 μm, or 0 h.
Effect of AZA on Intracellular Signaling Pathways Underlying Claudin-2 Up-regulation
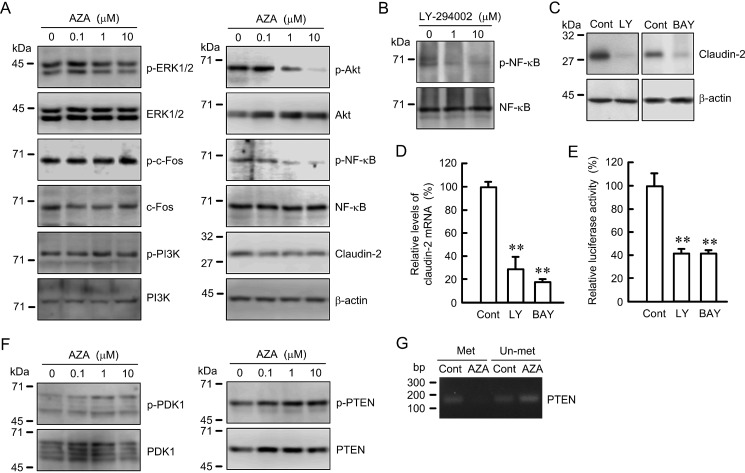
The mRNA level of claudin-2 is up-regulated by a MEK/ERK/c-Fos pathway in A549 cells (10). AZA slightly decreased the phosphorylation levels of ERK1/2, but it had no effect on the phosphorylation of c-Fos (Fig. 3A). The expression level of claudin-2 was not decreased by short term treatment with AZA. We examined the effect of AZA on other intracellular signaling pathways and found that it inhibits the phosphorylation of Akt and NF-κB. LY-294002, an inhibitor of PI3K which locates upstream of Akt, decreased the phosphorylation of NF-κB (Fig. 3B). LY-294002 and BAY 11-7082, an inhibitor of NF-κB, decreased the protein level of claudin-2 (Fig. 3C). Both LY-294002 and BAY 11-7082 decreased the levels of mRNA and reporter activity of claudin-2 (Fig. 3, D and E). The activity of Akt is bi-directionally regulated by 3-phosphoinositide-dependent protein kinase-1 (PDK1) and phosphatase and tensin homolog (PTEN) (30). AZA slightly increased the levels of phosphorylated and total PDK1 at 0.1 and 10 μm and strongly increased the level of phosphorylated PTEN in a dose-dependent manner (Fig. 3F). Methylation-specific PCR showed that the promoter region of PTEN is partially methylated under control conditions (Fig. 3G). AZA decreased the methylated band and increased the un-methylated band. These results indicate that the expression of PTEN may be regulated by methylation status of the promoter gene and the inhibition of a PI3K/Akt/NF-κB pathway may be involved in the down-regulation of claudin-2 by AZA.
FIGURE 3.
Effect of AZA on the phosphorylation of intracellular signaling protein. A, cells were treated with DMSO vehicle (0 μm) or AZA for 1 h at the indicated concentration. Cell lysates were immunoblotted with anti-p-ERK1/2, anti-ERK1/2, anti-p-c-Fos, anti-c-Fos, anti-p-PI3K, anti-PI3K, anti-p-Akt, anti-Akt, anti-p-NF-κB, anti-NF-κB, anti-claudin-2, and anti-β-actin antibodies. B, cells were incubated with LY-294002 for 1 h at the indicated concentration. Cell lysates were immunoblotted with anti-p-NF-κB and anti-NF-κB antibodies. C, cells were treated with DMSO vehicle (Cont, control), 10 μm LY-294002 (LY), or 20 μm BAY 11-7082 (BAY) for 24 h. Cell lysates were immunoblotted with anti-claudin-2 and anti-β-actin antibodies. D, cells were treated with DMSO vehicle (control), LY-294002, or BAY 11-7082 for 6 h. Quantitative real time PCR was performed using primers for claudin-2 and β-actin. The expression levels of claudin-2 mRNA are represented as percentage of the values in the control cells. E, claudin-2 promoter luciferase vector was co-transfected with the pRL-TK vector into the cells. At 24 h after transfection, the cells were treated with DMSO vehicle (control), LY-294002, or BAY 11-7082 for 6 h. The promoter activity is represented as percentage relative to the values in control. **, p < 0.01 compared with control. F, cells were incubated with AZA at the indicated concentration. Cell lysates were immunoblotted with anti-p-PDK1, anti-PDK1, anti-p-PTEN, and anti-PTEN antibodies. G, cells were incubated in the presence and absence of 10 μm AZA. After bisulfite modification of genomic DNA, methylation-specific PCR was performed using methylation (Met) and un-methylation (Un-met) primers. The PCR products were visualized with ethidium bromide. n = 3–4.
Involvement of NF-κB in AZA-induced Decrease in Claudin-2 Expression
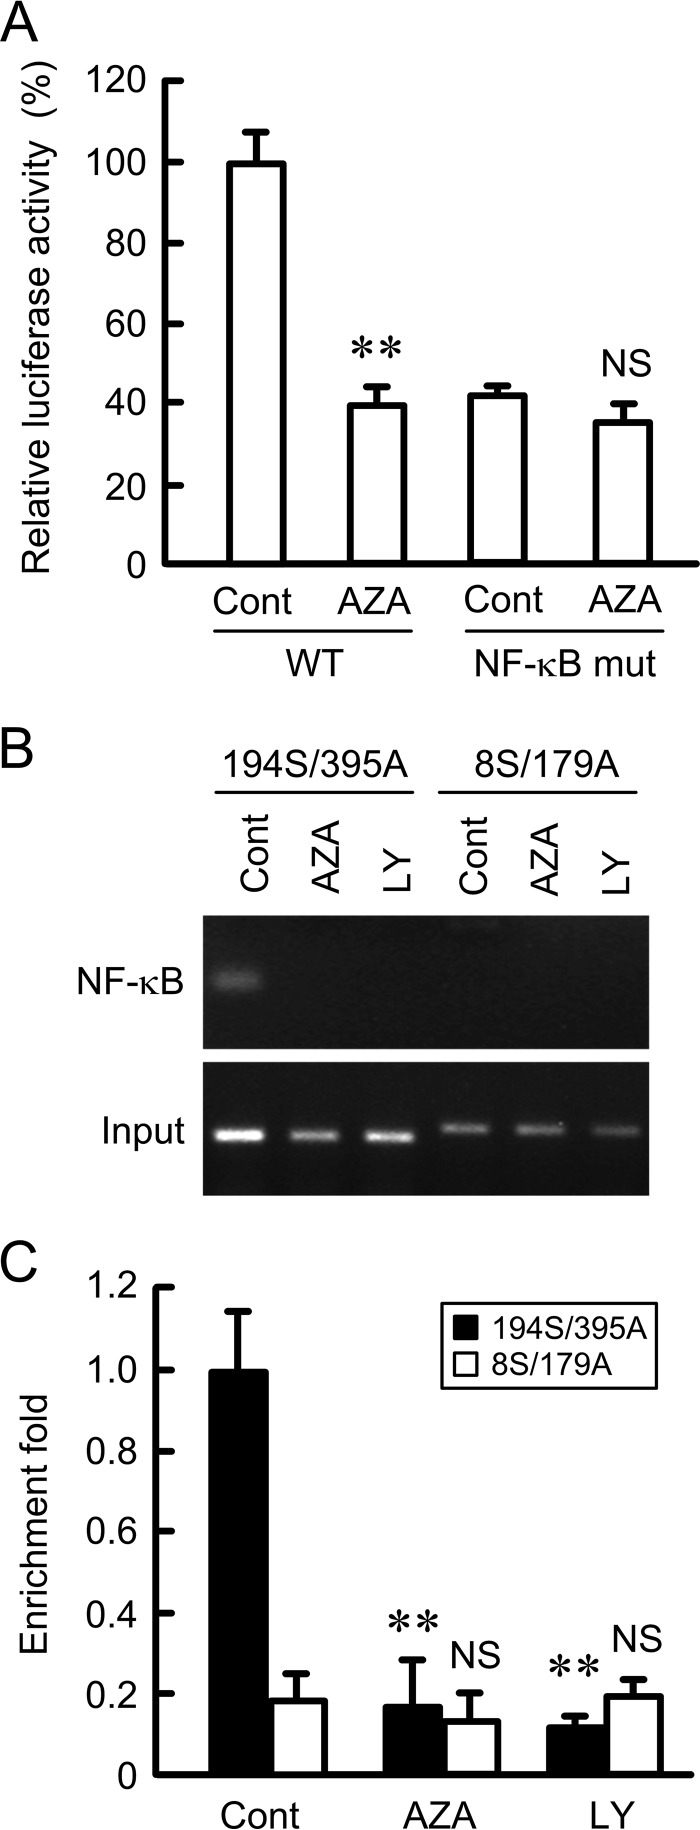
The promoter region of human claudin-2 contains one putative NF-κB-binding site. The promoter activity of the mutant of putative NF-κB-binding site was half that of wild type (Fig. 4A). The activity of wild type was decreased by AZA to a similar level as that of NF-κB mutant. In contrast, the activity of the NF-κB mutant was no longer inhibited by AZA. In the chromatin immunoprecipitation (ChIP) assay, primer pairs amplifying the NF-κB-binding site showed positive PCR signals in the control cells using anti-NF-κB antibody (Fig. 4, B and C). In the AZA- or LY-294002-treated cells, the PCR signal was faint. Similarly, a primer pair amplifying an ∼1000-bp region upstream from the NF-κB-binding site showed little signaling. In contrast, the primer pairs amplifying NF-κB binding and the upstream sites showed PCR bands using input samples. These results indicate that NF-κB may have a key role in the decrease in claudin-2 expression by AZA.
FIGURE 4.
Inhibition of association between NF-κB and κB-binding site of claudin-2 promoter region by AZA and LY-294002. A, wild type (WT) and NF-κB mutant of claudin-2 promoter luciferase vectors were co-transfected with the pRL-TK vector into the cells. At 24 h after transfection, the cells were treated with DMSO vehicle (cont) or 10 μm AZA for 8 h. The promoter activity is represented as a percentage relative to the values in the control of WT. B and C, nuclear proteins were prepared from the control, AZA-, and LY-294002-treated cells. After immunoprecipitation of genomic DNA by anti-NF-κB antibody, semi-quantitative PCR (B) and quantitative real time PCR (C) were performed using the primers amplifying the putative NF-κB-binding site (194S/395A) and 1,000-bp region (8S/179A) upstream from the putative NF-κB-binding site. To confirm that the same amounts of chromatin were used for the immunoprecipitation, input chromatin was also used. The PCR products were visualized with ethidium bromide. The amount of PCR products is represented relative to the value of control cells (194S/395A). n = 3–4. **, p < 0.01 compared with control. NS, p > 0.05 compared with control.
Effects of TSA and NaB on the Expression of Junctional Proteins in A549 Cells
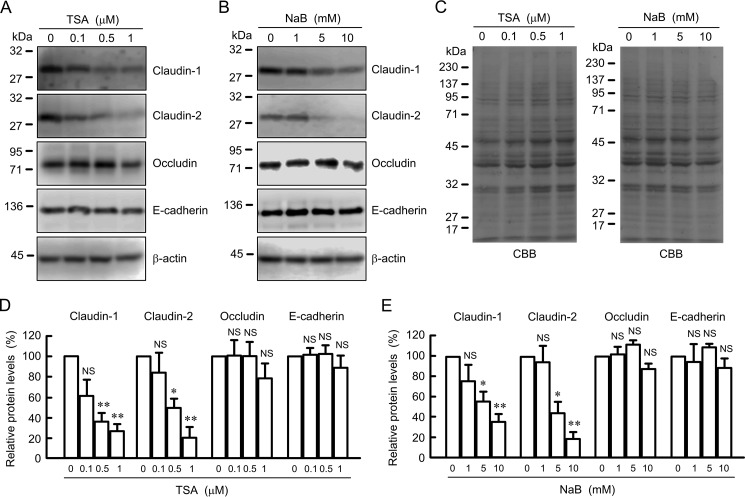
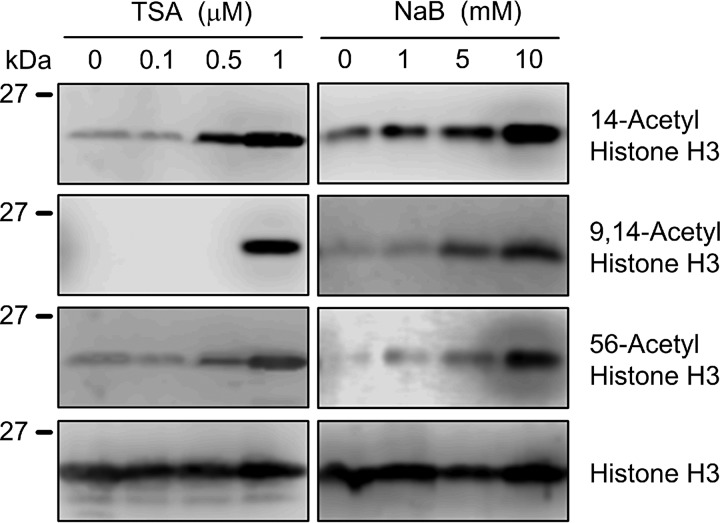
In the epigenetic mechanism, the phenomenon of histone acetylation also affects gene transcription. TSA and NaB, HDAC inhibitors, decreased the protein levels of claudin-1 and -2 in a dose-dependent manner, although they did not change those of occludin and E-cadherin (Fig. 5). Equal protein loading is verified by CBB staining. In the same range of concentration, both TSA and NaB increased the acetylation levels of histone H3 (Fig. 6). These results indicate that the expression of claudin-2 may be down-regulated by histone acetylation in A549 cells.
FIGURE 5.
Effects of TSA and NaB on the expression of junctional proteins. A and B, cells were treated with DMSO vehicle (0 μm), TSA, or NaB for 24 h at the indicated concentration. Cell lysates were immunoblotted with anti-claudin-1, anti-claudin-2, anti-occludin, anti-E-cadherin, and anti-β-actin antibodies. C, PVDF membrane was stained with CBB after immunoblotting. D and E, expression levels of claudin-1, claudin-2, occludin, and E-cadherin are represented as percentage of the values in 0 μm. n = 3–4. **, p < 0.01, and *, p < 0.05, compared with control or 0 μm. NS, p > 0.05.
FIGURE 6.
Increase in acetylation of histone by TSA and NaB. Cells were treated with DMSO vehicle (0 μm), TSA, or NaB for 6 h at the indicated concentration. Cell lysates were immunoblotted with anti-14-acetyl histone H3, anti-9,14-acetyl histone H3, anti-56-acetyl histone H3, and anti-histone H3 antibodies. n = 3–4.
Effect of TSA on Intracellular Signaling Pathways
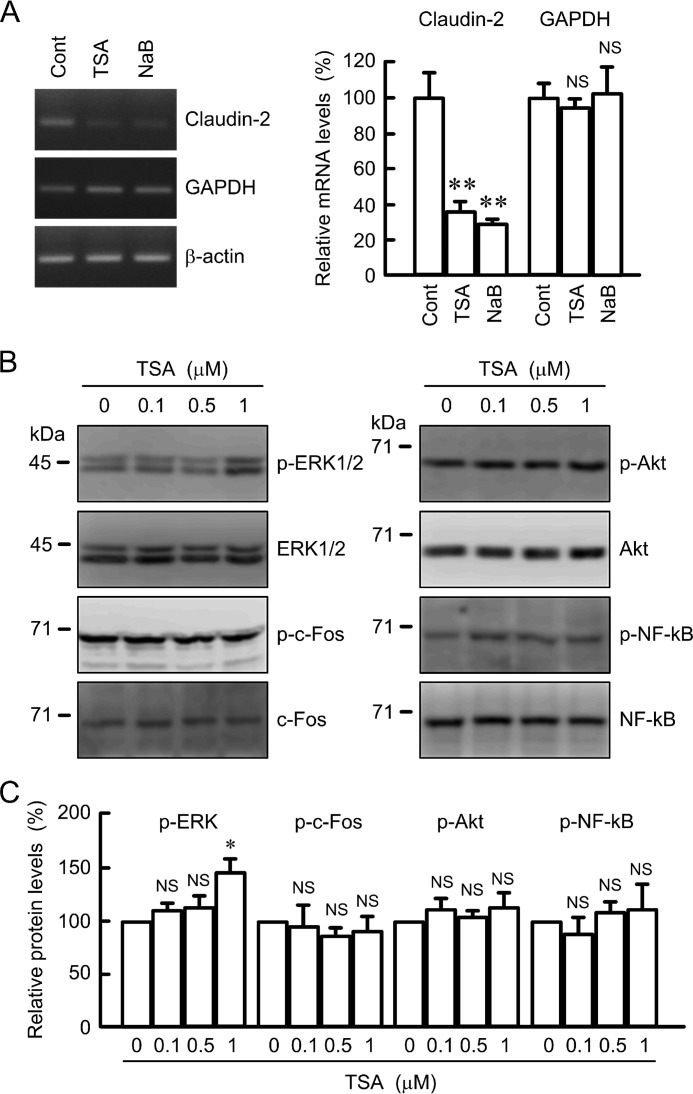
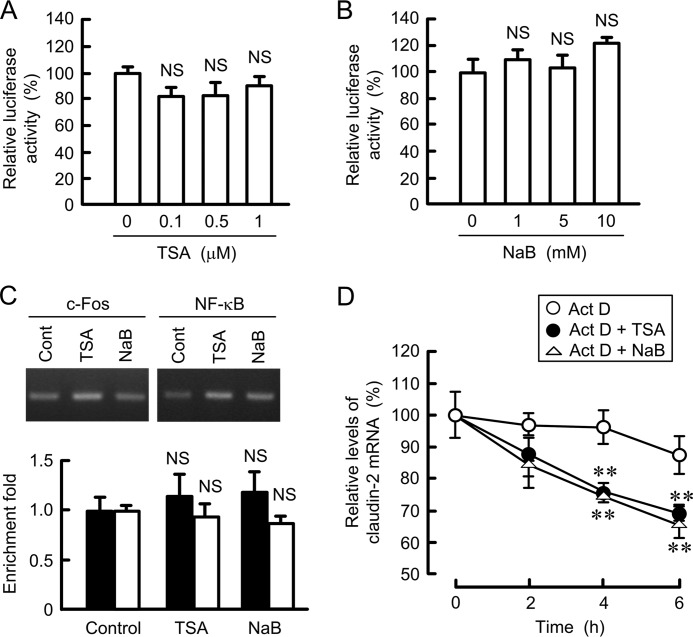
TSA and NaB decreased the mRNA levels of claudin-2 without affecting that of GAPDH (Fig. 7A). We examined whether TSA changes the activity of intracellular signaling pathways that are involved in the transcriptional regulation of claudin-2 expression. TSA slightly increased the phosphorylation of ERK1/2, but it had no effect on the phosphorylation of c-Fos, Akt, and NF-κB (Fig. 7, B and C). Furthermore, TSA and NaB did not significantly inhibit promoter activity of claudin-2 (Fig. 8, A and B). In the ChIP assay, the binding of c-Fos and NF-κB on the promoter region of claudin-2 was not inhibited by TSA and NaB (Fig. 8C). These results indicate that histone acetylation may not be directly involved in the transcriptional regulation of claudin-2. Next, we examined the effects of TSA and NaB on the stability of claudin-2 mRNA. The expression levels of claudin-2 mRNA were time-dependently decreased in the presence of actinomycin D (Fig. 8D). Both TSA and NaB enhanced the decrease in claudin-2 mRNA. These results indicate that TSA and NaB decrease the mRNA levels of claudin-2 mediated by the reduction of mRNA stability.
FIGURE 7.
Effects of TSA and NaB on claudin-2 mRNA and phosphorylation of intracellular signaling protein. A, cells were treated with DMSO vehicle (control), 1 μm TSA, or 10 mm NaB for 6 h. After isolation of total RNA and reverse transcription, semi-quantitative PCR (left image) and quantitative real time PCR (right graph) were performed using primers for claudin-2 and GAPDH. β-actin served as an internal control. The expression levels of mRNA are represented as percentage of the control cells. B, cells were treated with DMSO vehicle (0 μm) or TSA for 1 h at the indicated concentration. Cell lysates were immunoblotted with anti-p-ERK1/2, anti-ERK1/2, anti-p-c-Fos, anti-c-Fos, anti-p-Akt, anti-Akt, anti-p-NF-κB, and anti-NF-κB antibodies. C, levels of p-ERK1/2, p-c-Fos, p-Akt, and p-NF-κB are represented as percentage of the values in 0 μm. n = 3–4. **, p < 0.01 compared with control. *, p < 0.05, and NS, p > 0.05 compared with 0 μm or control.
FIGURE 8.
Effects of HDAC inhibitors on the promoter activity, binding of transcriptional factors, and mRNA stability of claudin-2. A and B, claudin-2 promoter luciferase vector was co-transfected with the pRL-TK vector into the cells. At 24 h after transfection, the cells were treated with DMSO vehicle (0 μm), TSA, or NaB for 8 h at the indicated concentration. The promoter activity is represented as percentage of the value in the absence of HDAC inhibitors. C, nuclear proteins were prepared from the control, 1 μm TSA-treated, and 10 mm NaB-treated cells. After immunoprecipitation of genomic DNA by anti-c-Fos or anti-NF-κB antibodies, semi-quantitative PCR (upper images) and quantitative real time PCR (lower graph) were performed using the primers amplifying the c-Fos (closed bars) or putative NF-κB binding (open bars) sites of claudin-2 promoter. Input chromatin was used for normalization. The amount of PCR products is represented relative to the value of control cells. D, cells were treated with 4 μm actinomycin D (Act D) in the absence and presence of 1 μm TSA or 10 mm NaB for the indicated period. After isolation of total RNA, quantitative real time PCR was performed using specific primers for claudin-2 and β-actin. The expression levels of claudin-2 mRNA are represented as percentage of the value in 0 h. n = 3–4. **, p < 0.01 compared with actinomycin D alone. NS, p > 0.05 compared with 0 μm.
Decrease in Claudin-2 mRNA by miR-497 miRNA
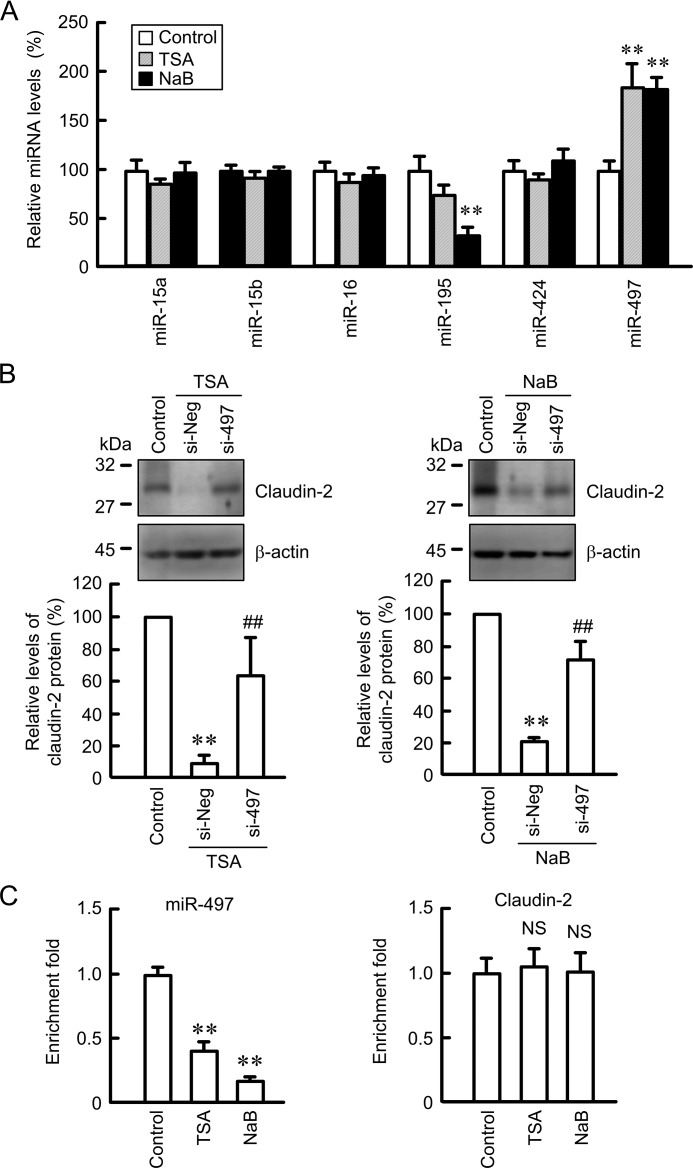
miRNA is involved in the regulation of mRNA stability. As reported previously (18), TargetScan analyses indicate that the 3′-untranslated region of claudin-2 contains putative binding sites for miR-15a, -15b, -16, -195, -424, and -497. TSA and NaB decreased the miR-195 level, whereas they increased the miR-497 level (Fig. 9A). The expression levels of miR-15a, -15b, -16, and -424 were not changed by these treatments. The TSA- and NaB-induced decreases in claudin-2 mRNA were inhibited by the introduction of siRNA for miR-497 (Fig. 9B). In ChIP assay using anti-histone H3 antibody, the binding of histone H3 on the promoter region of miR-497 was inhibited by TSA and NaB, whereas that on the promoter of claudin-2 was not (Fig. 9C).
FIGURE 9.
Involvement of miR-497 in HDAC inhibitor-induced decrease in claudin-2 expression. A, cells were treated with DMSO vehicle (control), 1 μm TSA, or 10 mm NaB for 6 h. After isolation of total RNA and reverse transcription, quantitative real time PCR was performed using primers for each miRNA. The expression of miRNA is represented as percentage of the value in the control cells. B, cells were transfected with negative control (si-Neg) or miR-497 siRNA (si-497). At 48 h after transfection, the cells were treated with DMSO vehicle (control), TSA, or NaB for additional 24 h. Cell lysates were immunoblotted with anti-claudin-2 and anti-β-actin antibodies. The expression levels of claudin-2 are represented as percentage of the values in the control. C, complex of DNA and nuclear proteins were prepared from the control, 1 μm TSA-treated, and 10 mm NaB-treated cells. After immunoprecipitation of genomic DNA by anti-histone H3 antibody, quantitative PCR was performed using the primers amplifying the promoter regions of miR-497 and claudin-2. The amount of PCR products is represented relative to the value of control cells after correction of the intensity of ChIP samples using the input amount. n = 3–4. **, p < 0.01 compared with control. ##, p < 0.01 compared with TSA or NaB alone. NS, p > 0.05 compared with control.
Effects of Combination of Epigenetic Inhibitors on Claudin-2 Expression and Cell Proliferation
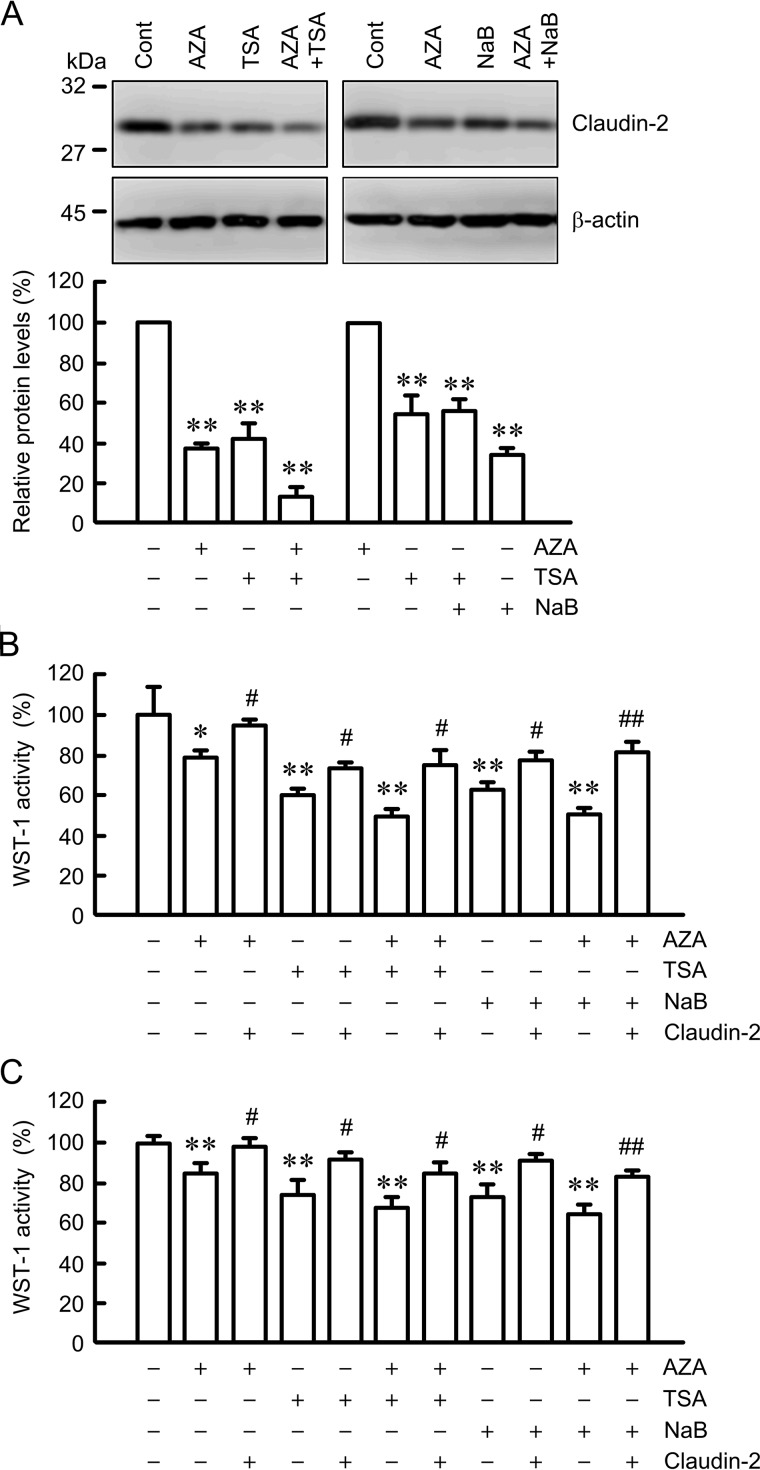
To clarify the effect of claudin-2 expression on cell proliferation, we investigated the combination effects of AZA, TSA, NaB, and ectopic expression of claudin-2 on claudin-2 expression and tetrazolium salt 4-[3-(4-iodophenyl)-2-(4-nitrophenyl)-2H-5-tetrazolio]-1,3-benzene disulfonate (WST-1) activity. The protein levels of claudin-2 were decreased by AZA, TSA, and NaB (Fig. 10A). The effect was additively enhanced by co-treatments of AZA and HDAC inhibitors. WST-1 activity was significantly inhibited by AZA, TSA, and NaB treatments (Fig. 10B). Co-treatment of cells with TSA or NaB enhanced the decrease in WST-1 activity in the presence of AZA. The ectopic expression of claudin-2 significantly recovered WST-1 activity in the presence of AZA, TSA, and NaB. Similarly, WST-1 activity was significantly inhibited by AZA, TSA, and NaB treatments, which was recovered by the ectopic expression of claudin-2 in human bronchial BEAS-2B cells in which claudin-2 is absent (Fig. 10C). These results indicate that epigenetic inhibitors partially suppress proliferation in A549 cells mediated by the decrease in claudin-2 expression.
FIGURE 10.
Effects of epigenetic inhibitors and ectopic claudin-2 expression on cell proliferation. A, cells were treated with DMSO vehicle (cont), 0.5 μm TSA, 5 mm NaB, or both TSA and NaB for 24 h. Cell lysates were immunoblotted with anti-claudin-2 and anti-β-actin antibodies. The expression levels of claudin-2 are represented as percentage of the values in the control. B and C, mock and claudin-2 expression vectors were transfected into A549 (B) and BEAS-2B (C) cells. 24 h after transfection, A549 cells were incubated in the absence and presence of 1 μm AZA, 0.5 μm TSA, or 5 mm NaB for 24 h. BEAS-2B cells were incubated in the absence and presence of 5 μm AZA, 1 μm TSA, or 10 mm NaB for 24 h. Cell proliferation was measured using WST-1 and is represented as percentage of the value in the control cells. n = 3–6. **, p < 0.01, and *, p < 0.05, compared with control. ##, p < 0.01, and #, p < 0.05, compared with the value in the absence of ectopically claudin-2 expression.
Discussion
Claudin-2 is expressed in the small intestine and the proximal tubules of kidney under physiological conditions and controls monovalent cation permeability (31, 32). The elevation of claudin-2 expression has been reported in colorectal (16), fibrolamellar hepatocellular (33), and gastric cancers (34), whereas reduced expression of claudin-2 is associated with a high histological grade and metastasis of feline mammary carcinomas (35). We recently found that claudin-2 is highly expressed in human lung adenocarcinoma tissues and cultured cells, although it is absent in normal lung tissues (10). The knockdown of claudin-2 by siRNA decreases proliferation concomitant with suppression of cell cycle G1/S progression in A549 cells (14). Furthermore, claudin-2 knockdown decreases cyclin D1 and E1, cell cycle progression factors. It is unknown why the role of claudin-2 on controlling cell proliferation is different among tissues, but the elevation of claudin-2 must be involved in the elevation of cell proliferation in lung adenocarcinoma.
The expression of claudin-2 is transcriptionally regulated by the PI3K/Akt pathway. LY-294002 decreases mRNA levels and promoter activity of claudin-2, but the transcriptional factor, a downstream regulator of Akt, has not been clarified. Here, we found that LY-294002 decreases phosphorylated NF-κB levels, and BAY 11-7082, a NF-κB inhibitor, decreases mRNA levels and promoter activity of claudin-2 (Fig. 3). Several components of the PI3K/Akt/NF-κB pathway are dysregulated in lung adenocarcinoma. The expression of PTEN, a negative regulator of Akt, is inversely correlated with the expression of phosphorylated Akt, and the survival rates of PTEN-negative adenocarcinoma patients are lower than those of PTEN-positive patients (36). Immunohistochemical analysis showed that the expression levels of activated NF-κB in adenocarcinoma, especially of TNM stage III and IV, are higher than those in normal tissues (37). NF-κB induces the development of tumors in a mouse model of lung adenocarcinoma (38). The PI3K/Akt/NF-κB pathway must play a central role in cell proliferation. Claudin-2 may have a function of inhibiting proliferation downstream of these signaling pathways.
The CpG island is detected in the promoter region of claudin-4 but not in the regions of claudin-1 and -2 (UCSC Genome Browser). AZA increased mRNA, protein levels, and reporter activity of claudin-4 (Fig. 2, C–E). In the absence of AZA treatment, the reporter activity of claudin-4 was inhibited by HhaI or SssI in the in vitro methylation assay (Fig. 2F), suggesting that the reporter activity is regulated by methylation. In the expression analysis of endogenous claudins in A549 cells, AZA increased the levels of claudin-8, but the expression levels of claudin-3, -5, -7, and -12 were under the detection level (data not shown). Although the promoter region of claudin-2 did not contain the CpG island, AZA decreased mRNA, protein levels, and reporter activity of claudin-2 (Figs. 1 and 2). Interestingly, the reporter activity of the claudin-2 plasmid vector pretreated with HhaI or SssI was similar to that of the control vector (Fig. 2B). We hypothesized that AZA may decrease the mRNA level of claudin-2 mediated by an indirect mechanism but not by demethylation of the promoter region of claudin-2. In the analysis of the mechanism of AZA, we found that AZA does not inhibit p-c-Fos but decreased the levels of p-Akt and p-NF-κB. These results suggest that AZA decreases claudin-2 levels mediated by the inhibition of the PI3K/Akt/NF-κB pathway. AZA increased the levels of PTEN, a negative regulator of Akt (Fig. 3F). Two sites within the PTEN promoters are methylated in tamoxifen resistance MCF-7 cells (39). Actually, our data indicate that the PTEN promoter is partially methylated, which is inhibited by AZA in A549 cells (Fig. 3G). AZA may inhibit methylation of the promoter region of PTEN, resulting in the elevation of binding of transcription factor and transcription activity. AZA increased p-PTEN and PTEN levels in A549 cells, suggesting that it can improve the behavior of lung adenocarcinoma caused by loss of PTEN.
Aberrant hyperacetylation of histone is reported in cancer tissues, including NSCLC (40). Deacetylation of histone H2 and H3 conferred a better prognosis in NSCLC (41). Acetylation is a reversible modification of histone and non-histone proteins, and is oppositely controlled by HATs and HDACs. HDACs are often overexpressed in cancers and lead to silencing of tumor suppressor genes. HDAC inhibitors induce chromatin relaxation, allowing enhanced transcription of tumor suppressor genes (20). The binding of histone H3 with the promoter of miR-497 was decreased by HDAC inhibitors but that of claudin-2 was not (Fig. 9C). Furthermore, the reporter activity of claudin-2 was not inhibited by HDAC inhibitors (Fig. 8). We suggest that acetylation of histone H3 is not directly involved in the transcriptional regulation of claudin-2.
The expression of miRNA is reported to be up-regulated by HDAC inhibitors in various cancers (42, 43). We recently reported that the 3′-untranslated region of claudin-2 contains putative binding sites for miR-15a, -15b, -16, -195, -424, and -497 by TargetScan analysis (18). Quercetin, a flavonoid abundantly present in fruits and vegetables, decreased claudin-2 expression mediated by the elevation of miR-16 expression. HDAC inhibitors did not change miR-16 expression but elevated miR-497 expression (Fig. 9). miR-497 siRNA rescued the HDAC inhibitor-induced decrease in claudin-2. We suggest that miR-497 plays a key role in the down-regulation of claudin-2 by HDAC inhibitors in A549 cells. miR-497 is expressed in almost all tissues, including lung (44). The down-regulation of miR-497 is reported in a variety of cancer tissues, including lung (45), breast (46), stomach (47), and colon (48). Ectopic expression of miR-497 inhibits cell proliferation in vitro and tumor growth in a xenograft mouse model using A549 cells (49). Ectopic expression of claudin-2 partially rescued cell growth inhibition caused by HDAC inhibitors (Fig. 10). Claudin-2 may be utilized as a marker of adenocarcinoma and become a target for anti-cancer therapy.
In conclusion, we found that epigenetic inhibitors decrease the levels of claudin-2 in lung adenocarcinoma A549 cells. AZA decreased transcription activity and mRNA levels of claudin-2 mediated by the inhibition of the PI3K/Akt/NF-κB pathway. TSA and NaB decreased mRNA levels of claudin-2, but they did not inhibit signaling pathways, which are involved in the up-regulation of claudin-2 expression. These HDAC inhibitors decreased the stability of claudin-2 mRNA mediated by the elevation of miR-497. The decrease in cell proliferation caused by epigenetic inhibitors was partially rescued by ectopic expression of claudin-2. We suggest that AZA can inhibit proliferation more effectively in adenocarcinoma cells abundantly expressing claudin-2. DNA methylation and HDAC inhibitors can down-regulate claudin-2 expression in a different mechanism of action. The anti-cancer effects of DNA methylation and HDAC inhibitors may be enhanced by a combination treatment in lung adenocarcinoma highly expressing claudin-2.
Experimental Procedures
Materials
Rabbit anti-claudin-1 polyclonal (71-7800) and rabbit anti-claudin-2 polyclonal (51-6100) antibodies were obtained from Zymed Laboratories Inc.. Mouse anti-E-cadherin monoclonal (610181) antibodies were from BD Biosciences; goat anti-β-actin polyclonal (sc-1615), rabbit anti-p-ERK1/2 polyclonal (sc-16982R), mouse anti-p-c-Fos monoclonal (sc-81485), and goat anti-occludin polyclonal (sc-8145) antibodies were from Santa Cruz Biotechnology (Santa Cruz, CA). Rabbit anti-p-Akt polyclonal (catalog no. 4060), rabbit anti-Akt polyclonal (catalog no. 4691), rabbit anti-ERK1/2 polyclonal (catalog no. 4695), rabbit anti-p-EGFR (catalog no. 3777), rabbit anti-c-Fos polyclonal (catalog no. 2250), rabbit anti-p-NF-κB polyclonal (catalog no. 3033), rabbit anti-NF-κB polyclonal (catalog no. 3987), rabbit anti-p-PTEN polyclonal (catalog no. 9551), rabbit anti-PTEN polyclonal (catalog no. 9188), rabbit anti-p-PDK1 polyclonal (catalog no. 3438), and rabbit anti-PDK1 (catalog no. 3062) polyclonal antibodies were from Cell Signaling Technology (Beverly, MA). Mouse anti-EGFR monoclonal (GTX23103) antibodies were from GeneTex (Irvine, CA). Lipofectamine 2000 was purchased from Invitrogen. All other reagents were of the highest purity available.
Cell Culture and Transfection
Human lung adenocarcinoma A549 cells and human bronchial BEAS-2B cells were obtained from the RIKEN BRC (Ibaraki, Japan) and American Type Culture Collection (Manassas, VA), respectively. Cells were grown in Dulbecco's modified Eagle's medium (Sigma) supplemented with 5% fetal calf serum (HyClone, Logan, UT), 0.07 mg/ml penicillin-G potassium, and 0.14 mg/ml streptomycin sulfate in a 5% CO2 atmosphere at 37 °C. Plasmid vectors and siRNA were transfected into cells using Lipofectamine 2000 as recommended by the manufacturer. As a negative control, nontargeting control siRNA (Santa Cruz Biotechnology) was used in the siRNA experiments.
RNA Isolation and Quantitative Reverse Transcription-Polymerase Chain Reaction (RT-PCR)
Total RNA was isolated from cells using Isogen II (NIPPON GENE, Toyama, Japan). Reverse transcription was carried out with a ReverTraAce PCR RT kit (Toyobo Life Science, Osaka, Japan). Semi-quantitative PCR was performed using GoTaq (Promega, Madison, WI), and PCR products were analyzed by agarose gel electrophoresis. Quantitative real time PCR was performed as described previously (10). The primers used for PCR are listed in Table 1. The threshold cycle (Ct) for each PCR product was calculated with the instrument's software, and Ct values obtained for claudins were normalized by subtracting the Ct values obtained for β-actin. Equal loading was verified by GAPDH. In the experiments of miRNAs, reverse transcription was carried out with Mir-X miRNA First-Strand Synthesis kit (Takara, Osaka, Japan). Quantitative real time PCR was performed using the specific primers for miRNAs (forward) and mRQ 3′ primer (reverse). The forward primers are listed in Table 1. The Ct values obtained for miRNAs were normalized by subtracting the Ct values obtained for U6 snRNA as recommended by the manufacturer's instructions. The resulting ΔCt values were then used to calculate the relative change in mRNA expression as a ratio (R) according to the equation R = 2−(ΔCt(treatment) − ΔCt(control)).
TABLE 1.
Primers for PCR amplification
| Name | Direction | Sequence |
|---|---|---|
| Claudin-1 | Forward | 5′-ATGAGGATGGCTGTCATTGG-3′ |
| Claudin-1 | Reverse | 5′-ATTGACTGGGGTCATAGGGT-3′ |
| Claudin-2 | Forward | 5′-ATTGTGACAGCAGTTGGCTT-3′ |
| Claudin-2 | Reverse | 5′-CTATAGATGTCACACTGGGTGATG-3′ |
| Occludin | Forward | 5′-TTTGTGGGACAAGGAACACA-3′ |
| Occludin | Reverse | 5′-TCATTCACTTTGCCATTGGA-3′ |
| E-cadherin | Forward | 5′-ACCCCCTGTTGGTGTCTTT-3′ |
| E-cadherin | Reverse | 5′-TTCGGGCTTGTTGTCATTCT-3′ |
| GAPDH | Forward | 5′-GCCATCAATGACCCCTTCATT-3′ |
| GAPDH | Reverse | 5′-TCTCGCTCCTGGAAGATGG-3′ |
| β-Actin | Forward | 5′-CCTGAGGCACTCTTCCAGCCTT-3′ |
| β-Actin | Reverse | 5′-TGCGGATGTCCACGTCACACTTC-3′ |
| PTEN (Met) | Forward | 5′-GTTTGGGGATTTTTTTTTCGC-3′ |
| PTEN (Met) | Reverse | 5′-AACCCTTCCTACGCCGCG-3′ |
| PTEN (Un-met) | Forward | 5′-TATTAGTTTGGGGATTTTTTTTTTGT-3′ |
| PTEN (Un-met) | Reverse | 5′-CCCAACCCTTCCTACACCACA-3′ |
| miR-15a | Forward | 5′-TAGCAGCACATAATGGTTTGTG-3′ |
| miR-15b | Forward | 5′-TAGCAGCACATCATGGTTTACA-3′ |
| miR-16 | Forward | 5′-TAGCAGCACGTAAATATTGGCG-3′ |
| miR-195 | Forward | 5′-TAGCAGCACAGAAATATTGGC-3′ |
| miR-424 | Forward | 5′-CAGCAGCAATTCATGTTTTGAA-3′ |
| miR-497 | Forward | 5′-CAGCAGCACACTGTGGTTTGT-3′ |
Methylation-specific PCR
Genomic DNA of A549 cells was extracted using Wizard SV Genomic DNA purification system (Promega) according to the manufacturer's instructions. The methylation status of the PTEN promoter region was examined by methylation-specific PCR. DNA was treated with sodium bisulfite using a MethylEasyTMXceed Rapid DNA bisulfite modification kit (Takara). After bisulfite modification, PCR was performed using EpiTaq HS (Takara). The primers are listed in Table 1.
SDS-PAGE and Immunoblotting
The preparation of cell lysates, including plasma membrane and cytosolic fractions, was performed as described previously (15). Equal amounts of cell lysates (40–60 μg) were applied to the SDS-polyacrylamide gel. Proteins were blotted onto a poly(vinylidene fluoride) membrane and incubated with each primary antibody (1:1,000 dilution) at 4 °C for 16 h, followed by a peroxidase-conjugated secondary antibody (1:5,000 dilution) at room temperature for 1 h. Finally, the blots were incubated in EzWestLumi plus (Atto Corp., Tokyo, Japan) and scanned with a C-DiGit Blot Scanner (LI-COR Biotechnology, Lincoln, NE). PVDF membrane was stained with CBB after immunoblotting. Band density was quantified using ImageJ software (National Institutes of Health, Bethesda).
Plasmid Constructs and Luciferase Reporter Assay
Using the reporter plasmid containing a fragment of −1,031/+37 of human claudin-2, luciferase reporter assay was carried out as described previously (10). The reporter plasmid containing a fragment of human claudin-4 was kindly gifted from Dr. T. Suzuki (Hiroshima University, Japan). Cells were transfected with plasmid DNA using Lipofectamine 2000 as recommended by the manufacturer. In in vitro methylation assay, plasmid DNA was methylated by HhaI and SssI methylases (New England Biolabs, Frankfurt am Main, Germany). At 48 h after transfection, luciferase activity was assessed using the Dual-Glo Luciferase Assay System (Promega). Relative promoter activity was represented as percentage of control. The mutant of NF-κB-binding site was generated using a KOD-Plus mutagenesis kit (Toyobo). The primer pair was 5′-GAATTACCGCAGGGCCCCCTCTCAGTCCTGGA-3′ (sense) and 5′-AAATTCCCTGGGCCATCTGTTAGGG-3′ (antisense).
ChIP Assay
Cells were treated with 1% formaldehyde to cross-link the protein to the DNA. ChIP assay was carried out as described previously (10). To co-immunoprecipitate the DNA, anti-NF-κB, anti-c-Fos, and anti-histone H3 antibodies were used. The eluted DNA was amplified by semi-quantitative and quantitative PCR. The primers used for PCR are listed in Table 2. To confirm the same amounts of chromatins used in immunoprecipitation between groups, input chromatin was also used.
TABLE 2.
Primers for PCR amplification of ChIP assay
| Name | Sequence |
|---|---|
| Claudin-2 194-sense | 5′-CCTCATGCAAAGCCCTATATTC-3′ |
| Claudin-2 395-antisense | 5′-ATAACATGCCCAGACATTTCCT-3′ |
| Claudin-2 8-sense | 5′-AAGGAACCATGGATTTGAGG-3′ |
| Claudin-2 179-antisense | 5′-CTTCCCTGTGTTCCCTGTGT-3′ |
| miR-497 962-sense | 5′-GGGCCTAAAAAGACTGCTTACA-3′ |
| miR-497 1182-antisense | 5′-TTCTCCTGTCCAGGACTTGATT-3′ |
Cell Proliferation Assay
Cells were seeded at 6 × 10³ cells/well in a 96-well plate. After a 24-h culture, the cells were transfected with mock or claudin-2 expression vector. Then the cells were incubated in the presence and absence of AZA, TSA, and NaB. Cell proliferation was assessed using WST-1. The absorbance of WST-1 was measured at 405 nm, with background subtraction at 655 nm, using a Model 680 Microplate Reader (Bio-Rad).
Statistics
Results are presented as means ± S.E. Differences between groups were analyzed with a one-way analysis of variance, and corrections for multiple comparison were made using Tukey's multiple comparison test. Comparisons between the two groups were made using Student's t test. Statistics were performed using KaleidaGraph version 4.5.1 software (Synergy Software). Significant differences were assumed at p < 0.05.
Author Contributions
A. H., M. O., S. T., and R. A. performed the experiments and analyzed the data. S. E. and T. M. contributed to the experiment plan and discussion of the manuscript. A. I. contributed to supervision of the project, interpretation of data, and writing the paper. All authors reviewed the results and approved the final version of the manuscript.
This work was supported in part by Japan Society for the Promotion of Science KAKENHI Grant 15H04657 and grants from the Takeda Science Foundation, the Ichiro Kanehara, and the Sagawa Foundation for Promotion of Cancer Research (to A. I.). The authors declare that they have no conflicts of interest with the contents of this article.
- TJ
- tight junction
- AZA
- azacitidine
- Ct
- threshold cycle
- FDA
- Food and Drug Administration
- HAT
- histone acetyltransferase
- HDAC
- histone deacetylase
- NSCLC
- non-small cell lung cancer
- NaB
- sodium butyrate
- PTEN
- phosphatase and tensin homolog
- TSA
- trichostatin A
- WST-1
- 2-(4-iodophenyl)-3-(4-nitrophenyl)-5-(2,4-disulfophenyl)-2H-tetrazolium
- CBB
- Coomassie Brilliant Blue G-250.
References
- 1. Tsukita S., Yamazaki Y., Katsuno T., Tamura A., and Tsukita S. (2008) Tight junction-based epithelial microenvironment and cell proliferation. Oncogene 27, 6930–6938 [DOI] [PubMed] [Google Scholar]
- 2. Powell D. W. (1981) Barrier function of epithelia. Am. J. Physiol. 241, G275–G288 [DOI] [PubMed] [Google Scholar]
- 3. Matter K., and Balda M. S. (2003) Signalling to and from tight junctions. Nat. Rev. Mol. Cell Biol. 4, 225–236 [DOI] [PubMed] [Google Scholar]
- 4. Wittchen E. S., Haskins J., and Stevenson B. R. (1999) Protein interactions at the tight junction. Actin has multiple binding partners, and ZO-1 forms independent complexes with ZO-2 and ZO-3. J. Biol. Chem. 274, 35179–35185 [DOI] [PubMed] [Google Scholar]
- 5. Furuse M. (2010) Molecular basis of the core structure of tight junctions. Cold Spring Harb. Perspect. Biol. 2, a002907. [DOI] [PMC free article] [PubMed] [Google Scholar]
- 6. Furuse M., Fujita K., Hiiragi T., Fujimoto K., and Tsukita S. (1998) Claudin-1 and -2: novel integral membrane proteins localizing at tight junctions with no sequence similarity to occludin. J. Cell Biol. 141, 1539–1550 [DOI] [PMC free article] [PubMed] [Google Scholar]
- 7. Tsukita S., Furuse M., and Itoh M. (2001) Multifunctional strands in tight junctions. Nat. Rev. Mol. Cell Biol. 2, 285–293 [DOI] [PubMed] [Google Scholar]
- 8. Mineta K., Yamamoto Y., Yamazaki Y., Tanaka H., Tada Y., Saito K., Tamura A., Igarashi M., Endo T., Takeuchi K., and Tsukita S. (2011) Predicted expansion of the claudin multigene family. FEBS Lett. 585, 606–612 [DOI] [PubMed] [Google Scholar]
- 9. Turksen K., and Troy T. C. (2004) Barriers built on claudins. J. Cell Sci. 117, 2435–2447 [DOI] [PubMed] [Google Scholar]
- 10. Ikari A., Sato T., Watanabe R., Yamazaki Y., and Sugatani J. (2012) Increase in claudin-2 expression by an EGFR/MEK/ERK/c-Fos pathway in lung adenocarcinoma A549 cells. Biochim. Biophys. Acta 1823, 1110–1118 [DOI] [PubMed] [Google Scholar]
- 11. Halász J., Holczbauer A., Páska C., Kovács M., Benyó G., Verebély T., Schaff Z., and Kiss A. (2006) Claudin-1 and claudin-2 differentiate fetal and embryonal components in human hepatoblastoma. Hum. Pathol. 37, 555–561 [DOI] [PubMed] [Google Scholar]
- 12. Kinugasa T., Huo Q., Higashi D., Shibaguchi H., Kuroki M., Tanaka T., Futami K., Yamashita Y., Hachimine K., Maekawa S., Nabeshima K., Iwasaki H., and Kuroki M. (2007) Selective up-regulation of claudin-1 and claudin-2 in colorectal cancer. Anticancer Res. 27, 3729–3734 [PubMed] [Google Scholar]
- 13. Xin S., Huixin C., Benchang S., Aiping B., Jinhui W., Xiaoyan L., Yu W. B., and Minhu C. (2007) Expression of Cdx2 and claudin-2 in the multistage tissue of gastric carcinogenesis. Oncology 73, 357–365 [DOI] [PubMed] [Google Scholar]
- 14. Ikari A., Watanabe R., Sato T., Taga S., Shimobaba S., Yamaguchi M., Yamazaki Y., Endo S., Matsunaga T., and Sugatani J. (2014) Nuclear distribution of claudin-2 increases cell proliferation in human lung adenocarcinoma cells. Biochim. Biophys. Acta 1843, 2079–2088 [DOI] [PubMed] [Google Scholar]
- 15. Ikari A., Sato T., Takiguchi A., Atomi K., Yamazaki Y., and Sugatani J. (2011) Claudin-2 knockdown decreases matrix metalloproteinase-9 activity and cell migration via suppression of nuclear Sp1 in A549 cells. Life Sci. 88, 628–633 [DOI] [PubMed] [Google Scholar]
- 16. Dhawan P., Ahmad R., Chaturvedi R., Smith J. J., Midha R., Mittal M. K., Krishnan M., Chen X., Eschrich S., Yeatman T. J., Harris R. C., Washington M. K., Wilson K. T., Beauchamp R. D., and Singh A. B. (2011) Claudin-2 expression increases tumorigenicity of colon cancer cells: role of epidermal growth factor receptor activation. Oncogene 30, 3234–3247 [DOI] [PMC free article] [PubMed] [Google Scholar]
- 17. Tabariès S., Dong Z., Annis M. G., Omeroglu A., Pepin F., Ouellet V., Russo C., Hassanain M., Metrakos P., Diaz Z., Basik M., Bertos N., Park M., Guettier C., Adam R., Hallett M., and Siegel P. M. (2011) Claudin-2 is selectively enriched in and promotes the formation of breast cancer liver metastases through engagement of integrin complexes. Oncogene 30, 1318–1328 [DOI] [PubMed] [Google Scholar]
- 18. Sonoki H., Sato T., Endo S., Matsunaga T., Yamaguchi M., Yamazaki Y., Sugatani J., and Ikari A. (2015) Quercetin decreases claudin-2 expression mediated by up-regulation of microRNA miR-16 in lung adenocarcinoma A549 cells. Nutrients 7, 4578–4592 [DOI] [PMC free article] [PubMed] [Google Scholar]
- 19. Park Y. J., Claus R., Weichenhan D., and Plass C. (2011) Genome-wide epigenetic modifications in cancer. Prog. Drug Res. 67, 25–49 [DOI] [PMC free article] [PubMed] [Google Scholar]
- 20. Ansari J., Shackelford R. E., and El-Osta H. (2016) Epigenetics in non-small cell lung cancer: from basics to therapeutics. Transl. Lung Cancer Res. 5, 155–171 [DOI] [PMC free article] [PubMed] [Google Scholar]
- 21. Berdasco M., and Esteller M. (2010) Aberrant epigenetic landscape in cancer: how cellular identity goes awry. Dev. Cell 19, 698–711 [DOI] [PubMed] [Google Scholar]
- 22. Hamm C. A., and Costa F. F. (2015) Epigenomes as therapeutic targets. Pharmacol. Ther. 151, 72–86 [DOI] [PubMed] [Google Scholar]
- 23. Zöchbauer-Müller S., Fong K. M., Virmani A. K., Geradts J., Gazdar A. F., and Minna J. D. (2001) Aberrant promoter methylation of multiple genes in non-small cell lung cancers. Cancer Res. 61, 249–255 [PubMed] [Google Scholar]
- 24. Weichert W. (2009) HDAC expression and clinical prognosis in human malignancies. Cancer Lett. 280, 168–176 [DOI] [PubMed] [Google Scholar]
- 25. Valente S., Trisciuoglio D., Tardugno M., Benedetti R., Labella D., Secci D., Mercurio C., Boggio R., Tomassi S., Di Maro S., Novellino E., Altucci L., Del Bufalo D., Mai A., and Cosconati S. (2013) tert-Butylcarbamate-containing histone deacetylase inhibitors: apoptosis induction, cytodifferentiation, and antiproliferative activities in cancer cells. ChemMedChem 8, 800–811 [DOI] [PubMed] [Google Scholar]
- 26. Valente S., Trisciuoglio D., De Luca T., Nebbioso A., Labella D., Lenoci A., Bigogno C., Dondio G., Miceli M., Brosch G., Del Bufalo D., Altucci L., and Mai A. (2014) 1,3,4-Oxadiazole-containing histone deacetylase inhibitors: anticancer activities in cancer cells. J. Med. Chem. 57, 6259–6265 [DOI] [PubMed] [Google Scholar]
- 27. Nakayama F., Semba S., Usami Y., Chiba H., Sawada N., and Yokozaki H. (2008) Hypermethylation-modulated downregulation of claudin-7 expression promotes the progression of colorectal carcinoma. Pathobiology 75, 177–185 [DOI] [PubMed] [Google Scholar]
- 28. Agarwal R., Mori Y., Cheng Y., Jin Z., Olaru A. V., Hamilton J. P., David S., Selaru F. M., Yang J., Abraham J. M., Montgomery E., Morin P. J., and Meltzer S. J. (2009) Silencing of claudin-11 is associated with increased invasiveness of gastric cancer cells. PLoS ONE 4, e8002. [DOI] [PMC free article] [PubMed] [Google Scholar]
- 29. Di Cello F., Cope L., Li H., Jeschke J., Wang W., Baylin S. B., and Zahnow C. A. (2013) Methylation of the claudin 1 promoter is associated with loss of expression in estrogen receptor positive breast cancer. PLoS ONE 8, e68630. [DOI] [PMC free article] [PubMed] [Google Scholar]
- 30. Memmott R. M., and Dennis P. A. (2009) Akt-dependent and -independent mechanisms of mTOR regulation in cancer. Cell. Signal. 21, 656–664 [DOI] [PMC free article] [PubMed] [Google Scholar]
- 31. Schnermann J., Huang Y., and Mizel D. (2013) Fluid reabsorption in proximal convoluted tubules of mice with gene deletions of claudin-2 and/or aquaporin1. Am. J. Physiol. Renal Physiol. 305, F1352–1364 [DOI] [PMC free article] [PubMed] [Google Scholar]
- 32. Wada M., Tamura A., Takahashi N., and Tsukita S. (2013) Loss of claudins 2 and 15 from mice causes defects in paracellular Na+ flow and nutrient transport in gut and leads to death from malnutrition. Gastroenterology 144, 369–380 [DOI] [PubMed] [Google Scholar]
- 33. Patonai A., Erdélyi-Belle B., Korompay A., Somorácz A., Straub B. K., Schirmacher P., Kovalszky I., Lotz G., Kiss A., and Schaff Z. (2011) Claudins and tricellulin in fibrolamellar hepatocellular carcinoma. Virchows Arch. 458, 679–688 [DOI] [PubMed] [Google Scholar]
- 34. Song X., Li X., Tang Y., Chen H., Wong B., Wang J., and Chen M. (2008) Expression of claudin-2 in the multistage process of gastric carcinogenesis. Histol. Histopathol. 23, 673–682 [DOI] [PubMed] [Google Scholar]
- 35. Flores A. R., Rêma A., Carvalho F., Faustino A., and Dias Pereira P. (2014) Reduced expression of claudin-2 is associated with high histological grade and metastasis of feline mammary carcinomas. J. Comp. Pathol. 150, 169–174 [DOI] [PubMed] [Google Scholar]
- 36. Kim H. S., Kim G. Y., Lim S. J., and Kim Y. W. (2012) Expression of the mammalian target of rapamycin pathway markers in lung adenocarcinoma and squamous cell carcinoma. Pathobiology 79, 84–93 [DOI] [PubMed] [Google Scholar]
- 37. Tang X., Liu D., Shishodia S., Ozburn N., Behrens C., Lee J. J., Hong W. K., Aggarwal B. B., and Wistuba I. I. (2006) Nuclear factor-κB (NF-κB) is frequently expressed in lung cancer and preneoplastic lesions. Cancer 107, 2637–2646 [DOI] [PubMed] [Google Scholar]
- 38. Meylan E., Dooley A. L., Feldser D. M., Shen L., Turk E., Ouyang C., and Jacks T. (2009) Requirement for NF-κB signalling in a mouse model of lung adenocarcinoma. Nature 462, 104–107 [DOI] [PMC free article] [PubMed] [Google Scholar]
- 39. Phuong N. T., Kim S. K., Lim S. C., Kim H. S., Kim T. H., Lee K. Y., Ahn S. G., Yoon J. H., and Kang K. W. (2011) Role of PTEN promoter methylation in tamoxifen-resistant breast cancer cells. Breast Cancer Res. Treat. 130, 73–83 [DOI] [PubMed] [Google Scholar]
- 40. Van Den Broeck A., Brambilla E., Moro-Sibilot D., Lantuejoul S., Brambilla C., Eymin B., Khochbin S., and Gazzeri S. (2008) Loss of histone H4K20 trimethylation occurs in preneoplasia and influences prognosis of non-small cell lung cancer. Clin. Cancer Res. 14, 7237–7245 [DOI] [PubMed] [Google Scholar]
- 41. Barlési F., Giaccone G., Gallegos-Ruiz M. I., Loundou A., Span S. W., Lefesvre P., Kruyt F. A., and Rodriguez J. A. (2007) Global histone modifications predict prognosis of resected non small-cell lung cancer. J. Clin. Oncol. 25, 4358–4364 [DOI] [PubMed] [Google Scholar]
- 42. Buurman R., Gürlevik E., Schäffer V., Eilers M., Sandbothe M., Kreipe H., Wilkens L., Schlegelberger B., Kühnel F., and Skawran B. (2012) Histone deacetylases activate hepatocyte growth factor signaling by repressing microRNA-449 in hepatocellular carcinoma cells. Gastroenterology 143, 811–820 [DOI] [PubMed] [Google Scholar]
- 43. Sampath D., Liu C., Vasan K., Sulda M., Puduvalli V. K., Wierda W. G., and Keating M. J. (2012) Histone deacetylases mediate the silencing of miR-15a, miR-16, and miR-29b in chronic lymphocytic leukemia. Blood 119, 1162–1172 [DOI] [PMC free article] [PubMed] [Google Scholar]
- 44. Yang G., Xiong G., Cao Z., Zheng S., You L., Zhang T., and Zhao Y. (2016) miR-497 expression, function and clinical application in cancer. Oncotarget 7, 55900–55911 [DOI] [PMC free article] [PubMed] [Google Scholar]
- 45. Zhao W. Y., Wang Y., An Z. J., Shi C. G., Zhu G. A., Wang B., Lu M. Y., Pan C. K., and Chen P. (2013) Downregulation of miR-497 promotes tumor growth and angiogenesis by targeting HDGF in non-small cell lung cancer. Biochem. Biophys. Res. Commun. 435, 466–471 [DOI] [PubMed] [Google Scholar]
- 46. Li D., Zhao Y., Liu C., Chen X., Qi Y., Jiang Y., Zou C., Zhang X., Liu S., Wang X., Zhao D., Sun Q., Zeng Z., Dress A., Lin M. C., et al. (2011) Analysis of MiR-195 and MiR-497 expression, regulation and role in breast cancer. Clin. Cancer Res. 17, 1722–1730 [DOI] [PubMed] [Google Scholar]
- 47. Guo J., Miao Y., Xiao B., Huan R., Jiang Z., Meng D., and Wang Y. (2009) Differential expression of microRNA species in human gastric cancer versus non-tumorous tissues. J. Gastroenterol. Hepatol. 24, 652–657 [DOI] [PubMed] [Google Scholar]
- 48. Guo S. T., Jiang C. C., Wang G. P., Li Y. P., Wang C. Y., Guo X. Y., Yang R. H., Feng Y., Wang F. H., Tseng H. Y., Thorne R. F., Jin L., and Zhang X. D. (2013) MicroRNA-497 targets insulin-like growth factor 1 receptor and has a tumour suppressive role in human colorectal cancer. Oncogene 32, 1910–1920 [DOI] [PMC free article] [PubMed] [Google Scholar]
- 49. Han Z., Zhang Y., Yang Q., Liu B., Wu J., Zhang Y., Yang C., and Jiang Y. (2015) miR-497 and miR-34a retard lung cancer growth by co-inhibiting cyclin E1 (CCNE1). Oncotarget 6, 13149–13163 [DOI] [PMC free article] [PubMed] [Google Scholar]


