Abstract
Purpose
To determine alteration in left ventricular (LV) myocardial stiffness (MS) with hypertension (HTN). Cardiac magnetic resonance elastography (MRE) was used to estimate MS in HTN induced pigs and MRE-derived MS measurements were compared against LV pressure, thickness and circumferential strain.
Materials and Methods
Renal-wrapping surgery was performed to induce HTN in 8 pigs. LV catheterization (to measure pressure) and cardiac MRI (1.5T; gradient echo-MRE and tagging) was performed pre-surgery at baseline (Bx), and post-surgery at month 1 (M1) and month 2 (M2). Images were analyzed to estimate LV-MS, thickness and circumferential strain across the cardiac cycle. The associations between end-diastolic (ED) and end-systolic (ES) MS and i) mean LV pressure; ii) ED and ES thickness respectively; and iii) circumferential strain were evaluated using Spearman’s correlation method.
Results
From Bx to M2, mean pressure, MRE-derived stiffness, and thickness increased while circumferential strain decreased significantly (slope test, p≤0.05). Both ED and ES MS had significant positive correlation with i) mean pressure (ED MS: ρ =0.56; p=0.005 and ES MS: ρ =0.45; p=0.03); ii) ED thickness (ρ =0.73; p<0.0001) and ES thickness (ρ =0.84; p<0.0001) respectively; but demonstrated a negative trend with circumferential strain (ED MS: ρ =0.31 and ES MS: ρ =0.37).
Conclusion
This study demonstrated that in HTN porcine model, MRE-derived MS increased with increase in pressure and thickness.
Keywords: Myocardial Stiffness, Magnetic Resonance Elastography, Hypertension, Cardiac MRE, Left Ventricular Hypertrophy
INTRODUCTION
Hypertension (HTN) is currently one of the major contributing factors of cardiovascular diseases in the US (1). HTN is associated with different cardiac structural and functional changes such as left ventricular (LV) hypertrophy (LVH), left atrial and aortic root enlargement, LV dysfunction and prolonged ventricular repolarization (2,3). Among these different manifestations of HTN, LVH is the most prevalent and is associated with an increased risk of cardiac morbidity and mortality (4,5). Hypertensive LVH is affected primarily by two pathological processes, i) myocyte hypertrophy, and ii) progressive accumulation of fibrous tissue within the cardiac interstitium (6,7). This accumulation of fibrous tissue results in distortion of myocardial tissue structure, which in turn increases myocardial stiffness (MS) (3) and if uncontrolled can lead to severe diastolic dysfunction which can eventually trigger heart failure (8–10). Therefore, quantifying MS may assist in the diagnosis, treatment planning, and monitoring of hypertensive patients that can potentially prevent the onset of heart failure.
Passive LV MS can be measured clinically using LV catheter-based pressure-volume loops (11). However, catheterization is an invasive procedure, provides only a global measurement of chamber stiffness and does not estimate the mechanical properties of the myocardium. Currently, non-invasive surrogates such as tissue Doppler-echocardiography based on mitral inflow velocity is used to evaluate MS (12). However, Doppler-echocardiography does not provide information about the true intrinsic properties of the underlying tissue (13). Therefore, there exists a need for an alternate non-invasive technique to estimate MS in HTN patients.
Recently, with the advent of cardiac magnetic resonance elastography (MRE), a phase-contrast based MRI technique, non-invasive quantification of MS has become feasible (14–17). Previously, this technique has been used in a porcine animal model to estimate end-diastolic (ED) stiffness with increase in ED pressure (18). Additionally, this technique has also been implemented in patients with diastolic dysfunction, to show that MRE-derived shear wave amplitudes are significantly lower in patients compared to healthy volunteers (16).
The aims of this study are to exploit MRE in a well-established HTN porcine model to: 1) estimate temporal variation in LV MS; 2) validate LV MS measurements against invasive pressure measurements; and 3) compare LV MS measurements to changes in LV thickness, and LV circumferential strain with disease progression over a 2 month period.
MATERIALS AND METHODS
Eight juvenile Yorkshire pigs (serially studied at three time-points, i.e. n=24) weighing ~70lbs were used in this study. The study was performed in accordance with the university’s institutional animal care and use committee guidelines.
HTN Animal Procedure
The animals underwent renal wrapping surgery which is known to induce chronic systemic arterial hypertension, leading to LVH (19,20). The animals were placed in supine position on the surgery table and pre-operative Bupivicaine (0.5%, dosage: 3–5 ml) was injected into the incision site. Renal wrapping surgery was performed via a midline abdominal incision. Both the kidneys were cleared of perinephric fat and wrapped snugly with sterile umbilical tape without constricting the renal vessel (21). The abdominal wall was then closed in multiple layers using absorbable sutures. Post-operative analgesia consisted of a dose of buprenorphine (0.3 mg/ml, dosage: 0.005–0.02 mg/kg) and a fentanyl transdermal patch (100 mcg/hr/72hrs).
MR Imaging Timeline
MR imaging was performed on all the animals at baseline (Bx) prior to surgery, and then repeated approximately after one month (M1) and two months (M2) post-surgery with the imaging parameters (detailed later) remaining same for all time points. These two post-operative time points were specifically selected as described elsewhere (21,22).
LV-pressure Measurements
Prior to each MRI scan LV catheterization was performed under fluoroscopy (OEC 9800, General Electric, USA) to record LV-pressure continuously using a bridge-amplifier (FE221, ADInstruments, USA) and Power Lab (PL3508, ADInstruments, USA). At the same time ECG was recorded using a Bio-amplifier (FE136, ADInstruments, USA).
Animal Preparation for MR Imaging
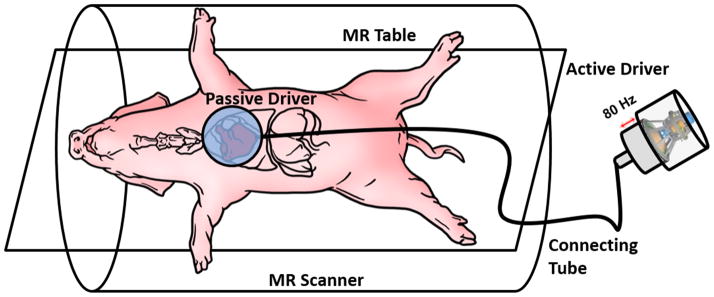
MR imaging was performed in a 1.5T MRI scanner (Avanto, Siemens Healthcare, Germany). The animals were placed feet-first supine in the scanner. Both sets of limbs were secured to the scanner table using surgical tapes to prevent involuntary motion. Taping the forelimbs in this manner further exposed the pig’s chest which assisted in placing the passive driver and ECG leads. Additionally multiple sand bags were placed on either side of the animal to prevent it from rolling over. A custom-built driver system was used to induce external vibrations into the heart as shown in Figure 1 for performing MRE (15). Anesthesia was induced using ketamine (20mg/kg) and acepromazine (0.5mg/kg) and maintained using isoflurane (1–5%). Isoflurane is a well-accepted anesthetic agent for use in porcine research models. At higher concentrations, isoflurane can decrease heart rate and cardiac output. However, the depth of anesthesia was closely monitored during the experiments to avoid these effects. The depth of anesthesia was adjusted to prevent spontaneous respiration during breath-holds without depressing the heart rate. If the dose increased during an experiment, the amount of anesthesia was reduced, and all scans would be paused to allow the heart rate to recover; once the heart rate was recovered, scanning was resumed.
Figure 1. Experimental Set-Up.
The animal is placed feet-first supine on the MR table. A custom built passive driver is positioned externally on the animal’s anterior chest wall right above the heart. A custom made active pneumatic driver that is placed outside the scanner room generates acoustic waves and transmits it to the passive driver via a plastic connecting tube.
Image Acquisition
Cardiac triggered i) cine scouts, ii) MRE (14), and iii) spatial modulation of magnetization (SPAMM) tagging sequences were implemented to acquire short-axis views of the heart using imaging parameters detailed below.
Balanced steady-state free precession cine sequence was implemented to acquire vertical, horizontal long-axis views (4 slices at 45°) and short-axis views (12–16 slices based on the size of the heart) covering the heart. The cine images were used to plan the rest of the scans. Imaging parameters for cine imaging included: echo time (TE)/repetition time (TR)=1.49/27.36 ms; field of view=300×300 mm2; imaging matrix=256×256; slice thickness=6mm; flip angle=46°; cardiac phases=30; GRAPPA acceleration factor=2.
Retrospective pulse-gated, segmented multi-phase gradient recalled echo MRE sequence was used to obtain short-axis slices covering the entire LV (number of slices varied from 5–7 based on the size of the heart) (14). Imaging parameters for MRE included: TE/TR=9.71/12.5 ms; field of view=384×384 mm2; imaging matrix=128×128; slice thickness=8mm; flip angle=15°; number of segments=8 (positive and negative encoding); cardiac phases=8; GRAPPA acceleration factor =2; excitation frequency=80Hz; phase offsets=4; and 160Hz flow compensated motion encoding gradients were applied separately in all three directions to encode the in plane and through plane external motion. The breath-hold time was ~20secs/slice for each encoding direction, which varied based on the heart rate.
SPAMM tagging (23) was performed to analyze the change in myocardial circumferential strain with disease progression. A prospectively gated GRE based SPAMM tagging sequence was used to acquire the short-axis view of a single mid-ventricular slice with the following imaging parameters: TE/TR=3.42/19.47 ms; field of view=300×300 mm2; imaging matrix=224×168; slice thickness=8mm; flip angle=8°; and cardiac phases=25;
Image Analysis
In-vivo Pressure Measurements
LV-pressure and ECG signal were continuously recorded as mentioned earlier. Post data acquisition, end-systolic (ES) and ED points on the ECG signal was identified, and the corresponding values on the pressure-loop (acquired simultaneously with ECG) were recorded to determine the ES and ED pressure measurements, respectively. This was repeated for three different R-R intervals and the average from the three measurements were used to estimate the mean ES and ED LV-pressure. Finally, the mean LV-pressure was calculated using Eq-1.
| (1) |
LV-thickness
A mid-ventricular slice was selected from the MRE magnitude images at Bx, M1, and M2, and epicardial and endocardial contours were dawn. Visual inspection was performed to ensure that the mid-ventricular slice was same across the three time points (Bx, M1 and M2). Based on the contours, epicardial and endocardial LV diameter and thickness were calculated in Matlab (Mathworks, MA, USA) for each cardiac phase. The phases corresponding to the minimum and maximum thickness were identified for ES and ED thickness measurements, respectively. These same phases were selected to report ES stiffness and ED stiffness (detailed below).
MRE
MRELab (Mayo Clinic, Rochester, MN, USA) was used to process the wave images to obtain the stiffness maps. The wave images were masked to extract the LV and temporally Fourier transformed to obtain the first harmonic displacement field. Then the reflected waves were removed using a directional-filter in 8 radial directions (24). Next, a 4th order Butterworth band-pass filter with cutoffs 0.384 m/FOV to 0.0096 m/FOV was used to remove the longitudinal component of motion. The filtered displacement data in all directions was then inverted using a 3D local frequency estimation algorithm (14,25) and a weighted stiffness maps (26) were obtained for all the slices. The stiffness maps were then loaded in Matlab and the 3D mean stiffness and standard deviation (SD) from all the slices across the 8 cardiac phases at Bx, M1 and M2 were reported. Before calculating the mean stiffness, regions with poor wave propagation was excluded from the stiffness maps based on visual inspection by an observer (AK: 12 years’ experience). Phases corresponding to maximum and minimum thickness were selected to report the ES and ED stiffness measurements.
Circumferential Strain
Images obtained from SPAMM tagging were analyzed using HARP (Diagnosoft, CA, USA). Epicardial and endocardial contours were drawn on the ES cardiac phase and circumferential Eulerian strain was calculated for six different cardiac segments. The mean strain was reported for Bx, M1, and M2.
Statistical Analysis
Statistical analysis was performed using SAS9.4 (SAS Inc., NC, USA). All measured parameters were compared against ES and ED MS. Anderson-Darling’s test was performed on each parameter (mean LV-pressure, ED and ES stiffness and thickness, and circumferential strain) to check for normality. Since all the parameters were measured for each subject across three time-points (Bx, M1, and M2), those parameters that passed the normality test were analyzed using mixed-effects models. A mixed-effects model accounts for observational dependencies for each subject and allows for subject specific intercepts and slopes (27). The time-point for the each measured parameter was included as a fixed-effects component with three levels corresponding to Bx, M1, and M2; and MS (ES or ED) was added as a covariate. Spearman’s rank correlation coefficients were used to describe the association between LV MS (ES, ED) and i) mean LV-pressure, ii) LV-thickness (ED and ES), iii) circumferential strain. A p-value ≤0.05 was used to test for statistical significance.
RESULTS
LV-pressure
The range and mean LV-pressure from all the animals at Bx, M1, and M2 were ([21.8–43.6]; 33.5) mmHg, ([22.0–53.5]; 40) mmHg and ([34.6–61.3]; 49.9) mmHg, respectively. From Bx to M1 mean LV-pressure dropped in one pig, but in general demonstrated an increasing slope (slope=6.5). However this increase was not significant (p=0.1734). From M1 to M2 although the mean LV-pressure showed a slight decrease in 3 pigs, overall across all animals mean LV-pressure increased significantly (slope=10.0; p=0.05). Overall, from Bx to M2 all animals demonstrated a significant positive slope in mean LV-pressure (slope=16.5; p=0.0027) confirming the development of hypertension.
LV-Thickness
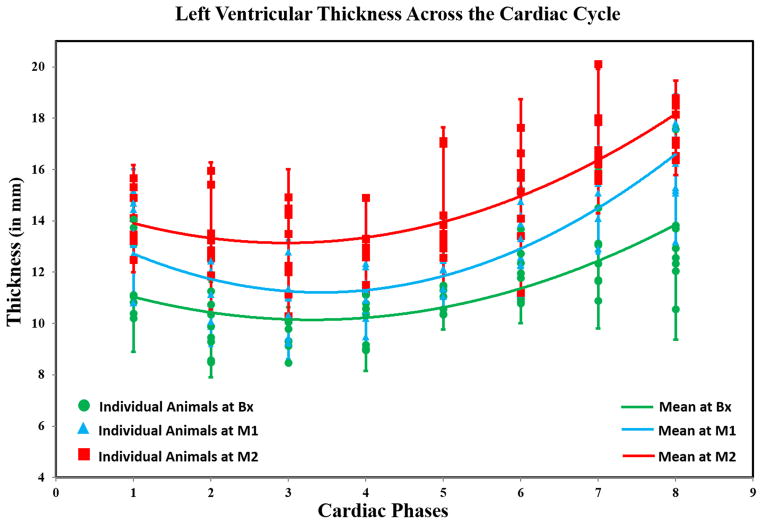
Figure 2 shows LV-thickness vs cardiac cycle with disease progression. A quadratic function was used to fit the mean thickness (pooling all animals) across the cardiac cycle. The quadratic fit values at Bx (R2=0.94), M1 (R2=0.92), and M2 (R2=0.81) indicate good fit of mean curves. Based on the mean curves, it can be concluded that LV-thickness increased from Bx toM2 affirming that the animals developed LVH.
Figure 2. Mean LV Thickness as a Function of the Cardiac Cycle on a Mid-Ventricular Slice from all Animals.
Marker-shapes correspond to imaging time-points. The plot shows that mean LV-thickness increased progressively from Bx (green-curve; R2=0.94) to M1 (blue-curve; R2=0.92) to M2 (red-curve; R2=0.81) indicating that the animals developed LV hypertrophy over time.
The mean and standard deviation (SD) of the ED thickness at Bx, M1, and M2 were 9.1±0.6 mm, 10.4±0.8 mm, and 12.3±1.3 mm, respectively. The mean±SD of the ES thickness at Bx, M1, and M2 were 13.7±1.8 mm, 16.0±1.5 mm, and 17.8±1.2 mm, respectively. In general there was a significant increase in LV thickness at both ED thickness (slope=3.24, p<0.0001) and ES thickness (slope=4.14, p=0.0001) from Bx to M2. Moreover, comparison at each time point with its prior time point showed similar results, i.e., both the ED and ES thickness increased significantly from Bx to M1 (p(ED)=0.02, p(ES)=0.01) and from M1 to M2 (p(ED)=0.002, p(ES)=0.03).
MRE
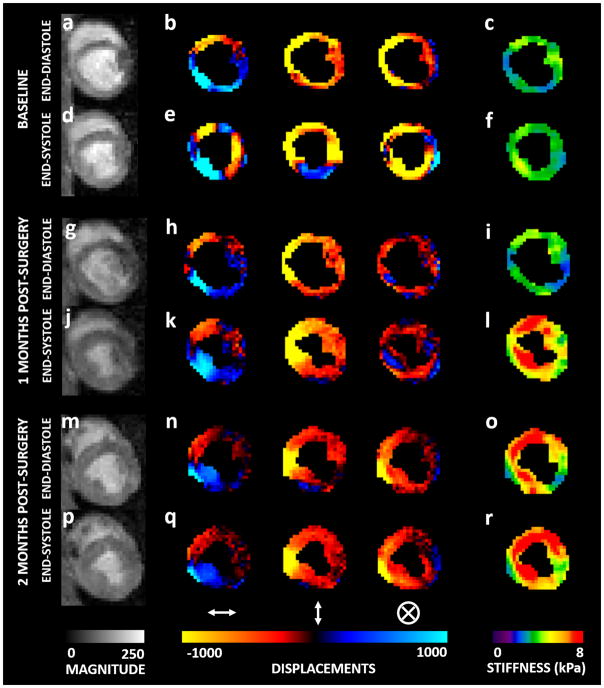
Figure 3 shows ES and ED magnitude image, 4 phase-offsets of the propagating wave encoded in the x-direction, and the corresponding stiffness maps at Bx and M2. The stiffness maps demonstrated that ED and ES LV MS were higher at M2 compared to Bx.
Figure 3. MRE Data.
Bx:- (a) & (d); M1:- (g) & (j); M2:- (m) & (p) Magnitude image (mid-ventricular slice) at ED and ES, respectively. Bx:- (b) & (e); M1:- (h) & (k); M2:- (n) & (q) Wave propagation at ED and ES, respectively in x, y and z directions. Bx:- (c) & (f); M1:- (i) & (l); M2:- (o) & (r) Stiffness maps at ED and ES, respectively. The maps demonstrate that ES stiffness is higher than ED stiffness; and stiffness at M2 is higher than stiffness at M1 which is higher than stiffness at M2.
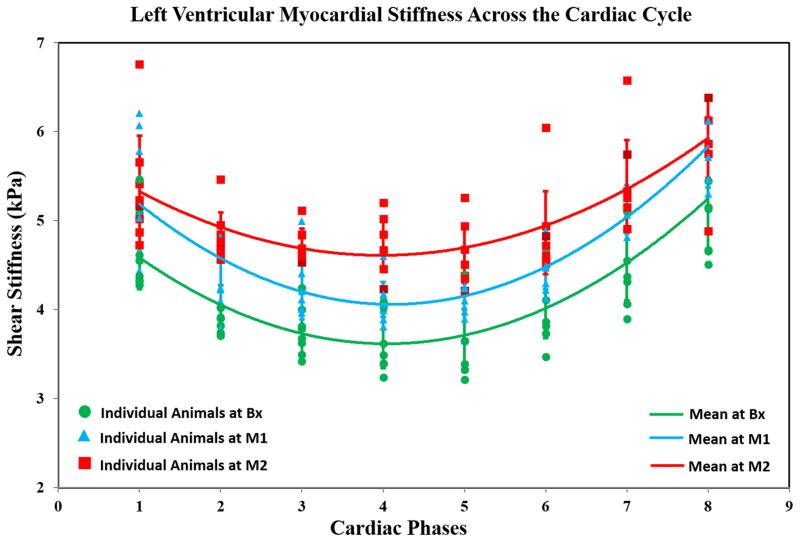
Figure 4 shows LV MS vs cardiac cycle with disease progression. A quadratic function was used to fit the mean variation (from all animals) in LV stiffness. The quadratic fit values at Bx (R2=0.99), M1 (R2=0.97), and M2 (R2=0.97) demonstrated an excellent fit. Based on the mean curves at Bx, M1, and M2, it can be concluded that mean LV MS increased progressively from Bx toM2, indicating that induced hypertension increased LV MS.
Figure 4. Mean LV Stiffness (all Slices) as a Function of the Cardiac Cycle.
Marker-shapes correspond to imaging time-points. The plot shows that the mean LV stiffness at Bx (green-curve; R2=0.99) is lower compared to M1 (blue-curve; R2=0.97) which is lower compared to M2 (red-curve; R2=0.97) indicating that LV compliance was compromised with prolonged hypertension.
LV ED and ES MS
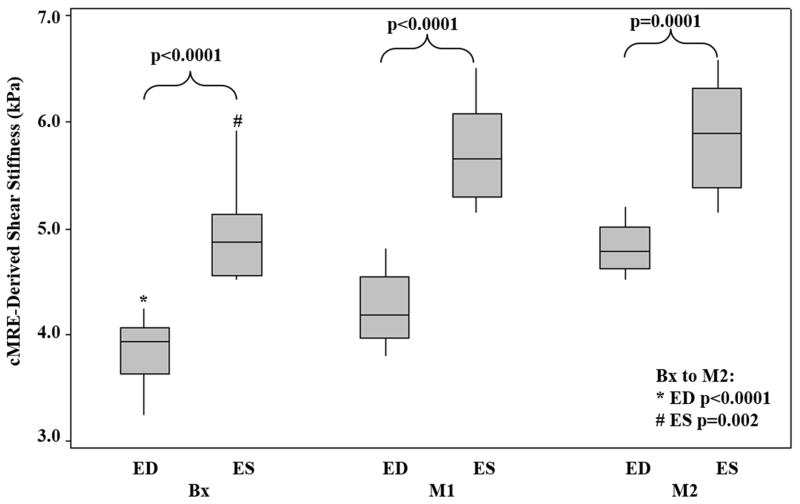
The mean±SD for ED MS at Bx, M1, and M2 were 3.84±0.4 kPa, 4.24±0.3 kPa and, 4.82±0.2 kPa, respectively. The mean±SD for ES MS at Bx, M1, and M2 were 4.94±0.5 kPa, 5.70±0.5 kPa and, 5.88±0.5 kPa, respectively (Figure 5). Slope analysis from Bx to M2 indicated that as the disease progressed, mean LV MS increased significantly for both ED (slope=0.98; p<0.0001) and ES (slope=0.94; p=0.002). While ED MS demonstrated a significant increase from Bx to M1 (difference=0.40; p=0.02) and M1 to M2 (difference=0.58; p=0.002), but ES MS did not. ES MS only showed a significant increase from Bx to M1 (difference=0.76; p=0.007) but non-significant increase from M1 to M2 (difference=0.12; p=0.47).
Figure 5. Box-plot of ED and ES Stiffness.
The plot shows that ES stiffness was significantly higher than ED stiffness (Bx to M2: p (ED)<0.0001; p (ES)=0.002). The mean stiffness at Bx, M1 and M2 for ED is 3.84±0.4, 4.24±0.3, and 4.82±0.2, and for ES is 4.94±0.5, 5.70±0.5, and 5.88±0.5, respectively.
Correlation between LV MS and Pressure and Thickness
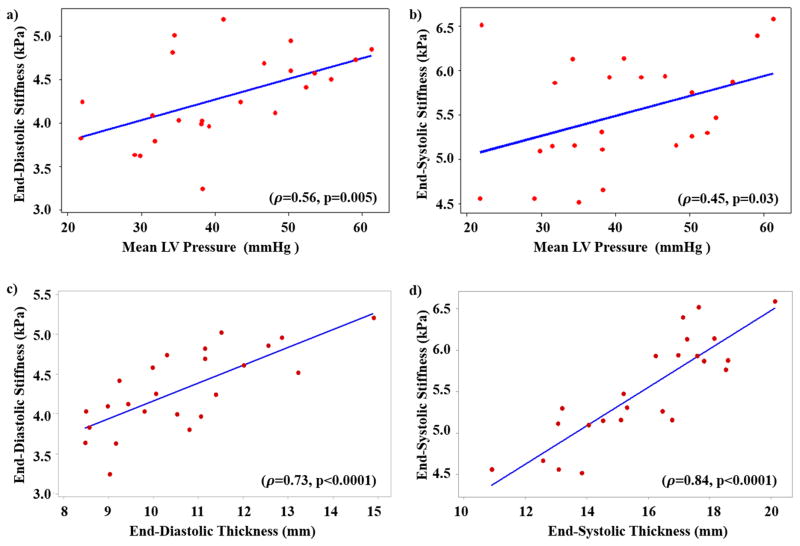
Figure 6a and 6b shows correlation between ED, ES MS and mean LV-pressure, respectively. Similarly, Figure 6c and 6d shows correlation between ED MS and ED thickness, ES MS and ES thickness, respectively. A significant positive correlation was observed between mean LV-pressure and LV ED MS (ρ =0.56; p=0.005) and ES MS (ρ =0.45; p=0.03). Additionally, both LV ED and ES MS had significant strong positive correlation with ED thickness (ρ =0.73; p<0.0001) and ES thickness (ρ =0.84; p<0.0001).
Figure 6. Spearman’s Correlation.
Correlation between a) ED LV stiffness and mean LV-pressure; b) ES LV MS and mean LV-pressure demonstrated good correlation (ρ ≥0.5). A strong correlation (ρ >0.7) is observed between c) ED LV stiffness and ED LV thickness; d) ES LV stiffness and mean ES LV thickness.
Circumferential Strain
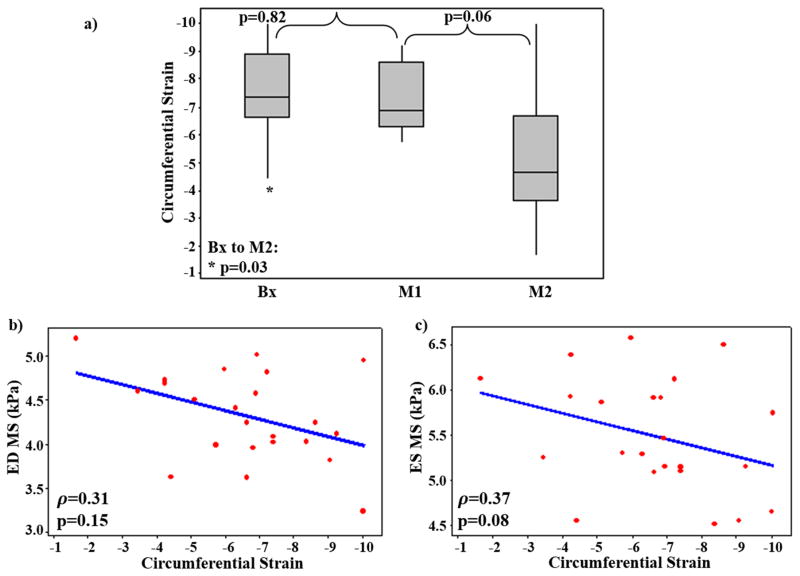
The mean±SD of the LV Eulerian circumferential strain at Bx, M1, and M2 was −7.49±1.61, −7.26±1.16, and −5.21±2.36, respectively (Figure 7a). Circumferential LV strain decreased significantly (slope=2.28; p=0.03) from Bx to M2, while the decrease between subsequent time-points was not significant. The Spearman’s correlation between circumferential LV strain and LV ED and ES MS demonstrated that circumferential strain had a moderate negative correlation with both ED (ρ =0.31) and ES (ρ =0.37) LV MS, however the correlation was not significant (p(ED)=0.15 and p(ES)= 0.08) (Figure 7b and 7c).
Figure 7. LV Circumferential Strain Analysis.
a) Box plot showing circumferential strain at Bx, M1, and M2 demonstrating significant decrease from Bx to M2. Spearman’s correlation between circumferential strain and b) ED stiffness, c) ES stiffness demonstrating non-significant moderate negative correlation (ρ >0.3).
DISCUSSION
This study demonstrated the feasibility of using cardiac MRE to determine changes in MS in a well-established HTN model. Our findings indicated that mean LV-pressure, LV-thickness and MRE-derived MS increased significantly with disease progression. Furthermore, both mean LV-pressure and LV-thickness had good correlation with ED and ES MRE-derived LV MS, indicating that LVH secondary to hypertension caused increase in MS. Circumferential LV strain decreased at M2 and showed moderate negative correlation when compared to MS. Therefore, this study demonstrates the potential of using MRE as a non-invasive tool for the assessment of disease conditions that are potential predecessors to heart failure.
LV-pressure
Previous MRE studies in porcine models have shown that invasive pressure measurements strongly correlate with MS (15) and MRE-derived shear wave amplitudes (28). Similar correlation of MS with increasing mean LV-pressure was observed confirming that change in pressure is related to change in LV MS. Although, despite increase in stiffness from Bx-M2 in an animal, the pressure decreased from Bx-M1. Nevertheless, we suspect that the drop in pressure could be physiological response of the animal to anesthesia or can be associated with any calibration error in pressure measurements at M1. However, an increase in pressure was observed in the same animal from Bx-M2. Overall, this study validated MRE-derived stiffness against change in invasive pressure measurements during disease progression in a HTN porcine model.
LV Thickness
Our results demonstrated that LV thickness increased throughout the cardiac cycle with disease progression, indicating the animals developed LVH. It is well known that LVH secondary to hypertension reduces LV compliance, leading to diastolic dysfunction (20). This association between LVH (induced by hypertension) and LV compliance was reflected with an increase in MS that had a strong positive correlation with LV thickness. It is important to note that all kinds of LVH are not related to increase in MS. LVH can be induced either due to physiological remodeling or pathological remodeling. Physiological remodeling occurs as a physiological adaptation to an increased workload of the heart following intense physical training (29); on the other hand, pathological remodeling occurs as a response to a pathophysiological condition such as hypertension or valvular disease (29). While pathophysiological remodeling causes increase in MS as seen in this study, it is not true for physiological remodeling (29) and hence just an increase in LV thickness by itself cannot be used as a diagnostic metric.
MRE-Derived MS
The cyclic variation in MS across the cardiac cycle observed in this study is consistent with a previous study (14). Furthermore, as observed earlier (14), ES MS was significantly higher compared to ED MS in all the animals at each time point (Bx, M1, and M2). Additionally, MS did not increase uniformly throughout the cardiac cycle. While a significant increase in ED MS was observed both at M1 and M2, ES MS initially increased significantly (Bx to M1), but over time (i.e. from M1 to M2) the increase became insignificant. This observation could be related to the fact the LVH secondary to HTN is associated with impaired LV relaxation indicating the possibility of developing diastolic dysfunction (22,30). The subdued increase in ES MS could indicate that after the initial surge, the systolic function was being preserved. This is further exemplified from the correlation plots between ED and ES MS and mean LV-pressure which demonstrated higher correlation at ED compared to ES.
Circumferential Strain
HTN induced LVH is associated with reduced circumferential shortening, which is reflected as decreased circumferential strain (lower negative strain values) in this study and also confirmed in an earlier study (31). The negative linear correlation between circumferential strain and ED and ES MS indicates that increased stiffness in this hypertensive LVH model is associated with decreased myocardial deformation. From the trend observed in circumferential strain measurements from Bx to M1 and from M1 to M2 it can be concluded that prolonged hypertension is required to observe severe reduction in strain measurements.
Limitations
There are some limitations in our study. First, the MRE-derived MS considers the myocardium to be an isotropic, homogenous, and infinite medium, which is not true. Hence MS estimates obtained using MRE are termed to be “effective” (14,15). Second, due to limited temporal resolution, it is difficult to capture precise ED and ES cardiac phases. However, minimum and maximum mid-ventricular thickness was used as a measure to select the best approximate ED and ES cardiac phases, respectively. Third, some animals had poor wave propagation in the posterior myocardial wall that was farther from the driver. Poor wave propagation means that there is insufficient wave amplitudes in the region of interest (i.e. low signal-to-noise ratio (SNR)). This can be attributed to many factors such as: 1) poor coupling of passive driver to the chest wall that induces external motion into the heart; 2) distance of region of interest from the driver; and 3) the depth of wave penetration, which is limited by the frequency and the maximum amplitude of the acoustic wave that is generated by the active driver. In three animals, only a small portion of the posterior myocardium in couple of slices (i.e. region away from driver) has poor wave propagation. However, in our study this region was excluded when estimating stiffness. Finally, in one of the animals at M1, the tags were of poor quality, and hence it was excluded from the analysis. Despite these limitations this study demonstrated that MRE-derived MS measurements can potentially be used for timely diagnosis disease conditions that are prone to develop heart failure over time.
In conclusion, MRE-derived MS is validated in a well-established HTN model against invasively obtained mean LV pressure measurements which correlated significantly with LV thickness measurements.
Acknowledgments
Grant Support: This manuscript has been supported by Grant sponsor: American Heart Association; Grant number: 13SDG14690027; Grant sponsor: Center for Clinical and Translational Sciences; Grant number: UL1TR000090; Grant Sponsor: NIH –NHLBI; Grant number: NIH-R01HL124096.
The authors thank the DHLRI Interventional Cardiology Catheterization Core Lab and Joseph Matthew for their help in preparing the animal models. We also thank Siemens Healthcare for supporting this project by providing us with the product sequences.
Footnotes
Disclosure: The authors have nothing to disclose.
References
- 1.Farley TA, Dalal MA, Mostashari F, Frieden TR. Deaths Preventable in the US by Improvements in Use of Clinical Preventive Services. Am J Prev Med. 2010;38(6):600–609. doi: 10.1016/j.amepre.2010.02.016. [DOI] [PubMed] [Google Scholar]
- 2.Frohlich ED, Apstein C, Chobanian AV, et al. Medical Progress - the Heart in Hypertension. New Engl J Med. 1992;327(14):998–1008. doi: 10.1056/NEJM199210013271406. [DOI] [PubMed] [Google Scholar]
- 3.Cuspidi C, Ciulla M, Zanchetti A. Hypertensive myocardial fibrosis. Nephrol Dial Transplant. 2006;21(1):20–23. doi: 10.1093/ndt/gfi237. [DOI] [PubMed] [Google Scholar]
- 4.Koren MJ, Devereux RB, Casale PN, Savage DD, Laragh JH. Relation of left ventricular mass and geometry to morbidity and mortality in uncomplicated essential hypertension. Ann Intern Med. 1991;114(5):345–352. doi: 10.7326/0003-4819-114-5-345. [DOI] [PubMed] [Google Scholar]
- 5.Drazner MH. The progression of hypertensive heart disease. Circulation. 2011;123(3):327–334. doi: 10.1161/CIRCULATIONAHA.108.845792. [DOI] [PubMed] [Google Scholar]
- 6.Rossi MA. Connective tissue skeleton in the normal left ventricle and in hypertensive left ventricular hypertrophy and chronic chagasic myocarditis. Med Sci Monit. 2001;7(4):820–832. [PubMed] [Google Scholar]
- 7.Diez J, Lopez B, Gonzalez A, Querejeta R. Clinical aspects of hypertensive myocardial fibrosis. Curr Opin Cardiol. 2001;16(6):328–335. doi: 10.1097/00001573-200111000-00003. [DOI] [PubMed] [Google Scholar]
- 8.Klotz S, Hay I, Zhang G, Maurer M, Wang J, Burkhoff D. Development of heart failure in chronic hypertensive Dahl rats: focus on heart failure with preserved ejection fraction. Hypertension. 2006;47(5):901–911. doi: 10.1161/01.HYP.0000215579.81408.8e. [DOI] [PubMed] [Google Scholar]
- 9.Gomez A, Unruh H, Mink SN. Altered left ventricular chamber stiffness and isovolumic relaxation in dogs with chronic pulmonary hypertension caused by emphysema. Circulation. 1993;87(1):247–260. doi: 10.1161/01.cir.87.1.247. [DOI] [PubMed] [Google Scholar]
- 10.Borlaug BA, Lam CSP, Roger VL, Rodeheffer RJ, Redfield MM. Contractility and Ventricular Systolic Stiffening in Hypertensive Heart Disease Insights Into the Pathogenesis of Heart Failure With Preserved Ejection Fraction. J Am Coll Cardiol. 2009;54(5):410–418. doi: 10.1016/j.jacc.2009.05.013. [DOI] [PMC free article] [PubMed] [Google Scholar]
- 11.Mirsky I, Pasipoularides A. Clinical assessment of diastolic function. Prog Cardiovasc Dis. 1990;32(4):291–318. doi: 10.1016/0033-0620(90)90018-w. [DOI] [PubMed] [Google Scholar]
- 12.Penicka M, Vanderheyden M, Bartunek J. Diagnosis of heart failure with preserved ejection fraction: role of clinical Doppler echocardiography. Heart (British Cardiac Society) 2014;100(1):68–76. doi: 10.1136/heartjnl-2011-301321. [DOI] [PubMed] [Google Scholar]
- 13.Petrie MC, Hogg K, Caruana L, McMurray JJ. Poor concordance of commonly used echocardiographic measures of left ventricular diastolic function in patients with suspected heart failure but preserved systolic function: is there a reliable echocardiographic measure of diastolic dysfunction? Heart (British Cardiac Society) 2004;90(5):511–517. doi: 10.1136/hrt.2003.011403. [DOI] [PMC free article] [PubMed] [Google Scholar]
- 14.Wassenaar PA, Eleswarpu CN, Schroeder SA, et al. Measuring age-dependent myocardial stiffness across the cardiac cycle using MR elastography: A reproducibility study. Magn Reson Med. 2016;75(4):1586–1593. doi: 10.1002/mrm.25760. [DOI] [PMC free article] [PubMed] [Google Scholar]
- 15.Kolipaka A, Araoz PA, McGee KP, Manduca A, Ehman RL. Magnetic resonance elastography as a method for the assessment of effective myocardial stiffness throughout the cardiac cycle. Magnetic resonance in medicine : official journal of the Society of Magnetic Resonance in Medicine / Society of Magnetic Resonance in Medicine. 2010;64(3):862–870. doi: 10.1002/mrm.22467. [DOI] [PMC free article] [PubMed] [Google Scholar]
- 16.Elgeti T, Knebel F, Hattasch R, Hamm B, Braun J, Sack I. Shear-wave Amplitudes Measured with Cardiac MR Elastography for Diagnosis of Diastolic Dysfunction. Radiology. 2014;271(3):681–687. doi: 10.1148/radiol.13131605. [DOI] [PubMed] [Google Scholar]
- 17.Kolipaka A, Aggarwal SR, McGee KP, et al. Magnetic resonance elastography as a method to estimate myocardial contractility. J Magn Reson Imaging. 2012;36(1):120–127. doi: 10.1002/jmri.23616. [DOI] [PMC free article] [PubMed] [Google Scholar]
- 18.Kolipaka A, McGee KP, Manduca A, Anavekar N, Ehman RL, Araoz PA. In vivo assessment of MR elastography-derived effective end-diastolic myocardial stiffness under different loading conditions. J Magn Reson Imaging. 2011;33(5):1224–1228. doi: 10.1002/jmri.22531. [DOI] [PMC free article] [PubMed] [Google Scholar]
- 19.Holzapfel GAE, Ogden RWE. Biomechanics of soft tissue in cardiovascular systems. Springer; 2003. [Google Scholar]
- 20.Kahan T, Bergfeldt L. Left ventricular hypertrophy in hypertension: its arrhythmogenic potential. Heart (British Cardiac Society) 2005;91(2):250–256. doi: 10.1136/hrt.2004.042473. [DOI] [PMC free article] [PubMed] [Google Scholar]
- 21.Grollman A. A simplified procedure for inducing chronic renal hypertension in the mammal. P Soc Exp Biol Med. 1944;57(1):102–104. [Google Scholar]
- 22.Munagala VK, Hart CY, Burnett JC, Jr, Meyer DM, Redfield MM. Ventricular structure and function in aged dogs with renal hypertension: a model of experimental diastolic heart failure. Circulation. 2005;111(9):1128–1135. doi: 10.1161/01.CIR.0000157183.21404.63. [DOI] [PMC free article] [PubMed] [Google Scholar]
- 23.McVeigh ER, Atalar E. Cardiac tagging with breath-hold cine MRI. Magnetic Resonance in Medicine. 1992;28(2):318–327. doi: 10.1002/mrm.1910280214. [DOI] [PMC free article] [PubMed] [Google Scholar]
- 24.Manduca A, Lake DS, Kruse SA, Ehman RL. Spatio-temporal directional filtering for improved inversion of MR elastography images. Med Image Anal. 2003;7(4):465–473. doi: 10.1016/s1361-8415(03)00038-0. [DOI] [PubMed] [Google Scholar]
- 25.Manduca A, Oliphant TE, Dresner MA, et al. Magnetic resonance elastography: non-invasive mapping of tissue elasticity. Med Image Anal. 2001;5(4):237–254. doi: 10.1016/s1361-8415(00)00039-6. [DOI] [PubMed] [Google Scholar]
- 26.Damughatla AR, Raterman B, Sharkey-Toppen T, et al. Quantification of Aortic Stiffness Using MR Elastography and its Comparison to MRI-Based Pulse Wave Velocity. J Magn Reson Imaging. 2015;41(1):44–51. doi: 10.1002/jmri.24506. [DOI] [PMC free article] [PubMed] [Google Scholar]
- 27.Verbeke G, Molenberghs G. Linear mixed models for longitudinal data. New York; London: Springer; 2000. [Google Scholar]
- 28.Elgeti T, Laule M, Kaufels N, et al. Cardiac MR Elastography: Comparison with left ventricular pressure measurement. J Cardiovasc Magn R. 2009:11. doi: 10.1186/1532-429X-11-44. [DOI] [PMC free article] [PubMed] [Google Scholar]
- 29.Mihl C, Dassen WRM, Kuipers H. Cardiac remodelling: concentric versus eccentric hypertrophy in strength and endurance athletes. Netherlands Heart Journal. 2008;16(4):129. doi: 10.1007/BF03086131. [DOI] [PMC free article] [PubMed] [Google Scholar]
- 30.Conceicao G, Heinonen I, Lourenco AP, Duncker DJ, Falcao-Pires I. Animal models of heart failure with preserved ejection fraction. Neth Heart J. 2016;24(4):275–286. doi: 10.1007/s12471-016-0815-9. [DOI] [PMC free article] [PubMed] [Google Scholar]
- 31.Ahmed MI, Desai RV, Gaddam KK, et al. Relation of torsion and myocardial strains to LV ejection fraction in hypertension. JACC Cardiovascular imaging. 2012;5(3):273–281. doi: 10.1016/j.jcmg.2011.11.013. [DOI] [PMC free article] [PubMed] [Google Scholar]


