

Abstract
The brain depends on a continuous supply of oxygen to maintain its structural and functional integrity. This study measured T1 from MRI under normobaric air, normobaric oxygen, hyperbaric air, and hyperbaric oxygen (HBO) conditions as a marker of tissue pO2 since dissolved molecular oxygen acts as an endogenous contrast agent. Brain tissue T1 decreased corresponding to increased pO2 with increasing inhaled oxygen concentrations, and tissue oxygenation was estimated from the T1 changes between different inhaled oxygen levels. Tissue pO2 difference maps between different oxygen conditions showed heterogeneous pO2 changes in the brain. MRI-derived tissue pO2 was markedly lower than the arterial pO2 but was slightly higher than venous pO2. Additionally, for comparison with published extracellular tissue pO2 data obtained using oxygen electrodes and other invasive techniques, a model was used to estimate extracellular and intracellular pO2 from the MRI-derived mean tissue pO2. This required multiple assumptions, and so the effects of the assumptions and parameters used in modeling brain pO2 were evaluated. MRI-derived pO2 values were strongly dependent on assumptions about the extra- and intracellular compartments but were relatively less sensitive to variations in the relaxivity constant of oxygen and contribution from oxygen in the cerebral blood compartment. This approach may prove useful in evaluating tissue oxygenation in disease states such as stroke.
Keywords: hyperbaric oxygen, MRI, T1, tissue oxygenation
Graphical abstract
1. INTRODUCTION
The brain depends on a continuous and adequate supply of oxygen to maintain its structural and functional integrity. Acute interruption of brain tissue oxygen could lead to loss of consciousness within seconds and irreversible neuronal damage can occur within minutes.1 Chronic mild reduction of brain tissue oxygen tension could result in hypoxic injury and neurodegeneration. Hyperbaric oxygen (HBO) therapy to improve tissue oxygenation has been used to treat stroke, traumatic brain injury, and chronic wounds, among others.2 Prolonged exposure to high levels of oxygen is however harmful. The extent to which tissue oxygenation is modulated under different inhaled oxygen concentrations, especially during hyperbaric conditions, is however not well understood.
Tissue oxygen tension can be measured using reflectance spectrophotometry,3, 4 oxygen-sensitive microelectrodes,5 fluorescence quenching,6 optical and infrared probes,7 electron spin resonance oximetry,8 and 19F magnetic resonance.9 Under normobaric air, most studies reported extracellular oxygen in the brain to be about 20 mmHg although it ranges from 9 to 49 mmHg under different anesthetics and measurement methods.5, 10 Intracellular pO2 measurements are usually made in vitro, and in vivo measurements are sparse. Intracellular pO2 has been reported to be about 5 mmHg in vivo although it also varies over a wide range.11 The above-mentioned methods are invasive and require the implantation or injection of exogenous probes, constituting barriers to human applications.
Oxygen tension can also be measured non-invasively using magnetic resonance imaging by exploiting dissolved molecular oxygen as an endogenous paramagnetic T1 relaxation agent for water protons. Although molecular oxygen is a weak relaxation agent relative to the total cellular milieu that exerts T1 relaxation on water, normobaric oxygen inhalation shortens whole-brain water T1 by 2–7% in rats.12, 13 T1 MRI changes have been used as an index to monitor tissue oxygenation changes via the T1 changes associated with oxygen or carbogen inhalation in tumors.9, 14 In the vitreous where the protein content is low and thus the relaxation contribution from dissolved oxygen is more substantial, the mean vitreous pO2 in humans was found to be 16.7 ± 6.5 mmHg 15 and 13.7 ± 7.8 mmHg 16 using water T1 MRI.
The goal of the present study was to evaluate the feasibility of T1 MRI to measure changes in mean brain tissue pO2 (tpO2) under five different oxygen conditions: normobaric air (NB), hyperbaric air (HB) at 4 atmospheres absolute (ATA), normobaric oxygen (NBO), 3ATA hyperbaric oxygen (HBO), and 4ATA HBO. A model was used to estimate extracellular pO2 for comparison with published experimental data using oxygen electrodes and other invasive techniques. The effects of the assumptions and various parameters used in determining tpO2 were evaluated.
2. MATERIALS AND METHODS
2.1 Estimating brain tissue pO2 from T1
Dissolved molecular oxygen is an endogenous paramagnetic relaxation agent. The relaxation rate constant R1 (R1 = 1/T1) is linearly proportional to the partial pressure of dissolved oxygen. The relation in distilled water at 37° C and 3 Tesla is,15
| [1] |
where the intercept is the intrinsic relaxation rate constant of water. Under ambient air (pO2 of 159 mmHg), the relaxation contribution is relatively small (0.033 s−1) compared to the intrinsic relaxation rate of water. If different relaxation mechanisms that contribute to R1 in vivo are additive, then:
| [2] |
where R1(O2) is the relaxation due to dissolved oxygen and R1(other) includes water’s intrinsic relaxation rate and the relaxation due to all other relaxers in the tissue.
Calculation of tpO2 in vivo from T1 required several major assumptions. (i) We assumed that relaxivity in pure water is the same as in intra- and extracellular tissue water in vivo. This is a reasonable assumption given that molecular oxygen is very small relative to gadolinium complexes, and thus likely to be less affected by viscosity and macromolecules on the tumbling frequencies. Indeed, no significant differences in oxygen relaxivity were observed amongst phosphate buffered saline, 5% bovine serum albumin in phosphate buffered saline, and in vivo blood,17 between buffered saline with and without 0.3 g/L human serum albumin,18 or between balanced salt solution and vitreous samples.16 In contrast, gadolinium agents show enhanced relaxivity in plasma and whole blood compared to water.19 (ii) The oxygen relaxivity is weakly dependent on field strength as summarized in Table 1. The effects of the relaxivity constant on the MRI-derived tpO2 are evaluated in the Results section. (iii) The extracellular and intracellular compartments are assumed to be in the fast exchange limit, so that the average measured T1 is a volume-weighted average of the extra- and intracellular T1 values. Similarly, the extravascular and intravascular compartments are also assumed to be in the fast exchange limit. (iv) The intravascular contribution on tissue T1 and thus pO2 is assumed to be negligible because of its small volume fraction. The effects of blood volume contributions on the MRI-derived tissue pO2 were also evaluated. (v) We presented data as absolute pO2 for comparison with published data in a quantitative manner. This required the assumption of baseline intra-and extracellular pO2 and volume fractions under normobaric air. To model extra- and intracellular pO2 from the mean tpO2, we also assumed the ratio of intra- to extracellular pO2 did not change under the different oxygen conditions. Ranges of these assumed values were evaluated to assess the effects of these assumptions on the MRI-derived pO2.
Table 1.
Relaxivity of oxygen (r1) at different field strengths (B0) and in different samples
| Sample | B0 (T) | r1 (x10−4 s−1/mmHg) | Reference |
|---|---|---|---|
| Saline (with or without 0.3g/L SA)* | 1.5 | 2.7 | Zaharchuk 2005 18 |
| Water | 1.5 | 2.5 | Zaharchuk 2006 33 |
| Saline | 1.5 | 3.6 | Simpson 2013 16 |
| Vitreous | 1.5 | 3.5 | " |
| Water | 3 | 2.1 | Muir 2013 15 |
| Saline (with or without 5% SA)* | 3 | 1.6 | Pilkinton 2012 36 |
| Blood (in vivo) | 3 | 1.6 | " |
| Saline | 4.7 | 2.2 | Matsumoto 2006 43 |
| Blood | 4.7 | 4.1 | Silvennoinen 2003 44 |
Only a single value was reported as the difference between with and without serum albumin (SA) was not significantly different.
2.2 Animal preparation
The animal protocol was approved by the Institutional Animal Care and Use Committee of the University of Texas Health Science Center San Antonio in accordance with the Guide for the Care and Use of Laboratory Animals. All animals were initially anesthetized with 5% isoflurane mixed with room air and maintained under 1.5–2.0% isoflurane for preparations.
Data were collected under five different oxygen conditions: normobaric air (NB), hyperbaric air (HB) at 4ATA, normobaric oxygen (NBO), 3ATA hyperbaric oxygen (HBO), and 4ATA HBO. Three groups of male Sprague-Dawley rats (254–600 g; Charles River Laboratories, O’Fallon, MO, USA) were studied, with NB data acquired in all groups: (i) Data at 4ATA HB and 4ATA HBO were acquired on the same animals under urethane anesthesia (1.5 g/kg, ip, N=7). (ii) 3ATA HBO data were acquired under α-chloralose anesthesia (a bolus of 60 mg/kg I.V. followed by 30 mg/kg/hr after 45 mins, N=4) on a second group of animals. (iii) NBO data were acquired in a third group under 1.2% isoflurane anesthesia (N=5).
All groups were imaged under spontaneous breathing conditions. Respiration rate, heart rate, and arterial oxygen saturation were monitored (MouseOx, STARR Life Science Corp., Oakmont, PA), and rectal temperature was maintained at 37±0.5° C with a feedback-regulated circulating warm water pad. Animals were placed into a head holder with ear and tooth bars.
2.3 Hyperbaric studies
A custom-made hyperbaric chamber for rodent MRI was constructed from PVC pipe with as described previously.20 HBO was achieved using ambient air to pressurize the chamber with a separate line to deliver oxygen locally to the nose. This protocol prevents the risk of explosion associated with highly concentrated oxygen. We previously measured the delivered O2 percentage of our setup to be 90%–93%. Cables for radiofrequency coils and biometric equipment and tubing for intravenous anesthesia were passed into the chamber. The chamber was pressurized over 10 min to prevent potential side effects from rapid pressurization. Sustained HBO exposure was limited to about 25 min, by switching back to air delivery through the line to the nose, to avoid potential O2 toxicity.
2.4 Magnetic resonance imaging
MRI was performed on a 7T magnet with 400 mT/m gradients (Bruker, Billerica, Massachusetts) and with a transmit/receive surface coil (2 cm diameter). Global shimming was only performed once at the beginning of a session and was not repeated under different conditions. T1 was measured using inversion-recovery gradient-echo echo planar imaging with field of view = 25.6×25.6 mm2, matrix = 96×96, seven 1.5 mm thick slices, 2/3 partial Fourier acquisition, echo time = 9.9 ms, and repetition time = 12 s. Data acquired in both groups with hyperbaric conditions used ten inversion times from 23 to 3623 ms equally spaced by 400 ms and 3 signal averages. The data of the NBO group were acquired using the same parameters, except that six inversion times (25, 500, 1000, 2000, 4000, and 8000 ms) and 4 signal averages were used.
2.5 Data analysis
Image analysis was done using Matlab (MathWorks, Natick, MA). T1 maps were calculated using a three-parameter non-linear fit of the data at different inversion times, TI, to the equation M(TI) = M0 – B·M0·exp(-TI/T1), where M(TI) is the signal intensity at a given TI, M0 is the equilibrium signal intensity, and B is the efficiency of the inversion pulse. Average whole brain R1 was measured under each condition.
The mean tpO2 at NB was assumed to be the volume-weighted average of 20 mmHg extracellular pO2 5 with 25% extracellular volume,21, 22 and 7.5 mmHg intracellular pO2,11, 23, 24 giving a value of 10.6 mmHg. This value of tpO2 yielded an R1(O2) of 0.00213 s−1 for NB using an oxygen relaxivity of 2.0×10⁻⁴ s−1/mmHg. The mean tpO2 under other conditions was calculated from adding the tpO2 at NB to the change in tpO2 relative to NB, which was calculated as the difference in R1 relative to NB divided by the oxygen relaxivity. Note that if only change in tpO2 is desired, such assumption of basal tissue pO2 is not necessary. Maps of tpO2 changes amongst different inhaled oxygen conditions were calculated to evaluate the spatial heterogeneity of the tpO2 maps.
T1 MRI data provided mean tpO2 (average of all tissue compartments). We further modeled the intracellular and extracellular pO2 for comparison with published pO2 literatures which mostly reported extracellular pO2. The extracellular and intracellular pO2 were calculated from the measured mean tpO2 using assumed volume fractions and ratio of extra- to intracellular pO2. We varied this ratio by varying extracellular and intracellular independently over physiological ranges. Comparisons were made with reported extracellular pO2 as a function of inhaled pO2 concentrations from the published literature using invasive techniques. Comparisons were also made with published arterial and venous pO2.
To evaluate the possible effects on calculated pO2 with respect to the assumptions made, MRI-derived pO2 was modeled over ranges of physiological extracellular pO2, intracellular pO2, and extracellular volume fraction, while keeping one of the three parameters fixed at a time. We also simulated the effects of the relaxivity constant and blood volume fraction on tissue pO2. To evaluate the intravascular contribution, we assumed blood consisted of 30% arterial blood and 70% venous blood,25, 26 with the extracellular volume fraction reduced proportionally to account for the total blood volume fraction. Values of blood pO2 at NB, 4ATA HB, NBO, 3ATA HBO, and 4ATA HBO were estimated from the literature with arterial pO2 as 90, 500, 550, 1900, and 2600 mmHg, 27–31 and cerebral venous pO2 as 40, 47, 50, 74, and 100 mmHg. 30,31
2.6 Statistical Analysis
Group-average data are expressed as mean ± standard error of the mean (SEM) unless indicated otherwise. Paired t-tests with Bonferroni-Holm correction for multiple comparisons were used to compare R1 at NBO, HB, and HBO to normobaric air. Linear regression was used to determine the relationship between inspired pO2 and R1.
3. RESULTS
R1 of the brain tissue increased as a function of inhaled pO2 (R2=0.36, P<0.0001). Group-average R1 values at NB, 4ATA HB, NBO, 3ATA HBO, and 4ATA HBO were 0.572±0.005, 0.594±0.007, 0.576±0.015, 0.589±0.016, and 0.634±0.015 s−1, respectively. The respective confidence intervals for each condition were 0.562–0.582, 0.578–0.609, 0.536–0.617, 0.539–0.640, and 0.596–0.671. R1 values of all conditions except for NBO were significantly larger than that of NB (P < 0.05). These T1 MRI data provided mean tpO2. In addition, intracellular and extracellular pO2 were calculated for comparison with published pO2 literatures which mostly reported extracellular pO2.
The mean tpO2, and intracellular and extracellular pO2 are approximately linear as a function of inhaled pO2 from the NB, NBO, 4ATA HB, 3ATA HBO, and 4ATA HBO conditions (Figure 1). The MRI-derived extracellular pO2 data are consistent with brain extracellular tissue pO2 from published literature using different invasive techniques (Figure 2A). The MRI-derived extracellular tissue pO2 data are slightly higher than published cerebral venous pO2 but markedly lower than published arterial pO2 (Figure 2B).
Figure 1.

MRI-derived mean brain tissue (tpO2), intracellular (IpO2), and extracellular (EpO2) pO2 at five different inhaled oxygen levels (normobaric air, 3ATA hyperbaric air, normobaric oxygen, 3ATA hyperbaric oxygen, and 4ATA hyperbaric oxygen). The MRI-derived pO2 data were roughly linearly related to inspired pO2. These determinations assumed an extracellular volume fraction of 0.25 and baseline extra- and intracellular pO2 at normobaric air of 20 mmHg and 7.5 mmHg, respectively. Error bars are mean ± SEM.
Figure 2.

Comparison of MRI-estimated extracellular pO2 (EpO2, solid points with trend line, means ± SEM) with (A) measured brain extracellular tissue pO2 data from published literature (open points),40–42 and (B) measured blood-gas pO2 data from published literature.27–31
To evaluate the effects of the parameters and the assumptions used in the MRI-derived extracellular pO2 calculation, we assessed physiological ranges of basal extracellular and intracellular pO2 at NB and of extracellular volume fraction, while keeping two of these three parameters fixed at a time (Figure 3). MRI-derived extracellular pO2 values showed substantial dependence on assumed extracellular pO2, intracellular pO2, and extracellular volume fraction, with larger deviations at higher pO2 concentrations.
Figure 3.

MRI-derived extracellular pO2 calculated over ranges of assumed (A) baseline extracellular pO2 at normobaric air (EpO2 in mmHg), (B) baseline intracellular pO2 at normobaric air (IpO2 in mmHg), and (C) extracellular volume fractions (Evol), while keeping other parameters fixed. The input parameters are shown on the plots. Literature data of experimental extracellular pO2 from Figure 2 are included for comparison.
By contrast, MRI-derived extracellular pO2 showed weak dependence on the oxygen relaxivity constant over the ranges commonly reported in the literature (Figure 4A). Similarly, MRI-derived extracellular pO2 showed weak dependence on the assumed intravascular oxygen contribution over the physiological ranges commonly reported in the literature (Figure 4B).
Figure 4.

Effects of (A) the relaxivity constant of oxygen (r1 in units of ×10−4 s−1/mmHg) and (B) blood volume fraction (BVol) on MRI-derived extracellular tissue pO2. For the varying blood volume data, intracellular volume fraction was kept constant while the extracellular volume fraction was adjusted to account for the blood volume fraction. Literature data of experimental extracellular pO2 from Figure 2 are included for comparison. EpO2: baseline extracellular pO2 at normobaric air in mmHg, IpO2: baseline intracellular pO2 at normobaric air, Evol: extracellular volume fraction, Ivol: intracellular volume fraction.
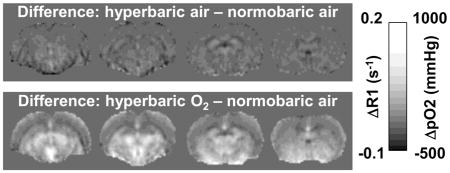
Figure 5 shows ΔpO2 maps among different oxygen inhalation conditions. The ΔpO2 maps showed heterogeneous patterns, outlining major anatomical boundaries. ΔpO2 in the corpus callosum appeared slightly hypointense relative to neighboring gray matter. ΔpO2 in the lateral and third ventricles appeared slightly hyperintense relative to the neocortex and similar to the subcortical structures. ΔpO2 of the subcortical structures appeared hyperintense relative to the neocortices.
Figure 5.

Basal T1 maps under normobaric air and ΔR1 maps of HB-NB and HBO-NB conditions. Scale bars show the ΔR1 and corresponding mean brain tissue ΔpO2 ranges. NB: normobaric air, HB: 4ATA hyperbaric air, HBO: 4ATA hyperbaric oxygen.
4. DISCUSSION
This study evaluated the feasibility of water T1 MRI to measure tissue pO2 changes under normobaric air, normobaric oxygen, 4ATA hyperbaric air, 3ATA hyperbaric oxygen, and 4ATA HBO with oxygen as an endogenous T1 contrast agent. The estimated extracellular brain pO2 under different inhaled oxygen concentrations are consistent with experimental data from the literature obtained using invasive techniques. The effects of various assumptions on extracellular pO2 estimates were evaluated. Extracellular pO2 values were highly dependent on the assumed baseline extracellular and intracellular pO2 values at normobaric air and the extracellular volume fraction, with larger uncertainties at higher inhaled pO2 concentrations. Extracellular pO2 was relatively less sensitive to variations in the oxygen relaxivity constant and blood volume. ΔpO2 maps amongst various inhaled oxygen conditions showed heterogeneous pO2 changes, with relatively high pO2 changes in the ventricles, followed by subcortical structures, neocortical structures, and the corpus callosum.
4.1 Brain tissue pO2
The MRI-derived extracellular pO2 data were within the ranges of previously published experimental data made using invasive techniques. MRI-derived extracellular pO2 was markedly lower than arterial pO2 but was slightly higher than the cerebral venous pO2. Cerebral venous blood is still not fully saturated up to 3.5 ATA of HBO.30, 31 This is consistent with our previous findings that venous baseline T2* signals in the brain still have room to increase and that stimulus-evoked blood oxygen level dependent functional MRI signals (which arise from changes in hemoglobin saturation) are still substantial under 3ATA HBO.32
The pO2 difference maps between different oxygen conditions showed heterogeneous spatial distributions of pO2 changes. ΔpO2 in the corpus callosum was small likely because white matter is less vascularized. ΔpO2 in the lateral and third ventricles appeared slightly higher which is consistent with the notion that extracellular pO2 is higher than intracellular pO2. The ΔpO2 of the subcortical structures also appeared higher than cortical structures, possibly due the comparatively higher vascular density in the striatum but further investigation is needed.
4.2 Effects of temperature, blood contribution, anesthetics
The precision of T1-derived pO2 in the vitreous has been reported to be about 10 mmHg.15 Although this precision is less favorable compared to other invasive methods, the T1 MRI approach is the only non-invasive and depth-resolved technique to measure tpO2 in a semi-quantitative manner and can also provide a spatial map of tpO2. Major factors that could contribute to errors in tpO2 determination are discussed below.
T1 is sensitive to temperature, with a relation of 0.106 s/°C in water, which would result in errors of T1-estimated pO2 of about 19–23 mmHg per 1°C change in temperature around physiological temperatures.15, 33 Thus, changes in body temperature could lead to substantial errors as the average brain tpO2 is on the order of 10 mmHg under normal physiological conditions. Body temperature should thus be tightly controlled or taken in to account.
Arterial blood T1 could be dramatically shortened under HBO conditions relative to tissue T1 due to the large increase in arterial pO2. Assuming an arterial T1 of 2.2 s at normobaric air,34 a relaxivity of 2×10⁻⁴ s−1/mmHg,35, 36 and an increase of arterial pO2 by about 2500 mmHg at 4ATA HBO, arterial blood T1 would be reduced to 1 s. While the difference in T1 is substantial, this contribution is likely negligible in the brain parenchyma because the mean arterial blood volume is small. Similarly, increased hemoglobin saturation could increase blood T1. However, this effect is likely negligible at physiological conditions and would only be present when hemoglobin becomes unsaturated.37
T1 can also be affected by cerebral blood flow, so changes of cerebral blood flow under different inhaled pO2 conditions could confound the pO2 estimates. Under NBO and HBO, animals showed reduced respiration rate (causing hypercapnia), and thus cerebral blood flow was slightly elevated compared to NB,32, 38 which could result in reduced effective T1. However, given the small blood volume fraction, the effects of these blood contributions on T1-derived tpO2 are likely negligible in the brain parenchyma.
4.3 Limitations and Future perspectives
There are several limitations in this study. (i) We modeled the mean tpO2 as composed of intra- and extracellular compartments. There are other subcellular compartments with varying pO2. For example, in isolated mitochondrial preparations, the critical pO2 necessary for mitochondria to function has been reported to be as low as 2 mmHg.3 T1 MRI can only measure overall mean tpO2, a weighted average of all tissue compartments in vivo. Models that include subcellular compartments have been developed and applied to exogenous contrast39 and could be explored in future studies. (ii) We also assumed that the extracellular to intracellular pO2 ratios are the same under different inhaled oxygen concentrations. This assumption does not affect the mean tpO2 calculation but could affect the secondary calculations of intracellular and extracellular pO2. (iii) While our tissue pO2 data were obtained under urethane, isoflurane, and α-chloralose anesthesia as well as slightly different MRI parameters, the resultant changes in pO2 were consistent between groups and were within the ranges of published experimental pO2 data, which were also obtained under different experimental conditions (i.e., different anesthetics and measurement methods). Comparison of brain tpO2 under different anesthetics in the same animals would be of interest. It would be also be of interest to investigate tissue oxygenation under hypercapnic or hypoxic conditions. (iv) tpO2 could be influenced by a number of biological or physiological variations. Basal R1 could vary between individuals, thereby affecting tpO2 estimates. Brain injury, disease and aging, and other factors, could change basal R1. While these biological variations make it challenging to compare absolute tpO2 across subjects and between normal and diseased subjects, measuring tpO2 changes associated with oxygen inhalation using this approach may be useful.
It may also be possible to measure task-evoked tpO2 changes with T1 MRI if the effects of cerebral blood flow changes on T1 can be deconvolved or removed (i.e., using crusher gradients). We expect that the accuracy and precision as well as the speed of T1 measurements could be improved which should improve tpO2 measurements. Finally, future studies need to validate the T1 approach to measure tpO2 with direct comparisons in the same animal with other established methods, such as with oxygen electrodes.
4.4 Conclusions
We evaluated the feasibility of T1 MRI to estimate brain tissue oxygenation under normobaric air, normobaric oxygen, hyperbaric air, and hyperbaric oxygen. The effects of various assumptions on brain tissue pO2 estimates were evaluated. This non-invasive tpO2 approach may prove useful for evaluating tissue oxygenation in disease states such as ischemic stroke and cancer.
Highlights.
Brain tissue T1 decreases with increasing inhaled oxygen concentrations.
Tissue oxygenation was estimated from T1 changes at varying inhaled oxygen levels.
Extracellular and intracellular oxygen were modeled from tissue T1 data.
MRI-modeled oxygen values are dependent on assumed tissue physiological parameters.
Acknowledgments
Grant support: This work was supported in part by the NIH/NINDS (R01 NS45879) to TQD and NIGMS MBRS-RISE GM060655 fellowship to DPC.
Abbreviations
- HBO
hyperbaric oxygen
- NBO
normobaric oxygen
- HB
hyperbaric air
- NB
normobaric air
- ATA
atmospheres absolute; tissue pO2
Footnotes
Publisher's Disclaimer: This is a PDF file of an unedited manuscript that has been accepted for publication. As a service to our customers we are providing this early version of the manuscript. The manuscript will undergo copyediting, typesetting, and review of the resulting proof before it is published in its final citable form. Please note that during the production process errors may be discovered which could affect the content, and all legal disclaimers that apply to the journal pertain.
References
- 1.Siesjo B. Brain Energy Metabolism. Wiley; New York: 1978. [Google Scholar]
- 2.Al-Waili NS, Butler GJ, Beale J, Abdullah MS, Hamilton RW, Lee BY, et al. Hyperbaric oxygen in the treatment of patients with cerebral stroke, brain trauma, and neurologic disease. Adv Ther. 2005;22(6):659–78. doi: 10.1007/BF02849960. [DOI] [PubMed] [Google Scholar]
- 3.Hempel F, Jobsis F, LaManna J, Rosenthal M, Saltzman H. Oxidation of cerebral cytochrome aa3 by oxygen plus carbon dioxide at hyperbaric pressures. J Appl Physiol. 1977;43:873–879. doi: 10.1152/jappl.1977.43.5.873. [DOI] [PubMed] [Google Scholar]
- 4.Chance B. Reaction of oxygen with the respiratory chain in cells and tissues. J Gen Physiol. 1965;49:163–188. doi: 10.1085/jgp.49.1.163. [DOI] [PMC free article] [PubMed] [Google Scholar]
- 5.Nair P, Whalen W, Buerk PO2 of cat cortex: response to breathing N2 and 100% O2. Microvasc Res. 1975;9:158–165. doi: 10.1016/0026-2862(75)90077-1. [DOI] [PubMed] [Google Scholar]
- 6.Mitnick M, Jobsis F. Pyrenebutyric acid as an optical oxygen probe in the intact cerebral cortex. J Appl Physiol. 1976;41:593–596. doi: 10.1152/jappl.1976.41.4.593. [DOI] [PubMed] [Google Scholar]
- 7.Jobsis F. Noninvasive infrared monitoring of cerebral and myocardial oxygen sufficiency and circulatory parameters. Science. 1977;198:1264–1267. doi: 10.1126/science.929199. [DOI] [PubMed] [Google Scholar]
- 8.Liu KJ, Gast P, Moussavi M, Norby SW, Vahidi N, Walczak T, et al. Lithium phthalocyanine: a probe for electron paramagnetic resonance oximetry in viable biological systems. Proc Natl Acad Sci U S A. 1993;90:5438–5442. doi: 10.1073/pnas.90.12.5438. [DOI] [PMC free article] [PubMed] [Google Scholar]
- 9.Mason RP, Zhao D, Pacheco-Torres J, Cui W, Kodibagkar VD, Gulaka PK, et al. Multimodality imaging of hypoxia in preclinical settings. Q J Nucl Med Mol Imaging. 2010;54(3):259–80. [PMC free article] [PubMed] [Google Scholar]
- 10.Oshino N, Sugano T, Oshino R, Chace B. Mitochondrial function under hypoxic conditions: the steady states of cytochrome a + a3 and their relation to mitochondrial energy states. Biochim Biophys Acta. 1974;368:298–310. doi: 10.1016/0005-2728(74)90176-5. [DOI] [PubMed] [Google Scholar]
- 11.Whalen WJ, Nair P. Intracellular PO2 and its regulation in resting skeletal muscle of the guinea pig. Circ Res. 1967;21(3):251–61. doi: 10.1161/01.res.21.3.251. [DOI] [PubMed] [Google Scholar]
- 12.Wu Y, Gao X, Feng X, Tao X, Tang CY. Oxygen-enhanced magnetic resonance imaging of the brain: a rodent model. Neuroreport. 2012;23(10):581–4. doi: 10.1097/WNR.0b013e328353a4bb. [DOI] [PubMed] [Google Scholar]
- 13.Shen Q, Huang S, Du F, Duong TQ. Probing ischemic tissue fate with BOLD fMRI of brief oxygen challenge. Brain Res. 2011;1425:132–141. doi: 10.1016/j.brainres.2011.09.052. [DOI] [PMC free article] [PubMed] [Google Scholar]
- 14.Hallac RR, Zhou H, Pidikiti R, Song K, Stojadinovic S, Zhao D, et al. Correlations of noninvasive BOLD and TOLD MRI with pO2 and relevance to tumor radiation response. Magn Reson Med. 2014;71(5):1863–73. doi: 10.1002/mrm.24846. [DOI] [PMC free article] [PubMed] [Google Scholar]
- 15.Muir ER, Zhang Y, San Emeterio Nateras O, Peng Q, Duong TQ. Human Vitreous: MR Imaging of Oxygen Partial Pressure. Radiology. 2013;266(3):905–11. doi: 10.1148/radiol.12120777. [DOI] [PMC free article] [PubMed] [Google Scholar]
- 16.Simpson AR, Dowell NG, Jackson TL, Tofts PS, Hughes EH. Measuring the effect of pars plana vitrectomy on vitreous oxygenation using magnetic resonance imaging. Invest Ophthalmol Vis Sci. 2013;54(3):2028–34. doi: 10.1167/iovs.12-11258. [DOI] [PubMed] [Google Scholar]
- 17.Pilkinton DT, Gaddam SR, Reddy R. Characterization of paramagnetic effects of molecular oxygen on blood oxygenation level-dependent-modulated hyperoxic contrast studies of the human brain. Magn Reson Med. 2011;66(3):794–801. doi: 10.1002/mrm.22870. [DOI] [PubMed] [Google Scholar]
- 18.Zaharchuk G, Martin AJ, Rosenthal G, Manley GT, Dillon WP. Measurement of cerebrospinal fluid oxygen partial pressure in humans using MRI. Magn Reson Med. 2005;54(1):113–21. doi: 10.1002/mrm.20546. [DOI] [PubMed] [Google Scholar]
- 19.Rohrer M, Bauer H, Mintorovitch J, Requardt M, Weinmann HJ. Comparison of magnetic properties of MRI contrast media solutions at different magnetic field strengths. Invest Radiol. 2005;40(11):715–24. doi: 10.1097/01.rli.0000184756.66360.d3. [DOI] [PubMed] [Google Scholar]
- 20.Muir ER, Cardenas D, Huang S, Roby J, Li G, Duong TQ. MRI under hyperbaric air and oxygen: Effects on local magnetic field and relaxation times. Magn Reson Med. 2014;72:1176–1181. doi: 10.1002/mrm.25027. [DOI] [PMC free article] [PubMed] [Google Scholar]
- 21.Van Harreveld A. The extracellular space in the vertebrate nervous system. In: Bourne GG, editor. The structure and function of nervous tissue. Academic Press; New York: 1972. pp. 447–511. [Google Scholar]
- 22.van der Toorn A, Sykova E, Dijkhuizen RM, Vorisek I, Vargova L, Skobisova E, et al. Dynamic changes in water ADC, energy metabolism, extracellular space volume, and tortuosity in neonatal rat brain during global ischemia. Magn Reson Med. 1996;36(1):52–60. doi: 10.1002/mrm.1910360110. [DOI] [PubMed] [Google Scholar]
- 23.Chen CF, Erdmann W, Halsey JH. The sensitivity of aplysia giant neurons to changes in extracellular and intracellular PO2. Adv Exp Med Biol. 1977;94:691–6. doi: 10.1007/978-1-4684-8890-6_95. [DOI] [PubMed] [Google Scholar]
- 24.Coyer PE, Halsey JH, Jr, Strong ER. Reversible changes in the intracellular potassium ion activities and membrane potentials of Aplysia L2–L6 neurones in response to normoxia and hypoxia. J Exp Biol. 1983;102:79–92. doi: 10.1242/jeb.102.1.79. [DOI] [PubMed] [Google Scholar]
- 25.Duong TQ, Kim SG. In vivo MR measurements of regional arterial and venous blood volume fractions in intact rat brain. Magn Reson Med. 2000;43(3):393–402. doi: 10.1002/(sici)1522-2594(200003)43:3<393::aid-mrm11>3.0.co;2-k. [DOI] [PubMed] [Google Scholar]
- 26.Lee S-P, Duong TQ, Yang G, Iadecola C, Kim S-G. Relative Changes of Cerebral Arterial and Venous Blood Volumes during Hypercapnia: Implications on BOLD fMRI. Magn Reson Med. 2001;45:791–800. doi: 10.1002/mrm.1107. [DOI] [PubMed] [Google Scholar]
- 27.Whalen RE, Saltzman HA, Holloway DH, Jr, McIntosh HD, Sieker HO, Brown IW., Jr Cardiovascular and Blood Gas Responses to Hyperbaric Oxygenation. The American journal of cardiology. 1965;15:638–46. doi: 10.1016/0002-9149(65)90350-4. [DOI] [PubMed] [Google Scholar]
- 28.Weaver LK, Howe S. Normobaric measurement of arterial oxygen tension in subjects exposed to hyperbaric oxygen. Chest. 1992;102(4):1175–81. doi: 10.1378/chest.102.4.1175. [DOI] [PubMed] [Google Scholar]
- 29.Clark JM, Lambertsen CJ. Alveolar-arterial O2 differences in man at 0.2, 1.0, 2.0, and 3. 5 Ata inspired PO2. J Appl Physiol. 1971;30(5):753–63. doi: 10.1152/jappl.1971.30.5.753. [DOI] [PubMed] [Google Scholar]
- 30.Lambertsen CJ, Dough RH, Cooper DY, Emmel GL, Loeschcke HH, Schmidt CF. Oxygen toxicity; effects in man of oxygen inhalation at 1 and 3. 5 atmospheres upon blood gas transport, cerebral circulation and cerebral metabolism. J Appl Physiol. 1953;5(9):471–86. doi: 10.1152/jappl.1953.5.9.471. [DOI] [PubMed] [Google Scholar]
- 31.Jacobson I, Harper AM, McDowall DG. The Effects of Oxygen under Pressure on Cerebral Blood-Flow and Cerebral Venous Oxygen Tension. Lancet. 1963;2(7307):549. doi: 10.1016/s0140-6736(63)92644-8. [DOI] [PubMed] [Google Scholar]
- 32.Cardenas DP, Muir ER, Huang S, Boley A, Lodge D, Duong TQ. Functional MRI during hyperbaric oxygen: Effects of oxygen on neurovascular coupling and BOLD fMRI signals. Neuroimage. 2015;119:382–389. doi: 10.1016/j.neuroimage.2015.06.082. [DOI] [PMC free article] [PubMed] [Google Scholar]
- 33.Zaharchuk G, Busse RF, Rosenthal G, Manley GT, Glenn OA, Dillon WP. Noninvasive oxygen partial pressure measurement of human body fluids in vivo using magnetic resonance imaging. Academic radiology. 2006;13(8):1016–24. doi: 10.1016/j.acra.2006.04.016. [DOI] [PubMed] [Google Scholar]
- 34.Dobre MC, Ugurbil K, Marjanska M. Determination of blood longitudinal relaxation time (T1) at high magnetic field strengths. Magn Reson Imaging. 2007;25(5):733–5. doi: 10.1016/j.mri.2006.10.020. [DOI] [PubMed] [Google Scholar]
- 35.Janne d’Othee B, Rachmuth G, Munasinghe J, Lang EV. The effect of hyperoxygenation on T1 relaxation time in vitro. Academic radiology. 2003;10(8):854–60. doi: 10.1016/s1076-6332(03)00004-7. [DOI] [PubMed] [Google Scholar]
- 36.Pilkinton DT, Hiraki T, Detre JA, Greenberg JH, Reddy R. Absolute cerebral blood flow quantification with pulsed arterial spin labeling during hyperoxia corrected with the simultaneous measurement of the longitudinal relaxation time of arterial blood. Magn Reson Med. 2012;67(6):1556–65. doi: 10.1002/mrm.23137. [DOI] [PMC free article] [PubMed] [Google Scholar]
- 37.Grgac K, van Zijl PC, Qin Q. Hematocrit and oxygenation dependence of blood (1)H(2)O T(1) at 7 Tesla. Magn Reson Med. 2013;70(4):1153–9. doi: 10.1002/mrm.24547. [DOI] [PMC free article] [PubMed] [Google Scholar]
- 38.Sicard KM, Duong TQ. Effects of Hypoxia, Hyperoxia and Hypercapnia on Baseline and Stimulus-Evoked BOLD, CBF and CMRO2 in Spontaneously Breathing Animals. NeuroImage. 2005;25:850–858. doi: 10.1016/j.neuroimage.2004.12.010. [DOI] [PMC free article] [PubMed] [Google Scholar]
- 39.Strijkers GJ, Hak S, Kok MB, Springer CS, Jr, Nicolay K. Three-compartment T1 relaxation model for intracellular paramagnetic contrast agents. Magn Reson Med. 2009;61(5):1049–58. doi: 10.1002/mrm.21919. [DOI] [PubMed] [Google Scholar]
- 40.Daugherty WP, Levasseur JE, Sun D, Rockswold GL, Bullock MR. Effects of hyperbaric oxygen therapy on cerebral oxygenation and mitochondrial function following moderate lateral fluid-percussion injury in rats. Journal of neurosurgery. 2004;101(3):499–504. doi: 10.3171/jns.2004.101.3.0499. [DOI] [PubMed] [Google Scholar]
- 41.Jamieson D, Vandenbrenk HA. Measurement of Oxygen Tensions in Cerebral Tissues of Rats Exposed to High Pressures of Oxygen. J Appl Physiol. 1963;18:869–76. doi: 10.1152/jappl.1963.18.5.869. [DOI] [PubMed] [Google Scholar]
- 42.van Hulst RA, Haitsma JJ, Klein J, Lachmann B. Oxygen tension under hyperbaric conditions in healthy pig brain. Clin Physiol Funct Imaging. 2003;23(3):143–8. doi: 10.1046/j.1475-097x.2003.00485.x. [DOI] [PubMed] [Google Scholar]
- 43.Matsumoto K, Bernardo M, Subramanian S, Choyke P, Mitchell JB, Krishna MC, et al. MR assessment of changes of tumor in response to hyperbaric oxygen treatment. Magn Reson Med. 2006;56(2):240–6. doi: 10.1002/mrm.20961. [DOI] [PubMed] [Google Scholar]
- 44.Silvennoinen MJ, Kettunen MI, Kauppinen RA. Effects of hematocrit and oxygen saturation level on blood spin-lattice relaxation. Magn Reson Med. 2003;49(3):568–71. doi: 10.1002/mrm.10370. [DOI] [PubMed] [Google Scholar]