Abstract
AIM
To examine light-emitting-diode (LED)-induced retinal neuronal cell damage and its wavelength-driven pathogenic mechanisms.
METHODS
Sprague-Dawley rats were exposed to blue LEDs (460 nm), green LEDs (530 nm), and red LEDs (620 nm). Electroretinography (ERG), Hematoxylin and eosin (H&E) staining, transmission electron microscopy (TEM), terminal deoxynucleotidyl transferase dUTP nick end labeling (TUNEL), and immunohistochemical (IHC) staining, Western blotting (WB) and the detection of superoxide anion (O2−·), hydrogen peroxide (H2O2), total iron, and ferric (Fe3+) levels were applied.
RESULTS
ERG results showed the blue LED group induced more functional damage than that of green or red LED groups. H&E staining, TUNEL, IHC, and TEM revealed apoptosis and necrosis of photoreceptors and RPE, which indicated blue LED also induced more photochemical injury. Free radical production and iron-related molecular marker expressions demonstrated that oxidative stress and iron-overload were associated with retinal injury. WB assays correspondingly showed that defense gene expression was up-regulated after the LED light exposure with a wavelength dependency.
CONCLUSION
The study results indicate that LED blue-light exposure poses a great risk of retinal injury in awake, task-oriented rod-dominant animals. The wavelength-dependent effect should be considered carefully when switching to LED lighting applications.
Keywords: retinal light injury, LED light injury, blue light injury, iron, light injury mechanisms, oxidative stress
INTRODUCTION
The rapid development of white light-emitting diode (LED) lighting[1] has raised serious retinal hazard concerns by consumers[2]. In a previous study, we investigated the potential retinal photochemical injury (RPI) induced by LEDs in a rat model. The results suggested that the blue-rich LED white light has a higher chance to induce RPI than does the conventional compact fluorescent lamp (CFL) white light[3]. However, susceptibility to PRI is multifactorial[4], and wavelengths certainly play an important role[5]. According to Planck's relation (E=h/λ, where E=energy, h=the Planck constant, and λ=wavelength), a photon corresponding to blue light is more energetic[4] than photons of longer wavelengths, such as green or red light. Furthermore, blue light has the greatest potential to induce PRI, which has been reconfirmed both by in vitro[6]–[13] and in vivo studies[14]–[19].
Blue light could induce the formation of reactive oxygen species (ROS) in human retinal pigment epithelium (RPE) mitochondria that leads to retinal apoptosis has been reported by cell culture studies[7],[10],[12]–[13],[20]–[23] and animal models[15],[18],[24]–[25]. The initial injuries involve a series of processes, including signaling molecules released from outer retinal cells, oxidatively damaged biomolecules[26], dysfunction and death of outer retinal cells, and removal of apoptotic debris by activated retinal microglia and systemic macrophages[27]. This injury is also site-specific and depends on the iron concentration in the retina[28]–[29]. The iron regulatory genes that favor increased iron uptake were altered after photic injury. The unbalanced iron may further accelerate oxidative stress in a cycle of cellular self-destruction[30]. Moreover, the injury possibly corresponds to a retinal remodeling process following the light injury[31]–[32].
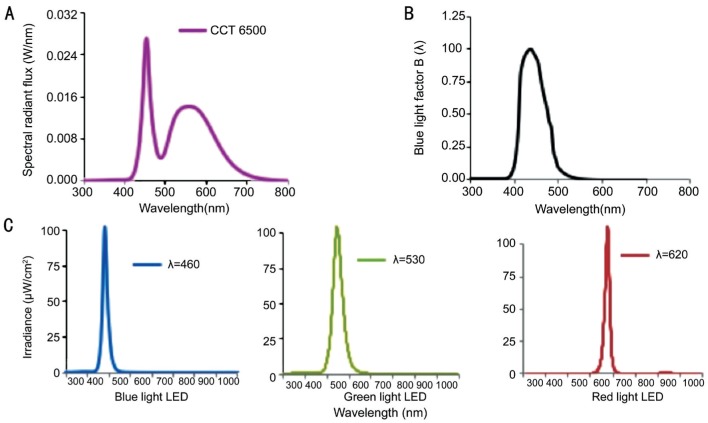
Although there has been a wealth of studies describing the RPI associated with wavelength dependency previously, the experimental settings were focused on high intensity light exposure over a short period of time (a few seconds to 3d) for acute or subacute toxicity assessments. The tested animals were anesthetized or forced to stare into the lights in most of the cases, and the light sources varied due to contemporary technology availability. However, in our study the animals were allowed to move freely in the cage during the entire time of exposure. White light LED was not largely adopted for indoor lighting until 2009[1], and its short wavelength spectrum (Figure 1A) is distributed into the blue light hazard action function [Figure 1B, B(λ)]. To conduct a subchronic risk assessment, we used blue (460 nm), green (530 nm), and red (620 nm) LEDs to investigate how specific bands were responsible for retinal phototoxic effects under the same irradiance level at 102 µW/cm2 (Figure 1C).
Figure 1. LED light sourcespectral power distribution (SPD) curves.
A: Yellow phosphor-converted white LED to exhibit correlated color temperature (CCT) at 6500 K; the first peak appeared at 460 nm with 0.028 W/nm showing the blue content and the second peak with a bell shape presenting a large portion of yellow content; B: Blue light factor B(λ) distribution; C: Single-wavelength blue light LED peaked at 460 nm with 102.3 µW/cm2 in radiometric units. Green light LED peaked at 530 nm with 102.8 µW/cm2. Red light LED peaked at 620 nm with 102.7 µW/cm2.
MATERIALS AND METHODS
Animals and Rearing Conditions
In total, 202 adult male eight-week-old Sprague-Dawley (SD) rats were purchased from BioLasco Taiwan Co., Ltd. and housed at 15.57 µW/cm2 [12h cyclic CFL; correlated color temperature (CCT) 6500 K] for 10d for environmental adaptation. Forty normal rats served as controls without exposure (remained in 15.57 µW/cm2 12h cyclic CFL light), and the other 162 rats received programmed light exposure, as shown in Table 1. We were blinded to the group allocation during the experiment and/or when assessing the outcome. The animals would be excluded from the analysis if animals were died during the experiments. The temperature of the exposure environment (both the room and individual cages) was maintained at 22°C-23°C with humidity between 50% and 70%. All animals received food and water adlibitum. The use of rats in this study conformed to the ARVO statement for the Use of Animals in Ophthalmic and Vision Research and Laboratory Animal Resource Committee guidelines at National Taiwan University. We received the animal use approval (affidavit of approval of animal use protocol #20110568) from National Taiwan University College of Medicine and College of Public Health Institutional Animal Care and Use Committee (IACUC). The animals were treated humanely and with regard to the alleviation of suffering.
Table 1. Exposure groups.
| Groups | Number of animals in each group |
|||
| Control | Blue LED (460 nm) | Green LED (530 nm) | Red LED (620 nm) | |
| 3d (ERG/H&E/WB/ROS/Iron)a | 12 | 18 | 18 | 18 |
| 9d (ERG/H&E/TEM/TUNEL/IHC/WB/ROS/Iron)a | 16 | 24 | 24 | 24 |
| 28d (ERG/H&E/TEM/WB)a | 8b | 12 | 12 | 12 |
| Total; n=198b | 36b | 54 | 54 | 54 |
aThe number of animals in each group represents all listed experiment techniques shared those animals (not all techniques are able to perform on each animal); bFour animals from the control group died after the ERG operation and unable to complete the other measurements (H&E/TEM/WB). ERG: Electroretinography; H&E: Hematoxylin and eosin; WB: Western blotting; ROS: Reactive oxygen species; TEM: Transmission electron microscopy; TUNEL: Terminal deoxynucleotidyl transferase dUTP nick end labeling; IHC: Immunohistochemical.
Light Source and Exposure
LED lights with varying spectral characteristics were used as the sources for primary exposure treatments. As shown in Figure 1C, single-wavelength blue LEDs (460 nm, 102.3 µW/cm2), green LEDs (530 nm, 102.8 µW/cm2), and red LEDs (620 nm, 102.7 µW/cm2) were custom-made for the exposure experiments (BlueDog Technology Corporation Ltd., Taipei, Taiwan, China). Each light source was pretested in an integrating sphere and programmed for 40 measurements on site. The spectrum distributions and total intensities for all light sources were tested by the Industrial Technology Research Institute of Taiwan, a Certification Body Testing Laboratory (CBTL).
As shown in Table 1, the animals were randomly divided into 3 exposure groups, and each rat was housed in an individual transparent cage with dimensions of 45×25×20 cm. Each cage was placed in the center of a rack shelf with dimensions of 75×45×35 cm. Each rack, equipped with 6 layers of shelving, was covered with a black curtain to keep the light intensity and quality separate. The light sources were set at the top of each shelf and were measured at 20 cm from each source to acquire the irradiance at the level of the cornea at 102.3, 102.8 and 102.7 µW/cm2 for blue, green, and red, respectively. After 10d of environmental adaptation, the light exposure was initiated at 6:00 p.m. on day 11, with the total exposure duration ranging from 3 to 9 to 28d under a 12h-dark/12h-light cyclic routine. The animals were sacrificed for analysis after light exposure.
Sample Pretreatment
The animals were anesthetized, and both eyes were scanned using electroretinography (ERG) after completing the light treatment. They were sacrificed with pentobarbital sodium (>60 mg/kg; intraperitoneal) immediately after the ERG scans. For hematoxylin and eosin (H&E) staining and terminal deoxynucleotidyl transferase dUTP nick end labeling (TUNEL) staining, enucleated eyes were immersion-fixed in 4% paraformaldehyde in 0.1 mol/L phosphate buffered saline (PBS) at pH 7.4 overnight before being embedded in paraffin. For the transmission electron microscopy (TEM) analysis, the eyeballs were immersion-fixed in 2.5% glutaraldehyde in PBS for 2h before further processing. For the immunohistochemistry (IHC) stains, the eyeballs were frozen immediately in liquid nitrogen after enucleation. Cryosections of 4 µm thickness were made in the glass slide and maintained at -80°C until analysis. The mid-superior aspect of the retina was examined using H&E, TUNEL, TEM, and IHC. For the superoxide anion (O2−·) assay, the eyeballs were frozen immediately in liquid nitrogen after enucleation. The eyeballs were ground with saline (500 µL saline per eye) for extraction. For the Western blot (WB), the hydrogen peroxide (H2O2) assay, and the iron assays, retinal tissues were taken immediately for protein extraction after the eyes were enucleated. As reported previously[33], the proteins were extracted from the retinal homogenates using radioimmunoprecipitation assay (RIPA) lysis buffer, which contained 0.5 mol/L Tris-HCl (pH 7.4), 1.5 mol/L NaCl, 2.5% deoxycholic acid, 10% NP-40, 10 mmol/L EDTA, and 10% protease inhibitors (Complete Mini; Roche Diagnostics Corp., Indianapolis, IN, USA).
Electroretinography
Retinal electrical responses were recorded for all rats before and after light exposure using ERG (Acrivet, Hennigsdorf, Germany). After 18h of dark adaptation, rats were anesthetized using an intramuscular injection of 100 mg/kg ketamine and 5 mg/kg xylazine (WDT eG, Garbsen, Germany). One drop of 0.5% tropicamide (Mydriaticum Stulln, Pharma Stulln, Germany) was applied for pupil dilation before ERG measurement. One drop of 0.5% Alcaine (proxymetacaine hydrochloride; Alcon Pharmaceuticals Ltd., Puurs, Belgium) was applied for local anesthesia before placing the active electrode onto the cornea. Two subcutaneous needle electrodes (Ambu Neuroline Twisted Pair Subdermal, Bad Nauheim, Germany) served as the reference and ground electrodes. The reference needle was subcutaneously inserted between the eyes, and the ground needle was subcutaneously inserted between the rear legs to obtain the proper impedance levels, which were less than 10 kΩ at 25 Hz. LED flashes were stimulated without background illumination, and the flash interval was 1s with a flash duration of 3ms. The weighted average of 10 stimulations was computed by the program to produce the final detection values.
Hematoxylin and Eosin Staining
After pretreatment, paraffin sectioning was performed [4% paraformaldehyde in 0.1 mol/L phosphate buffer (pH 7.4) for 1h at 48°C], and the eyeballs were dehydrated in EtOH, infiltrated in xylene, and embedded in paraffin. Radial 5 µm sections were stored at 48°C. The histologic analysis included quantification of the outer nuclear layer (ONL) and retina morphology alteration using a light microscope.
Transmission Electron Microscopy Analysis
TEM was performed at the Electron Microscopy Facility at the Department of Pathology at National Taiwan University Hospital (Taipei, Taiwan, China). Retina slices of 1 mm were prefixed in 2.5% glutaraldehyde in PBS, postfixed with 2% osmium tetroxide, and dehydrated for 10min each in sequential baths of 30%, 50%, 70%, 90%, and 100% ethanol. The specimens were placed into propylene oxide for 30min, followed by a mixture of propylene oxide and epoxy resin for an additional 1h; the samples were subsequently embedded into a gelatin capsule with epoxy resin at 60°C for one day. Subsequently, 80 to 90 nm ultrathin sections were obtained using an ultramicrotome. The sections were stained with 2% tannic acid in distilled water (DW) for 5min, followed by 2% uranyl acetate in DW for 15min and a lead-staining solution for 5min. In the final step, the sections were coated with a thin copper grid-film and placed in a vacuum chamber for scanning. The specimens were examined using TEM with a high-resolution instrument at 80 kV (JEOL JEM-1400, Peabody, MA, USA).
Terminal Deoxynucleotidyl Transferase dUTP Nick End Labeling
The TUNEL assay was performed using a FragELTM DNA fragmentation detection kit (Calbiochem, Darmstadt, Germany) following the standard protocol with a minor modification. Tissue sections were deparaffinized, rehydrated, and blocked using endogenous peroxidase with H2O2 for 30min. Antigen retrieval was achieved by pressure-cooking in a 0.1 mol/L citrate buffer at pH 6 for 10min followed by cooling at room temperature before incubation with the enzyme. The TUNEL enzyme (1h at 37°C) and peroxidase converter (30min at 37°C) were applied to the 10 µm sections after incubation for 5min in a permeabilizing solution of 0.1% Triton-X in 0.1% sodium citrate. The fluorescent signals were obtained by adding FITC-Avidin, which bound to the biotinylated-dU of the damaged DNA. After staining, image analysis was used to quantify the relative fluorescence intensity of the TUNEL-positive cells, with the number of TUNEL-stained nuclei quantified in 4 random slides per sample.
Western Blotting
Total protein was extracted from the retina by lysing the sample in radioimmunoprecipitation assay (RIPA) buffer [0.5 mol/L Tris-HCl (pH 7.4), 1.5 mol/L NaCl, 2.5% deoxycholic acid, 10% NP-40, 10 mmol/L EDTA] and protease inhibitors (Complete Mini; Roche Diagnostics Corp., Indianapolis, IN, USA). The extract and Laemmli buffer were mixed at a 1:1 ratio, and the mixture was boiled for 5min. A 100-mg sample was separated on 10% SDS-polyacrylamide gels and then transferred to polyvinylidene difluoride membranes (Immobilon-P; Millipore Corp., Billerica, MA, USA). The membranes were incubated with anti-hemeoxygenase-1 (HO-1; Abcam, Cambridge, MA, USA), anti-ceruloplasmin (CP; Santa Cruz Biotechnology, Dallas, Texas, USA), anti-cytosolic glutathione peroxidase (GPx1; Abcam, Millipore Billerica, MA, USA), anti-poly (ADP-ribose) polymerase-1 (PARP-1; Cell Signaling Technology Inc., Danvers, MA, USA), anti-superoxide dismutase (SOD2; Santa Cruz Biotechnology Inc., Dallas, Texas, USA), and anti-β-actin (Abcam, Millipore Billerica, MA, USA) antibodies. The membranes were incubated with horseradish peroxidase-conjugated secondary antibody and visualized by chemiluminescence (GE Healthcare). The density of the blots was determined using image analysis software after scanning the image (Photoshop, ver.7.0; Adobe Systems, San Jose, CA, USA). The optical densities of each band were evaluated by comparison with the density of the β-actin bands.
Immunohistochemistry
Cryosections of the retina samples were incubated overnight at 48°C with specific primary antibodies. Three antibodies were used for detection of oxidative/nitrative modifications of DNA (8-OhdG; JAICA, Tokyo, Japan), lipids (Acrolein; Advanced Targeting Systems, San Diego, CA, USA) and proteins (nitrotyrosine; Abcam, Millipore Billerica, MA, USA). The same quantification method used for the TUNEL analysis was applied in the IHC analyses. The relative fluorescence intensity corresponding to the number of IHC-positive cells for each section was measured and quantified by Image-Pro Plus software (v.6.0).
Superoxide Anion Assay
We loaded 0.2 mL of homogenized extraction with 0.1 mL of 0.9% saline onto a 3-cm dish with a stir bar placed at the center. The dish was placed into the chemiluminescence analyzer chamber (Tohoku CLA-FS1, Miyagi, Japan). The ROS were quantified after adding the enhancer Lucigenin to the chemiluminescence analyzer. After 60s of background detection, 1 mL of a Lucigenin (bis-N-methylacridinium nitrate) solvent (2.5 mg of Lucigenin dissolved in 50 mL 0.9% saline) was added for stimulation. The stimulated O2−· and total oxidative products were captured every 10s and computed for 7min after 1min of baseline detection.
Hydrogen Peroxide Assay
The assay was performed using a hydrogen peroxide colorimetric/fluorometric assay kit (BioVision, Milpitas, CA, USA) following the standard protocol to detect H2O2 concentrations after 3d of light exposure. In brief, total protein was extracted from the retina and centrifuged for 15min immediately after the extraction. Each well was loaded with 20 µL samples and brought to a volume of 50 µL with assay buffer. Reagents and H2O2 standards were mixed and then incubated for 10min. A background detection was performed, and an H2O2 standard curve was plotted. Sample readings were compared to the standard curve for the concentration calculations.
Total Iron and Ferric Assay
The assay was performed using a QuantiChrom Iron Assay (DIFE-250) Kit (BioAssay Systems, Hayward, CA, USA) following the standard protocol to detect total iron concentrations after 3d of light exposure. In brief, total protein was extracted from the retina, and 50 µL of the extraction was loaded into a 96-well plate. Then, 200 µL of working reagent was added and incubated for 40min at room temperature, followed by an optical density reading at 510-630 nm. Sample readings were compared with the standard curve to calculate the concentrations.
Statistical Analysis
Data are presented as the mean±SD unless otherwise stated. Data were evaluated using an analysis of variance (ANOVA) with Tukey's post hoc tests to show differences between the groups. A P value less than 0.05 was considered statistically significant.
RESULTS
Functional and Morphological Alterations
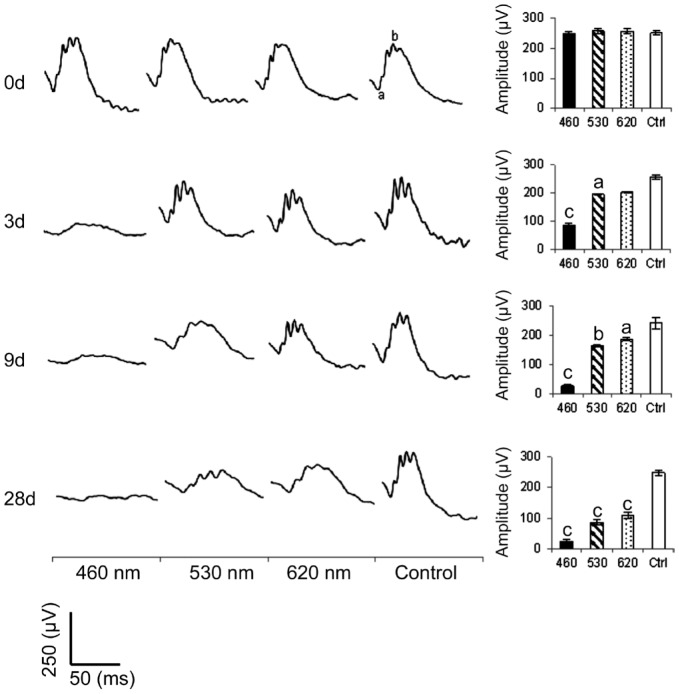
The representative ERG response curves of the testing animals are shown in Figure 2. Whereas the control group showed normal ERG a- and b-waves, the blue LED significantly weakened the ERG responses after 3d of exposure. Moreover, the b-wave amplitudes for the blue, green, and red light exposure groups all showed a significant decrease compared with the control group after 9d of exposure. The H&E images in Figure 3A show an uneven morphological alteration in the rat retinas after 28d of light exposure. Figure 3B quantifies the thickness of the ONL and shows that the blue LED exposure group has the least thickness.
Figure 2. Electroretinography responses.
All three LED groups demonstrated a significant decrease in the b-wave amplitude after light exposure. The blue LED group showed the highest function loss; n=40 for the control group and n=54 for each exposure group. Curve scale: amplitude=250 µV and stimulation=50ms. aP<0.05, bP<0.01, cP<0.001 compared with the control group.
Figure 3. Histological analysis.
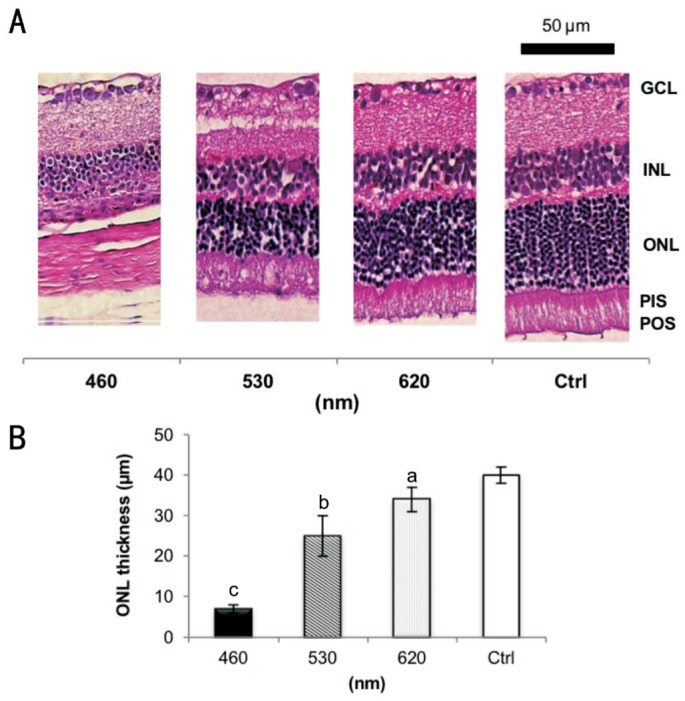
A: Normal retinal layers in the control group compared to different LED light exposure-induced retinal injuries, including the absence of photoreceptors and INL degeneration; B: The ONL thickness of the exposure groups decreased significantly after 28d of light exposure. The blue LED group exhibited the strongest loss; n=6 for the control group and n=8 for each exposure group. GCL: Ganglion cell layer; INL: Inner nuclear layer; ONL: Outer nuclear layer; PIS: Photoreceptor inner segment; POS: Photoreceptor outer segment. The retinal pigment epithelium (usually next to the POS layer) is detachedand cannot be found within this scope in A. aP<0.05, bP<0.01, cP<0.001 compared with the control group; scale bar=50 µm.
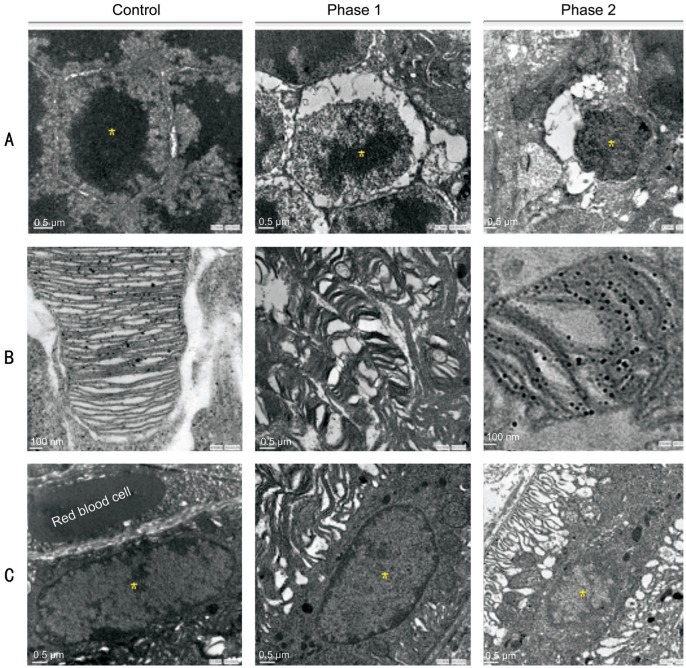
The TEM histopathology analysis (Figure 4) highlighted that the damage in the RPE and photoreceptors area from blue light could be lethal after 9d of exposure; more details were described in a previous report[3]. Referring to the retinal remodeling phases[31]–[32], Figure 4A shows the normal ONL nucleolus and its pyknosis in phases 1 and 2. Figure 4B shows the normal photoreceptor outer segment (POS) and its disorganized disks in phase 1 and the round POS in phase 2. Figure 4C displays the normal oval-shaped RPE nucleus and shrinkage in phase 1 and the RPE condensation and deformation in phase 2.
Figure 4. Retinal cellular injury studied by TEM.
A: Normal ONL nucleolus on the left; nucleolus condensation in phase 1 remodeling and pyknosis in phase 2; B: Normal POS on the left; POS deformations in phase 1 remodeling and round POS debris in phase 2; C: Normal RPE nucleus on the left; shrinking RPE nucleus in phase 1 and condensation in phase 2. There are 36 sections analyzed and 244 of pyknotic RPE nuclei observed after the blue light exposure; n=4 for the control group and n=6 for the exposure group. Scale bar=100 nm for the control and phase 2 in B; scale bar=0.5 µm for the rest of other images.
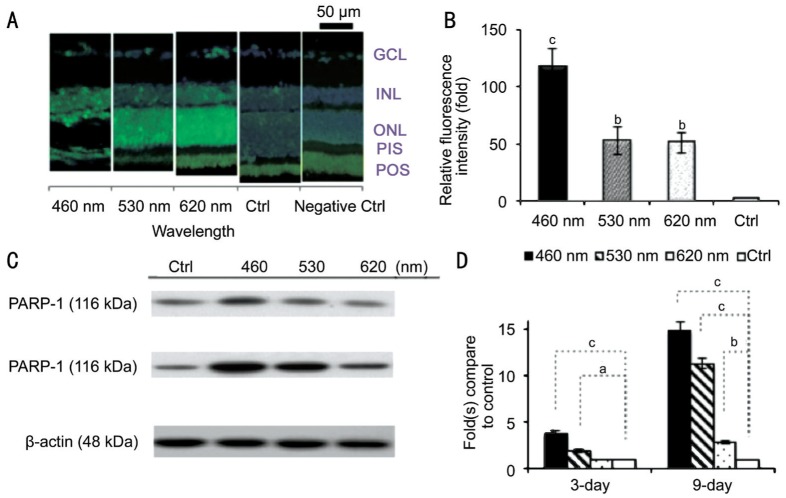
As shown in Figure 5, the apoptotic analysis by TUNEL staining in Figure 5A and 5B shows significant fluorescence response increases after 9d of light exposure. Both the histological and apoptotic results showed that light exposure may cause RPI for blue, green and red LEDs. However, the blue light had a stronger effect than did the other two groups. It's also worth to mention that TUNEL staining does not always correlate with the eventual cell death[34]. The caspase-independent apoptotic marker PARP-1 also showed higher activation signals after blue and green light exposure by WB assay (Figure 5C, 5D).
Figure 5. Molecular apoptotic marker detection.
A: The damaged retinal cells correspond to the positive labeling. The results showed that more apoptotic cells presented in the retina of the exposure groups; B: The blue LED group exhibited the highest fluorescence intensity; C: The WB results showed apoptotic marker, PARP-1, had higher activation after 3, 9d of blue or green light exposure; D: The PARP-1 expression showed much significant activation after 3, 9d of exposure; n=4 for the control group and n=8 for each exposure group. GCL: Ganglion cell layer; INL: Inner nuclear layer; ONL: Outer nuclear layer; PIS: Photoreceptor inner segment; POS: Photoreceptor outer segment. aP<0.05, bP<0.01, cP<0.001 compared with the control group.
Retinal Photochemical Injury Oxidative Stress Markers Expression
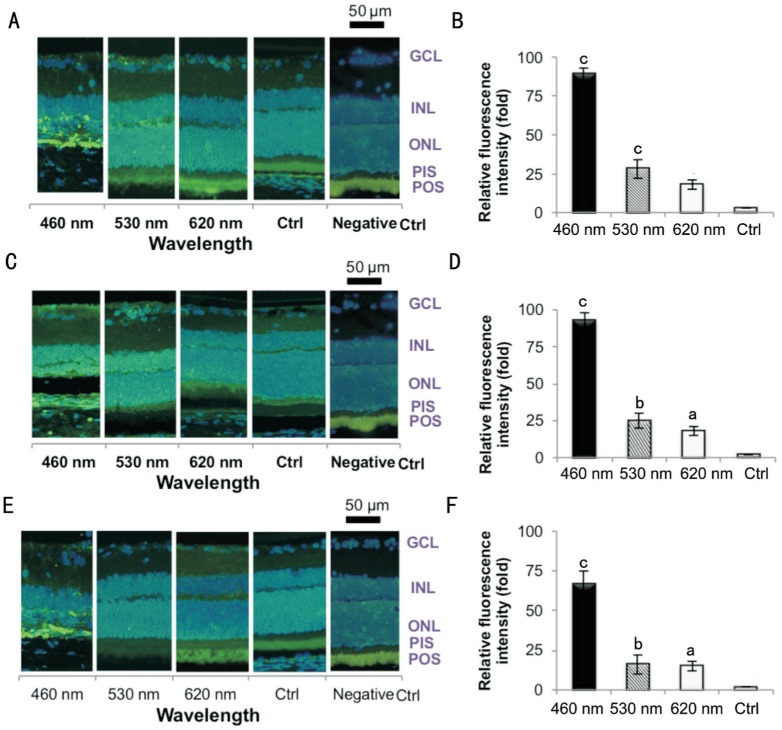
Three IHC antibodies were used to detect cellular oxidative/nitrative markers after 9d of light exposure. The 8-OHdG (Figure 6A, 6B), acrolein (Figure 6C, 6D), and nitrotyrosine (Figure 6E, 6F) labels represent the oxidative and nitrative damage to DNA, lipid, and protein, respectively. These three IHC antibodies all showed strong responses. The blue LED caused more cell insults than did the green and red LED based on the highest fluorescence responses (P<0.001, by ANOVA followed by Tukey's post hoc test).
Figure 6. Retinal light injury molecular labeling by IHC.
A, B: 8-OHdG was used to detect the DNA adducts; C, D: Acrolein was used to detect the lipid adducts on macromolecules; E, F: Nitrotyrosine was used for protein adduct recognition. The result shows all exposure groups exhibited higher fluorescence intensity in the ONL. The blue LED group exhibited the highest response, whereas the green and red groups' response was lower; n=6 for the control group and n=8 for each exposure group. GCL: Ganglion cell layer; INL: Inner nuclear layer; ONL: Outer nuclear layer; PIS: Photoreceptor inner segment; POS: Photoreceptor outer segment. aP<0.05, bP<0.01, cP<0.001 compared with the control group; scale bar=50 µm.
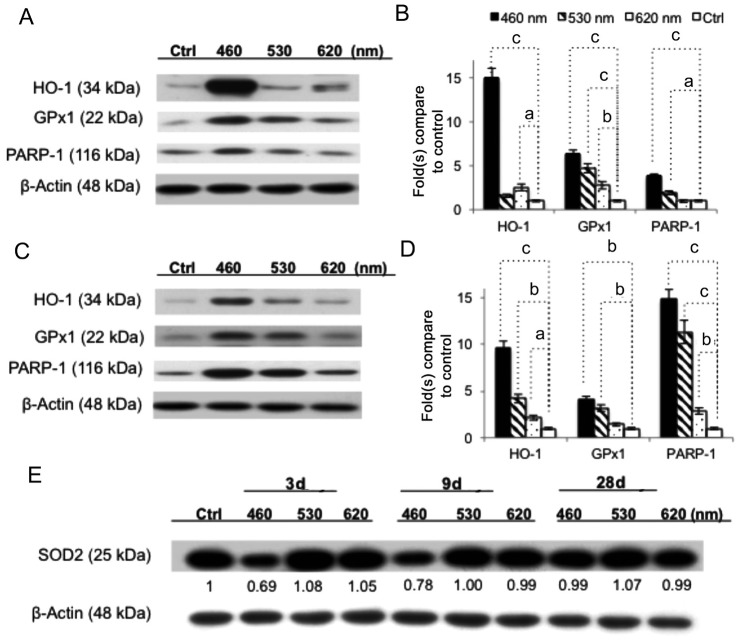
As shown in Figure 7A and 7B, the WB results showed that light injury up-regulated the stress protein expression of the antioxidant genes hemeoxygenase-1 (HO-1) and the enzymatic antioxidant GPx1 as an antioxidant response to light insult. The protein expression levels of HO-1 and GPx1 were significantly augmented in the blue light exposure group (15.03 and 6.34 times higher, respectively, compared with the control). The apoptotic marker PARP-1 also showed a 3.8 times higher activation signal after blue light exposure. Overall, the blue light group had the clearest expression in the bands, and the green and red light groups had relatively mild responses after 3d of exposure. Although the upward trend remained the same among the exposure groups, the intensity factors varied after 9d of exposure (Figure 7C, 7D). Interestingly (Figure 7E), the manganese superoxide dismutase (MnSOD, SOD2) was down-regulated after 3 or 9d of blue LED light exposure (0.69 and 0.78 times that of the control group) before reaching a higher expression of 0.99 at day 28 due to the delayed/adaptive antioxidant response[35].
Figure 7. WB assay of anti-oxidant enzymes.
A, B: After 3d of light exposure, the antioxidant genes HO-1 and cytosolic GPx1 were up-regulated after blue LED light exposure as an antioxidant response to all LED light insults, but the blue LED showed the strongest expression. The apoptotic marker PARP-1 showed greater densities after blue and green light exposure. C, D: Clear wavelength-dependent expressions were found after 9d of light exposure. E: SOD2 was down-regulated, corresponding to the wavelengths after 3 or 9d of light exposure, but the blue light activated a higher expression after 28d of exposure due to the delayed/adaptive antioxidant response; n=6 for the control group and n=8 for each exposure group. aP<0.05, bP<0.01, cP<0.001 compared with the control group.
Iron Metabolism and Superoxide Products
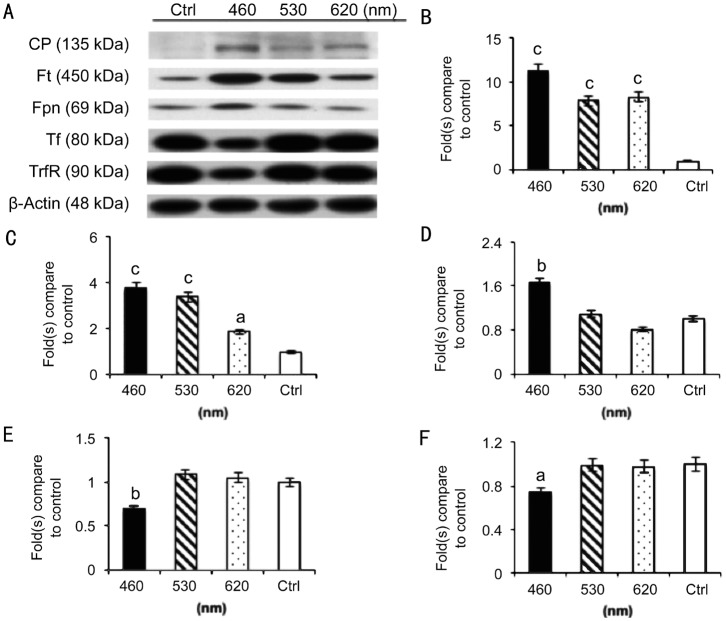
The WB results showed a strong association between iron metabolism and light injury resulting from 3d of blue LED light exposure, as shown in Figure 8A. The ferroxidase ceruloplasmin (CP) that functions as an antioxidant (Figure 8B) by oxidizing iron from its ferrous (Fe2+) to ferric (Fe3+) form, ferritin (Ft; Figure 8C) for iron storage and ferroportin (Fpn; Figure 8D) for iron transportation were up-regulated, but transferrin (Tf; Figure 8E) and the transferrin receptor (TrfR; Figure 8F) for iron transportation between membranes were down-regulated as the wavelength decreased.
Figure 8. WB assay of iron metabolism markers.
A strong association between iron metabolism and light injury resulting from 3d of blue LED light exposure (A); CP (B), Ft (C); and Fpn (D) were up-regulated, but Tf (E) and the TrfR (F) were down-regulated as the wavelength decreased; n=8 for the control group and each exposure group. aP<0.05, bP<0.01, cP<0.001 compared with the control group.
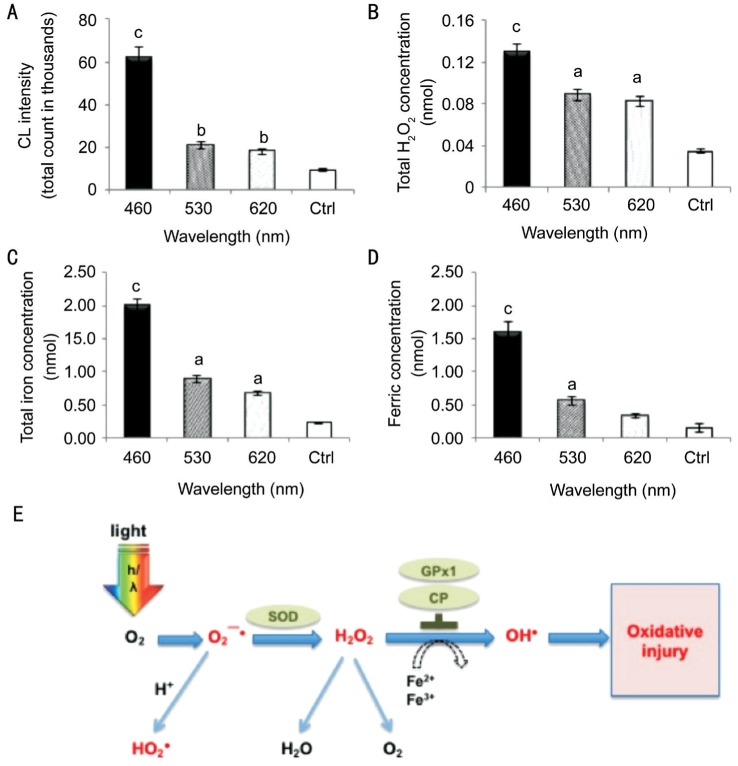
In Figure 9A, the O2−· levels were significantly increased and reached 60 000 after 3d of blue LED light exposure. The green and red LED light exposure groups accumulated smaller total counts, mostly less than 20 000. In Figure 9B, light exposure increased the H2O2 concentrations in the retina, which indicates that ROS accumulation is involved in light-induced RPI. Blue LED light stimulated H2O2 production to the highest concentration of 0.13 nmol/retina, whereas the green and red groups had 0.089 and 0.083 nmol/retina, respectively. In Figure 9C, the total iron concentration in the retina was also dominated by the LED light exposure. All three LED light exposures significantly increased the total iron concentration. Blue LED light exposure significantly increased the total iron concentration to 2 nmol/retina, and the normal retina only contained 0.35 nmol/retina of total iron. The longer wavelength exposures alsoincreased the total iron concentration. The green LED group increased to 1 nmol/retina and the red LED group increased to 0.89 nmol/retina. In Figure 9D, the Fe3+ concentration in the retina also corresponded to the LED light exposure, which also demonstrated the oxidative effects from exposure to LED lights with different wavelengths (P<0.001 for the blue light group by ANOVA followed by the Tukey's post hoc test).
Figure 9. Iron metabolism and superoxide products.
A: Lucigenin-stimulated superoxide O2−· had reached 60 000 of CL, and the green and red LED light exposure groups accumulated 10 000 to 20 000 of CL in 8min after 3d of blue LED light exposure; B: Blue light exposure increased H2O2 concentrations and reached a high concentration of 0.13 nmol/retina, whereas the green and red groups contained 0.089 to 0.083 nmol/retina, respectively; C: Blue LED light exposure significantly increased the total iron concentration to 2 nmol/retina, whereas the normal retina only contains 0.23 nmol/retina of total iron. The longer wavelength exposures also increased the total iron concentration. The green LED group increased to 1 nmol/retina and the red LED group increased to 0.89 nmol/retina; D: Blue LED light exposure significantly increased the ferric concentration to 1.6 nmol/retina, whereas the normal retina only contains 0.15 nmol/retina. The green LED exposure increased to 0.56 nmol/retina and the red LED exposure increased to 0.33 nmol/retina. n=6 for controls and n=8 for each exposure group (aP<0.05, bP<0.01, cP<0.001 compared with the control group). E: Diagram of the oxidative pathway in the outer retina and RPE. As the retina absorbed the light under a high O2 condition, O2−· is initially generated and converted to H2O2, then ultimately to H2O. The O2−· could easily convert to a toxic hydroperoxyl radical (HO2·) during the process. The abnormal accumulation of H2O2 under the high iron condition leads to a Fe2+ being converted to the more injurious Fe3+. Although the Fe2+-melanin complex is readily oxidized by H2O2 and O2, few highly noxious hydroxyl radicals (OH·) escape the melanin polymer via a Fenton reaction and may develop injurious reactions. (Concept modified from Rozanowska, Malgorzata Barbara, 2009. http://www.photobiology.info/Rozanowska.html accessed 18 March 2015).
DISCUSSION
Excessive LED light exposure presents a potential hazard to retinal function[2]. Our previous study reported that a white light LED is more likely to induce RPI than is a CFL[3]. In the present study, we used the same irradiance level (102 µW/cm2) for three light sources to conduct a more sophisticated experiment. This study analyzed the three major components of white light. As shown in Figure 2 (ERG), Figure 3 (H&E), and Figure 4 (TEM), the functional and morphological results suggested the blue light contributed the most to the RPI. The wavelength-dependent effect from the recent studies by Jaadane et al[14], Bennet et al[6] and Knels et al[7] have similar results regardless of the different LED exposure intensities, durations, and experimental settings. Furthermore, the results agreed with the claim that wavelength is the determining factor rather than the total light irradiance[7] in terms of RPI.
The retina is a high oxygen environment with high oxygen tensions close to 70 mm Hg[36], which is ideal for ROS formation. Absorption spectra explain how light absorption changes by wavelength[37]. The exposure of blue light increased the vulnerability to oxidative stress. The defense function in the retina creates high oxidative stress, which makes it extremely susceptible to RPI as reported by many previous studies[6]–[7],[10],[12],[14]–[18],[22],[26]–[27],[30],[38]–[42].
Our results demonstrated that ROS accumulation was involved in RPI. ROS caused cellular damage by attacking the macromolecules within the cells when the light exposure duration exceeds its threshold[43]. The oxidative stress markers such as 8-OHdG, acrolein and nitrotyrosine noticeably increased in the blue light-exposed retinas. The caspase-independent apoptotic marker, PARP-1, was significantly up-regulated in blue and green light-induced photoreceptor cell apoptosis after light exposure. This indicated the initiation of the retina cell apoptotic pathway. Furthermore, the antioxidant enzymes were produced to defend the insult, and the phagocytosis of toxicants or damaged debris by macrophage leading to the retina thickness decrease.
Apoptosis plays a major role in retinal visual cell loss[26],[44]–[48]. The caspase-dependent and caspase-independent pathways are the two major apoptotic pathways associated with retinal light injury have been reported[10],[14],[18],[26]–[27],[49]–[57]. There are varies reports regarding caspase involvement in retinal light injury. As previously reported, prolonged white light exposure does not activate caspase-3 protein expression[49], while blue light exposure increases its expression and leads to its activation[55]. The classical caspase did not show a consistent wavelength-dependent expression in our experiment, but the caspase-independent marker has in another report[57]. PARP-1 can induce apoptotic cell death when it is over-stimulated by excessive oxidant-induced DNA damage[27]. The cleavage of PARP-1 inhibits the enzyme responding to DNA damage and secures substantial energy pools in the cells allowing the arranged cascade activities to occur in this type of apoptotic event[27],[53]. Aydin and his colleagues also reported the retinal endoilluminator toxicity of xenon and LED light source in a rabbit model[43]. Although this study did not directly match our experimental setting, it explained the potential effect of LED retinal light injury in different operation conditions.
As the retina absorbed the light under a high oxygen (O2) condition, O2−· was initially generated and converted by anti-oxidant enzymes to H2O2 and then ultimately to H2O[36]. However, excessive short-wavelength light causes an imbalance in this conversion. Blue light irradiation accelerates the mitochondrial superoxide radicals formation[7]. The O2−· radicals can be easily converted to toxic hydroperoxyl radicals (HO2·). Under the high iron condition, the abnormal accumulation of H2O2 can lead to a Fe2+ oxidationto Fe3+[29],[58]. Although the Fe2+-melanin complex is readily oxidized by H2O2 and O2, few highly noxious hydroxyl radicals (OH·) may escape from the melanin polymer via the quick interaction of melanin and OH·, causing further oxidative injuries. The above-mentioned process is illustrated in Figure 9E.
In conclusion, the formation of ROS, lipid peroxidation, and the weakening of phagocytosis and POS digestion by RPE cells are thought to be the mechanism of iron-induced retinal toxicity[29]. The increased Ft, Fpn, and CP (Figure 8) suggest that the retinal cells detected an increase in intracellular iron, which could be a sign for iron accumulation in all exposure groups. The strong expression of HO-1 in the blue light exposure group indicates its anti-oxidative function as reported by several publications[20],[39],[59]. In contrast, HO-1 could also catalyze Fe2+ and carbon monoxide production, which may potentially exacerbate oxidative stress by generating free radicals[30]. Moreover, SOD2 encoded by distinctive nuclear gene is localized in the mitochondrial matrix and converts the O2−· generated by aerobic respiration to H2O2. This is the critical cell defense mechanism against the oxidative stress as reported previously[22],[35],[60]. The activation of cytosolic GPx1 in the outer retina may also be an important factor in the response to photo-oxidative stress mitigating retinal lipid peroxidation, and CP acts as an antioxidant by oxidizing iron from its Fe2+ to Fe3+ form. The concomitant activation of several antioxidants in the same detoxification pathway could possibly be an indicator of short wavelength cytotoxicity superinduction[35]. These defense gene expressions support that light-induced retinal degeneration involves oxidative stress[36]. We thus propose an iron-related RPI pathway, as shown in Figure 9E, based on these findings.
The continual development of blue light-based electrical panels and much brighter lighting environments pose concerns for retinal safety. The experimental results have confirmed that the general finding of the increased RPI from blue light found from in vitro and anesthetized-animal studies applies to a free-running animal model. It also showed a greater risk of LED blue-light injury in awake, task-oriented rod-dominant animals. Four dependent effects are considered with light-induced retinal injury, including wavelength-, oxygen-, iron- (site-specific), and time/dose-dependent effects, which indicate a cumulative effect and a possible association with chronic ocular diseases. The associated oxidatively damaged biomolecules, cell destruction, and chronic inflammation should be carefully considered when switching to LED lighting. However, the exact mechanism underlying these effects will be the subject of ongoing investigation with more analytical methods. The interpretation from the animal study to human applications should also be carefully considered based on the risk assessment perspective.
Acknowledgments
We thank Miss Zi-Yun Weng and Mr. Bo-Lin Feng for data analysis.
Foundation: Supported by Taiwan Ministry of Science and Technology grant (No.NSC 103-2314-B-002-076-MY3).
Authors' Contributions: Shang YM: designed and developed the study, analyzed the data and prepared the manuscript; Wang GS: contributed in the study development and data analysis as well as manuscript revision; Sliney DH: revised the study design and manuscript as well as scientific collaboration; Yang CH: coordinated in activities related to ophthalmology and retinal pathology; Lee LL: coordinated in light source photometry and radiometry testing and analysis. All the authors read and approved the final manuscript.
Conflicts of Interest: Shang YM, None; Wang GS, None; Sliney DH, None; Yang CH, None; Lee LL, None.
REFERENCES
- 1.Sanderson SW, Simons KL. Light emitting diodes and the lighting revolution: The emergence of a solid-state lighting industry. Research Policy. 2014;43(10):1730–1746. [Google Scholar]
- 2.Behar-Cohen F, Martinsons C, Vienot F, Zissis G, Barlier-Salsi A, Cesarini JP, Enouf O, Garcia M, Picaud S, Attia D. Light-emitting diodes (LED) for domestic lighting: any risks for the eye? Prog Retin Eye Res. 2011;30(4):239–257. doi: 10.1016/j.preteyeres.2011.04.002. [DOI] [PubMed] [Google Scholar]
- 3.Shang YM, Wang GS, Sliney D, Yang CH, Lee LL. White light-emitting diodes (LEDs) at domestic lighting levels and retinal injury in a rat model. Environ Health Perspect. 2014;122(3):269–276. doi: 10.1289/ehp.1307294. [DOI] [PMC free article] [PubMed] [Google Scholar]
- 4.Organisciak D, Zarbin M. Retinal photic injury. In: Levin LA, Albert DM, editors. Ocular Disease Mechanisms and Management. London: Elsevier; 2010. pp. 499–505. [Google Scholar]
- 5.van Norren D, Gorgels TG. The action spectrum of photochemical damage to the retina: a review of monochromatic threshold data. Photochem Photobiol. 2011;87(4):747–753. doi: 10.1111/j.1751-1097.2011.00921.x. [DOI] [PubMed] [Google Scholar]
- 6.Bennet D, Kim MG, Kim S. Light-induced anatomical alterations in retinal cells. Anal Biochem. 2013;436(2):84–92. doi: 10.1016/j.ab.2013.01.025. [DOI] [PubMed] [Google Scholar]
- 7.Knels L, Valtink M, Roehlecke C, Lupp A, de la Vega J, Mehner M, Funk RH. Blue light stress in retinal neuronal (R28) cells is dependent on wavelength range and irradiance. Eur J Neurosci. 2011;34(4):548–558. doi: 10.1111/j.1460-9568.2011.07790.x. [DOI] [PubMed] [Google Scholar]
- 8.Ueda T, Nakanishi-Ueda T, Yasuhara H, Koide R, Dawson WW. Eye damage control by reduced blue illumination. Exp Eye Res. 2009;89(6):863–868. doi: 10.1016/j.exer.2009.07.018. [DOI] [PubMed] [Google Scholar]
- 9.Osborne NN, Li GY, Ji D, Mortiboys HJ, Jackson S. Light affects mitochondria to cause apoptosis to cultured cells: possible relevance to ganglion cell death in certain optic neuropathies. J Neurochem. 2008;105(5):2013–2028. doi: 10.1111/j.1471-4159.2008.05320.x. [DOI] [PubMed] [Google Scholar]
- 10.Seko Y, Pang J, Tokoro T, Ichinose S, Mochizuki M. Blue light-induced apoptosis in cultured retinal pigment epithelium cells of the rat. Graefes Arch Clin Exp Ophthalmol. 2001;239(1):47–52. doi: 10.1007/s004170000220. [DOI] [PubMed] [Google Scholar]
- 11.Pang J, Seko Y, Tokoro T, Ichinose S, Yamamoto H. Observation of ultrastructural changes in cultured retinal pigment epithelium following exposure to blue light. Graefes Arch Clin Exp Ophthalmol. 1998;236(9):696–701. doi: 10.1007/s004170050143. [DOI] [PubMed] [Google Scholar]
- 12.Kuse Y, Ogawa K, Tsuruma K, Shimazawa M, Hara H. Damage of photoreceptor-derived cells in culture induced by light emitting diode-derived blue light. Sci Rep. 2014;4:5223. doi: 10.1038/srep05223. [DOI] [PMC free article] [PubMed] [Google Scholar]
- 13.Ogawa K, Kuse Y, Tsuruma K, Kobayashi S, Shimazawa M, Hara H. Protective effects of bilberry and lingonberry extracts against blue light-emitting diode light-induced retinal photoreceptor cell damage in vitro. BMC Complement Altern Med. 2014;14:120. doi: 10.1186/1472-6882-14-120. [DOI] [PMC free article] [PubMed] [Google Scholar]
- 14.Jaadane I, Boulenguez P, Chahory S, Carre S, Savoldelli M, Jonet L, Behar-Cohen F, Martinsons C, Torriglia A. Retinal damage induced by commercial light emitting diodes (LEDs) Free Radic Biol Med. 2015;84:373–384. doi: 10.1016/j.freeradbiomed.2015.03.034. [DOI] [PubMed] [Google Scholar]
- 15.Geiger P, Barben M, Grimm C, Samardzija M. Blue light-induced retinal lesions, intraretinal vascular leakage and edema formation in the all-cone mouse retina. Cell Death Dis. 2015;6:e1985. doi: 10.1038/cddis.2015.333. [DOI] [PMC free article] [PubMed] [Google Scholar]
- 16.Narimatsu T, Negishi K, Miyake S, Hirasawa M, Osada H, Kurihara T, Tsubota K, Ozawa Y. Blue light-induced inflammatory marker expression in the retinal pigment epithelium-choroid of mice and the protective effect of a yellow intraocular lens material in vivo. Exp Eye Res. 2015;132:48–51. doi: 10.1016/j.exer.2015.01.003. [DOI] [PubMed] [Google Scholar]
- 17.Yu ZL, Qiu S, Chen XC, Dai ZH, Huang YC, Li YN, Cai RH, Lei HT, Gu HY. Neuroglobin - A potential biological marker of retinal damage induced by LED light. Neuroscience. 2014;270:158–167. doi: 10.1016/j.neuroscience.2014.04.013. [DOI] [PubMed] [Google Scholar]
- 18.Kim GH, Kim HI, Paik SS, Jung SW, Kang S, Kim IB. Functional and morphological evaluation of blue light-emitting diode-induced retinal degeneration in mice. Graefes Arch Clin Exp Ophthalmol. 2016;254(4):705–716. doi: 10.1007/s00417-015-3258-x. [DOI] [PubMed] [Google Scholar]
- 19.Wu J, Chen E, Soderberg PG. Failure of ascorbate to protect against broadband blue light-induced retinal damage in rat. Graefes Arch Clin Exp Ophthalmol. 1999;237(10):855–860. doi: 10.1007/s004170050323. [DOI] [PubMed] [Google Scholar]
- 20.Roehlecke C, Schaller A, Knels L, Funk RH. The influence of sublethal blue light exposure on human RPE cells. Mol Vis. 2009;15:1929–1938. [PMC free article] [PubMed] [Google Scholar]
- 21.Chamorro E, Bonnin-Arias C, Perez-Carrasco MJ, Munoz de Luna J, Vazquez D, Sanchez-Ramos C. Effects of light-emitting diode radiations on human retinal pigment epithelial cells in vitro. Photochem Photobiol. 2013;89(2):468–473. doi: 10.1111/j.1751-1097.2012.01237.x. [DOI] [PubMed] [Google Scholar]
- 22.King A, Gottlieb E, Brooks DG, Murphy MP, Dunaief JL. Mitochondria-derived reactive oxygen species mediate blue light-induced death of retinal pigment epithelial cells. Photochem Photobiol. 2004;79(5):470–475. doi: 10.1562/le-03-17.1. [DOI] [PubMed] [Google Scholar]
- 23.Lascaratos G, Ji D, Wood JP, Osborne NN. Visible light affects mitochondrial function and induces neuronal death in retinal cell cultures. Vision Res. 2007;47(9):1191–1201. doi: 10.1016/j.visres.2006.12.014. [DOI] [PubMed] [Google Scholar]
- 24.Bravo-Nuevo A, Williams N, Geller S, Stone J. Mitochondrial deletions in normal and degenerating rat retina. Adv Exp Med Biol. 2003;533:241–248. doi: 10.1007/978-1-4615-0067-4_30. [DOI] [PubMed] [Google Scholar]
- 25.Huang H, Li F, Alvarez RA, Ash JD, Anderson RE. Downregulation of ATP synthase subunit-6, cytochrome c oxidase-III, and NADH dehydrogenase-3 by bright cyclic light in the rat retina. Invest Ophthalmol Vis Sci. 2004;45(8):2489–2496. doi: 10.1167/iovs.03-1081. [DOI] [PubMed] [Google Scholar]
- 26.Donovan M, Cotter TG. Caspase-independent photoreceptor apoptosis in vivo and differential expression of apoptotic protease activating factor-1 and caspase-3 during retinal development. Cell Death Differ. 2002;9(11):1220–1231. doi: 10.1038/sj.cdd.4401105. [DOI] [PubMed] [Google Scholar]
- 27.Wenzel A, Grimm C, Samardzija M, Reme CE. Molecular mechanisms of light-induced photoreceptor apoptosis and neuroprotection for retinal degeneration. Prog Retin Eye Res. 2005;24(2):275–306. doi: 10.1016/j.preteyeres.2004.08.002. [DOI] [PubMed] [Google Scholar]
- 28.Dunaief JL. Iron induced oxidative damage as a potential factor in age-related macular degeneration: the Cogan Lecture. Invest Ophthalmol Vis Sci. 2006;47(11):4660–4664. doi: 10.1167/iovs.06-0568. [DOI] [PubMed] [Google Scholar]
- 29.Ugarte M, Osborne NN, Brown LA, Bishop PN. Iron, zinc, and copper in retinal physiology and disease. Surv Ophthalmol. 2013;58(6):585–609. doi: 10.1016/j.survophthal.2012.12.002. [DOI] [PubMed] [Google Scholar]
- 30.Hadziahmetovic M, Kumar U, Song Y, Grieco S, Song D, Li Y, Tobias JW, Dunaief JL. Microarray analysis of murine retinal light damage reveals changes in iron regulatory, complement, and antioxidant genes in the neurosensory retina and isolated RPE. Invest Ophthalmol Vis Sci. 2012;53(9):5231–5241. doi: 10.1167/iovs.12-10204. [DOI] [PMC free article] [PubMed] [Google Scholar]
- 31.Marc RE, Jones BW, Watt CB, Vazquez-Chona F, Vaughan DK, Organisciak DT. Extreme retinal remodeling triggered by light damage: implications for age related macular degeneration. Mol Vis. 2008;14:782–806. [PMC free article] [PubMed] [Google Scholar]
- 32.Jones BW, Marc RE. Retinal remodeling during retinal degeneration. Exp Eye Res. 2005;81(2):123–137. doi: 10.1016/j.exer.2005.03.006. [DOI] [PubMed] [Google Scholar]
- 33.Hsu YJ, Wang LC, Yang WS, Yang CM, Yang CH. Effects of fenofibrate on adiponectin expression in retinas of streptozotocin-induced diabetic rats. Journal of diabetes research. 2014;2014:540326. doi: 10.1155/2014/540326. [DOI] [PMC free article] [PubMed] [Google Scholar]
- 34.Gordon WC, Casey DM, Lukiw WJ, Bazan NG. DNA damage and repair in light-induced photoreceptor degeneration. Invest Ophthalmol Vis Sci. 2002;43(11):3511–3521. [PubMed] [Google Scholar]
- 35.Meewes C, Brenneisen P, Wenk J, Kuhr L, Ma W, Alikoski J, Poswig A, Krieg T, Scharffetter-Kochanek K. Adaptive antioxidant response protects dermal fibroblasts from UVA-induced phototoxicity. Free Radic Biol Med. 2001;30(3):238–247. doi: 10.1016/s0891-5849(00)00463-9. [DOI] [PubMed] [Google Scholar]
- 36.Boulton M, Rozanowska M, Rozanowski B. Retinal photodamage. J Photochem Photobiol B. 2001;64(2-3):144–161. doi: 10.1016/s1011-1344(01)00227-5. [DOI] [PubMed] [Google Scholar]
- 37.Sliney DH. How light reaches the eye and its components. Int J Toxicol. 2002;21(6):501–509. doi: 10.1080/10915810290169927. [DOI] [PubMed] [Google Scholar]
- 38.Organisciak DT, Darrow RM, Rapp CM, Smuts JP, Armstrong DW, Lang JC. Prevention of retinal light damage by zinc oxide combined with rosemary extract. Mol Vis. 2013;19:1433–1445. [PMC free article] [PubMed] [Google Scholar]
- 39.Organisciak D, Wong P, Rapp C, Darrow R, Ziesel A, Rangarajan R, Lang J. Light-induced retinal degeneration is prevented by zinc, a component in the age-related eye disease study formulation. Photochem Photobiol. 2012;88(6):1396–1407. doi: 10.1111/j.1751-1097.2012.01134.x. [DOI] [PMC free article] [PubMed] [Google Scholar]
- 40.Dong A, Shen J, Krause M, Akiyama H, Hackett SF, Lai H, Campochiaro PA. Superoxide dismutase 1 protects retinal cells from oxidative damage. J Cell Physiol. 2006;208(3):516–526. doi: 10.1002/jcp.20683. [DOI] [PubMed] [Google Scholar]
- 41.Zhang TZ, Fan B, Chen X, Wang WJ, Jiao YY, Su GF, Li GY. Suppressing autophagy protects photoreceptor cells from light-induced injury. Biochem Biophys Res Commun. 2014;450(2):966–972. doi: 10.1016/j.bbrc.2014.06.082. [DOI] [PubMed] [Google Scholar]
- 42.Hahn P, Lindsten T, Lyubarsky A, Ying GS, Pugh EN, Jr, Thompson CB, Dunaief JL. Deficiency of Bax and Bak protects photoreceptors from light damage in vivo. Cell Death Differ. 2004;11(11):1192–1197. doi: 10.1038/sj.cdd.4401486. [DOI] [PubMed] [Google Scholar]
- 43.Aydin B, Dinc E, Yilmaz SN, Altiparmak UE, Yulek F, Ertekin S, Yilmaz M, Yakın M. Retinal endoilluminator toxicity of xenon and light-emitting diode (LED) light source: rabbit model. Cutan Ocul Toxicol. 2014;33(3):192–196. doi: 10.3109/15569527.2013.832282. [DOI] [PubMed] [Google Scholar]
- 44.Chang GQ, Hao Y, Wong F. Apoptosis: final common pathway of photoreceptor death in rd, rds, and rhodopsin mutant mice. Neuron. 1993;11(4):595–605. doi: 10.1016/0896-6273(93)90072-y. [DOI] [PubMed] [Google Scholar]
- 45.Portera-Cailliau C, Sung CH, Nathans J, Adler R. Apoptotic photoreceptor cell death in mouse models of retinitis pigmentosa. Proc Natl Acad Sci U S A. 1994;91(3):974–978. doi: 10.1073/pnas.91.3.974. [DOI] [PMC free article] [PubMed] [Google Scholar]
- 46.van Soest S, Westerveld A, de Jong PT, Bleeker-Wagemakers EM, Bergen AA. Retinitis pigmentosa: defined from a molecular point of view. Surv Ophthalmol. 1999;43(4):321–334. doi: 10.1016/s0039-6257(98)00046-0. [DOI] [PubMed] [Google Scholar]
- 47.Dunaief JL, Dentchev T, Ying GS, Milam AH. The role of apoptosis in age-related macular degeneration. Arch Ophthalmol. 2002;120(11):1435–1442. doi: 10.1001/archopht.120.11.1435. [DOI] [PubMed] [Google Scholar]
- 48.Boulton ME, Mitter SK, Rao HV, Dunn WA. Cell Death, Apoptosis, and autophagy in retinal injury. In: Ryan SJ, Schachat AP, Wilkinson CP, Hinton DR, Sadda S, Wiedemann P, editors. Retina. 5th. London: Elsevier; 2013. pp. 537–552. [Google Scholar]
- 49.Li F, Cao W, Anderson RE. Alleviation of constant-light-induced photoreceptor degeneration by adaptation of adult albino rat to bright cyclic light. Invest Ophthalmol Vis Sci. 2003;44(11):4968–4975. doi: 10.1167/iovs.03-0140. [DOI] [PubMed] [Google Scholar]
- 50.Chahory S, Keller N, Martin E, Omri B, Crisanti P, Torriglia A. Light induced retinal degeneration activates a caspase-independent pathway involving cathepsin D. Neurochem Int. 2010;57(3):278–287. doi: 10.1016/j.neuint.2010.06.006. [DOI] [PubMed] [Google Scholar]
- 51.Tomita H, Kotake Y, Anderson RE. Mechanism of protection from light-induced retinal degeneration by the synthetic antioxidant phenyl-N-tert-butylnitrone. Invest Ophthalmol Vis Sci. 2005;46(2):427–434. doi: 10.1167/iovs.04-0946. [DOI] [PubMed] [Google Scholar]
- 52.Sanvicens N, Gomez-Vicente V, Masip I, Messeguer A, Cotter TG. Oxidative stress-induced apoptosis in retinal photoreceptor cells is mediated by calpains and caspases and blocked by the oxygen radical scavenger CR-6. J Biol Chem. 2004;279(38):39268–39278. doi: 10.1074/jbc.M402202200. [DOI] [PubMed] [Google Scholar]
- 53.Yu SW, Wang H, Poitras MF, Coombs C, Bowers WJ, Federoff HJ, Poirier GG, Dawson TM, Dawson VL. Mediation of poly(ADP-ribose) polymerase-1-dependent cell death by apoptosis-inducing factor. Science. 2002;297(5579):259–263. doi: 10.1126/science.1072221. [DOI] [PubMed] [Google Scholar]
- 54.Sparrow JR, Cai B. Blue light-induced apoptosis of A2E-containing RPE: involvement of caspase-3 and protection by Bcl-2. Invest Ophthalmol Vis Sci. 2001;42(6):1356–1362. [PubMed] [Google Scholar]
- 55.Wu J, Gorman A, Zhou X, Sandra C, Chen E. Involvement of caspase-3 in photoreceptor cell apoptosis induced by in vivo blue light exposure. Invest Ophthalmol Vis Sci. 2002;43(10):3349–3354. [PubMed] [Google Scholar]
- 56.Lohr HR, Kuntchithapautham K, Sharma AK, Rohrer B. Multiple, parallel cellular suicide mechanisms participate in photoreceptor cell death. Exp Eye Res. 2006;83(2):380–389. doi: 10.1016/j.exer.2006.01.014. [DOI] [PubMed] [Google Scholar]
- 57.Li GY, Osborne NN. Oxidative-induced apoptosis to an immortalized ganglion cell line is caspase independent but involves the activation of poly(ADP-ribose)polymerase and apoptosis-inducing factor. Brain Res. 2008;1188:35–43. doi: 10.1016/j.brainres.2007.10.073. [DOI] [PubMed] [Google Scholar]
- 58.Rozanowski B, Burke JM, Boulton ME, Sarna T, Rozanowska M. Human RPE melanosomes protect from photosensitized and iron-mediated oxidation but become pro-oxidant in the presence of iron upon photodegradation. Invest Ophthalmol Vis Sci. 2008;49(7):2838–2847. doi: 10.1167/iovs.08-1700. [DOI] [PubMed] [Google Scholar]
- 59.Mandal MN, Patlolla JM, Zheng L, Agbaga MP, Tran JT, Wicker L, Kasus-Jacobi A, Elliott MH, Rao CV, Anderson RE. Curcumin protects retinal cells from light-and oxidant stress-induced cell death. Free Radic Biol Med. 2009;46(5):672–679. doi: 10.1016/j.freeradbiomed.2008.12.006. [DOI] [PMC free article] [PubMed] [Google Scholar]
- 60.Justilien V, Pang JJ, Renganathan K, Zhan X, Crabb JW, Kim SR, Sparrow JR, Hauswirth WW, Lewin AS. SOD2 knockdown mouse model of early AMD. Invest Ophthalmol Vis Sci. 2007;48(10):4407–4420. doi: 10.1167/iovs.07-0432. [DOI] [PMC free article] [PubMed] [Google Scholar]


