Abstract
Resolving the conformational dynamics of large multidomain proteins has proven to be a significant challenge. Here we use a variety of techniques to dissect the roles of individual protein kinase Cα (PKCα) regulatory domains in maintaining catalytic autoinhibition. We find that whereas the pseudosubstrate domain is necessary for autoinhibition it is not sufficient. Instead, each regulatory domain (C1a, C1b, and C2) appears to strengthen the pseudosubstrate-catalytic domain interaction in a nucleotide-dependent manner. The pseudosubstrate and C1a domains, however, are minimally essential for maintaining the inactivated state. Furthermore, disrupting known interactions between the C1a and other regulatory domains releases the autoinhibited interaction and increases basal activity. Modulating this interaction between the catalytic and regulatory domains reveals a direct correlation between autoinhibition and membrane translocation following PKC activation.
Keywords: fluorescence resonance energy transfer (FRET), inhibition mechanism, protein domain, protein kinase C (PKC), protein translocation, signal transduction
Introduction
In response to extracellular stimuli, each eukaryotic kinase typically phosphorylates multiple substrates at distinct subcellular locations (1). To achieve this precise spatiotemporal control, the activity cycle of a kinase must be tightly regulated (2). For example, a kinase needs to be maintained in a catalytically inactive state despite high cytoplasmic ATP levels to prevent constitutive substrate phosphorylation (3). Given that the catalytic domains of eukaryotic kinases are structurally conserved (4, 5), kinase-specific regulation is often achieved by linking a catalytic domain to multiple modular protein domains with distinct functional properties (6–9). Resolving the roles of these individual domains in regulating the various states of the kinase, although, has proven challenging due to conformational dynamics (10), flexible domain linkers (11), and structurally disordered regions (12).
A classic example of multidomain kinases is the family of protein kinase C (PKC) isoforms. PKCs are serine/threonine kinases that are involved in diverse cellular functions, including cell growth, muscle contraction, immune response, and synaptic plasticity (13). They contain a variety of regulatory domains (PS, C1a, C1b, and C2 domains) that have individual roles in targeting and regulating the activity of the catalytic domain (14, 15). Although many of the isoforms of PKC have been well studied, resolving the regulatory domain interactions in the context of this large multidomain kinase has been a significant challenge. A partial crystal structure of AMP-PNP3-bound PKCβII was recently obtained, but the lack of electron density has made it difficult to resolve all of the domains (16, 17).
Here we use a variety of biochemical, biophysical, and cellular approaches to dissect the individual PKCα roles in regulatory domains during autoinhibition. We find that whereas the pseudosubstrate (PS) domain is necessary for autoinhibition it is not sufficient, and instead requires the concerted effects of both the PS and C1a domains. Together with previous work, we find that the role of the C1a domain during autoinhibition may in fact be to coordinate a network of interactions between the regulatory and catalytic domains. Finally, we use an orthogonal approach to mutation analysis to modulate the interaction between the catalytic and regulatory domains. We find that weakening catalytic-regulatory domain interactions is sufficient to not only disrupt autoinhibition, but also leads to increased protein translocation in cells.
Results
In this study, the PKCα FRET reporters are based around a FRET linker, which contains an ER/K α-helix, ∼10 nm in length, flanked by either mCerulean or eGFP (FRET donor) and mCitrine or mCherry (FRET acceptor) (Fig. 1A) (18). The ER/K FRET linker also contains an N-terminal tobacco etch virus (TEV) protease site for sensor cleavage, and each discrete unit of this ER/K linker is separated by (Gly-Ser-Gly)2–4 linkers (GSG) to provide rotational freedom. Sensors are abbreviated using the domains that flank the ER/K linker. For example, K-PS represents a sensor with the PS domain separated from the catalytic domain (K) by the ER/K FRET linker (–). In experimental schematics, “Domain X” is used to represent the regulatory domain(s) being tested.
FIGURE 1.
Pseudosubstrate is not sufficient for autoinhibition of PKCα. A, schematic of PKCα and the 10-nm ER/K linker cassette used in FRET sensors. Fluorophores used in the majority of experiments are mCerulean (mCer, FRET donor) and mCitrine (mCit, FRET acceptor). B, effector-independent activity of the catalytic domain of PKCα (K) compared with full-length PKCα with and without the PS domain and for catalytic domain sensors containing either the PS (K-PS) alone or all regulatory domains (K-RDs). ATPase activity resulting from ATP consumption during the phosphorylation reaction was monitored in the presence of 50 μm MBP peptide and 50 μm ATP at 21–22 °C and reported as mole of ATP per mol of protein per s or s−1. C, activity of the catalytic domain of PKCα in the presence of increasing PS domain or intact RDs. ATPase activity measurements were taken with 10 μm of both MBP peptide and ATP and corrected for background activity. D, ensemble binding of either PS alone or the RDs region to resin-bound catalytic domain in the presence or absence of 1 mm ATP. Binding was quantified by monitoring mCerulean (PS or RDs; 475 nm) and mCitrine (catalytic domain; 525 nm) fluorescence. To account for nonspecific interactions, binding to unlabeled resin was background subtracted. For all experiments, data are derived from at least three independent protein preparations with at least two measurements for each condition per preparation (mean ± S.E., n ≥ 3). In the schematics in C and D, Domain X represents either the PS or the RDs region of PKCα.
The Pseudosubstrate Domain Is Necessary but Not Sufficient for Autoinhibition
House and Kemp (19) were the first to identify and hypothesize that the “pseudosubstrate” site of PKCα interacts with its catalytic active site rendering it inactive. Indeed, in the absence of lipid and calcium activators, the PS domain is necessary to maintain a catalytically inactive state (p < 0.0001, Fig. 1B; 2 versus 3). To determine whether the PS domain is sufficient for autoinhibition, we first compared the activity of a catalytic domain sensor containing only the PS domain separated from the catalytic domain by our ER/K linker (K-PS) to one containing all of the regulatory domains (RDs) of PKCα (K-RDs) (20). The addition of the C1a, C1b, and C2 domains results in ∼42% more inhibition than the PS alone in our sensors (p < 0.0001; Fig. 1B; 4 versus 5). We next measured the activity of mCitrine-tagged catalytic domain in the presence of increasing concentrations of mCerulean-tagged PS or RDs. Substantially more PS domain is needed compared with the RDs to inhibit activity (IC50 ∼11 μm versus 80 nm; Fig. 1C). Together these activity-based experiments demonstrate that additional regulatory domains are required for autoinhibition. Furthermore, they suggest that the RDs region interacts more tightly with the catalytic domain than the PS alone. To test this, mCitrine-labeled kinase was bound to resin and incubated with mCerulean-labeled PS or RDs in the presence and absence of 1 mm ATP. After washing, binding was then assessed through fluorescence. Regardless of the nucleotide state, the RDs show significantly higher binding than the PS alone (p < 0.0001; Fig. 1D). Interestingly, significantly less binding is observed for both the PS (p < 0.01) and the RDs (p < 0.0001) in the absence of nucleotide.
Regulatory Domains Enhance the PS-catalytic Domain Interaction by FRET and BLItz
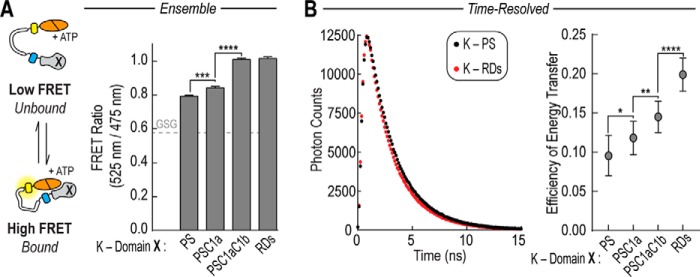
To explore the effect of individual regulatory domains on the PS-catalytic domain interaction, we first examined the ensemble FRET of a series of PKCα sensors in the presence of ATP (Fig. 2A). Although the addition of the C1a domain increases the interaction between the PS and catalytic domain, the C1b domain is required to reach a FRET level similar to the K-RDs sensor (Fig. 2A). As steady-state FRET is an intensity-based measurement, it is influenced by fluorophore orientation as well as distance between the FRET pair and the relative population of interacting and non-interacting states. We therefore used time-resolved FRET using time-correlated single photon counting (TCSPC) for more molecular information. We determined the average weighted lifetimes or 〈τFRET〉 by fitting the intensity decay data for each FRET sensor to a double exponential decay function as described under “Experimental Procedures.” We then calculated the energy transfer efficiency or E = 1 − 〈τFRET〉/τGFP, where τGFP is the average lifetime for an eGFP control (2.62 ± 0.03 ns)(Fig. 2B) (21). By TCSPC, the addition of C1a, C1b, and C2 each increase the efficiency of energy transfer.
FIGURE 2.
Regulatory domains enhance the PS-catalytic domain interaction by FRET. A, the basal FRET ratio (mCitrine 525 nm to mCerulean 475 nm) of FRET sensors in the presence of 100 μm ATP. Domain X represents the region of the regulatory domain being tested in the FRET sensor. B, TCSPC measurements for sensors. Sensors for TCSPC contained monomeric eGFP and mCherry fluorophores in place of mCerulean and mCitrine. The graph on the right shows representative data. The data were fit to a double exponential decay function to determine the amplitude-weighted lifetime or 〈τFRET〉. From this, the efficiency of energy transfer, 1 − 〈τFRET〉/τGFP, was calculated, where τGFP is the average lifetime of eGFP (see “Experimental Procedures”)(21). For all experiments, data are derived from at least three independent protein preparations with at least two measurements for each condition per preparation (mean ± S.E., n ≥ 3). *, p ≤ 0.05; **, p ≤ 0.01; ***, p ≤ 0.001; ****, p ≤ 0.0001 (Student's unpaired t test).
Together, both ensemble and time-resolved FRET measurements suggest that each regulatory domain contributes to the PS-catalytic domain interaction. Although there is no evidence for the self-association of PKC in the basal state, a number of studies have demonstrated that PKC is able to oligomerize in the presence of stimuli such as phosphatidylserine, diacylglycerol, and Ca2+ (22–25). Thus it is possible that in isolation these protein domains are able to interact through both inter- and intramolecular interactions that together contribute to the observed changes in FRET. However, given the relatively high concentration of the intramolecular interaction within both the SPASM sensors (∼10 μm (18)) and within the native PKC molecule where the domains are tethered in tandem, we suggest that our measurements likely reflect intramolecular, rather than inter-PKC interactions.
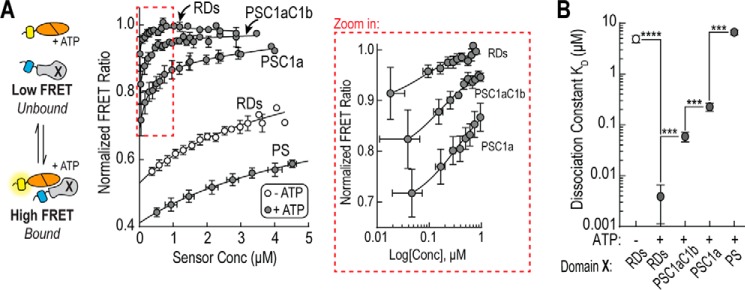
We next used bio-layer interferometry (BLItz) as an orthogonal assay to measure the effect of regulatory domains on the PS-catalytic domain dissociation rate (Fig. 3A). BLItz is based on bio-layer interferometry where changes in protein binding to a biosensor tip result in measurable changes in the interference pattern of light. By BLItz, having additional regulatory domains decreased the dissociation rate of the PS-catalytic domain interaction (Table 1, Fig. 3B). The degree of change between the PS and the RDs dissociation rates (∼3-fold), however, does not fit with the large difference observed in activity titration experiments (>100-fold; Fig. 1C). Due to this discrepancy, we turned to solution-based bimolecular FRET assays to determine the equilibrium constants (KD values).
FIGURE 3.
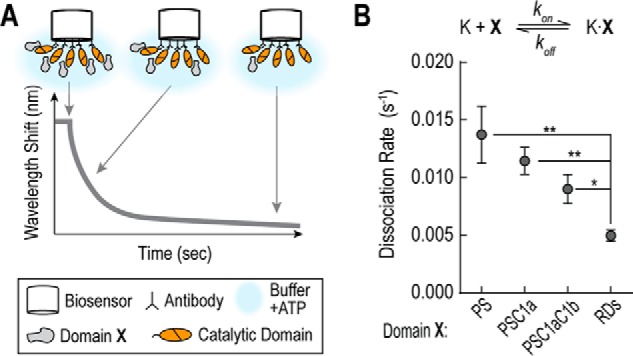
Regulatory domains decrease rate of PS-catalytic domain dissociation by BLItz. A, schematic of BLItz measurements. Domain X represents the region of the regulatory domain being tested in binding experiments. B, dissociation rates for PS-catalytic domain binding in the presence of additional regulatory domains. BLItz data are summarized in Table 1. Data are derived from ≥7 independent biosensor measurements from at least two separate protein batches (mean ± S.E., n ≥ 7). *, p ≤ 0.05; **, p ≤ 0.01 (Student's unpaired t test).
TABLE 1.
Biolayer interferometry koff measurements
All experiments are in the presence of 1 mm ATP. Mean ± S.E. n ≥ 7 (number of experiments).
| Regulatory domains | Dissociation rate (s−1), koff |
|---|---|
| PS | 0.014 ± 0.002 |
| PSC1a | 0.011 ± 0.001 |
| PSC1aC1b | 0.009 ± 0.001 |
| PSC1aC1bC2 | 0.005 ± 0.001 |
Regulatory Domains Significantly Increase Affinity of PS-Catalytic Domain Interaction
For bimolecular binding assays, we took advantage of the TEV protease site located between the FRET donor and the ER/K α-helix in our sensors. After purification, sensors were cleaved to obtain stoichiometrically equivalent amounts of mCit-tagged catalytic domain and mCer-tagged regulatory domain(s). Concentrated samples were serially diluted to reduce the fraction of equilibrium bound protein and then fit to determine KD values (18)(Fig. 4, Table 2). From this data, there were four main observations. First, the addition of each individual regulatory domain significantly increases PS binding (p < 0.001). Second, the largest relative drop in KD occurred upon addition of the C1a domain (∼30-fold). Third, in agreement with Fig. 1D, the interaction of the complete RDs with the catalytic domain is highly dependent on the presence of ATP (∼1000-fold). Fourth, the bimolecular data highlights that both the FRET sensors and BLItz assay only provided a qualitative readout as they are influenced by factors such as relative fluorophore orientation (FRET) and the interaction geometry (BLItz).
FIGURE 4.
Regulatory domains increase affinity of PS-catalytic domain interaction. A, equilibrium binding using bimolecular FRET. Right, bimolecular FRET ratio (mCit/mCer) as a function of protein concentration in the presence (dark circles) or absence (empty circles) of 1 mm ATP. Left, the region highlighted by the red box is re-plotted using a logarithmic scale. In the schematic, Domain X represents the region of the regulatory domain being used for binding experiments. Sensors were digested with TEV protease to cleave sensors into mCit-tagged catalytic domain and mCer-tagged regulatory domains. The bimolecular interaction was fit (solid line) as described under “Experimental Procedures” (18). B, average equilibrium constant (KD) for regulatory domain regions in the presence (dark circles) or absence (empty circle) of 1 mm ATP. Dissociation constants are summarized in Table 2. Data are derived at least three independent protein preparations with at least two measurements for each condition per preparation (mean ± S.E., n ≥ 3). ***, p ≤ 0.001; ****, p ≤ 0.0001 (Student's unpaired t test).
TABLE 2.
Steady-state KD measurements
Mean ± S.E. n ≥ 3 (number of protein preparations) is shown.
| + 1 mm ATP |
No ATP |
||
|---|---|---|---|
| + 0 mm KCl | + 100 mm KCl | + 0 mm KCl | |
| PS | 6.6 ± 0.7 μm (3) | 11.6 ± 2.0 μm (3) | |
| PSC1a | 0.23 ± 0.04 μm (3) | 0.23 ± 0.06 μm (4) | |
| PSC1aC1b | 0.059 ± 0.013 μm (3) | 0.082 ± 0.044 μm (3) | |
| PSC1aC1bC2 | 0.0039 ± 0.0028 μm (3) | 0.0045 ± 0.0023 μm (4) | 4.9 ± 0.7 μm (5) |
| PSC1a–C2 | 0.17 ± 0.04 μm (3) | ||
| PS–C1bC2 | 2.6 ± 0.4 μm (4) | ||
The C1a Domain Is Essential to Maintain the Autoinhibited State
To further investigate the contribution of each individual regulatory domain, we performed bimolecular FRET binding assays with the RDs region lacking the C1a, C1b, or C2 domains (Fig. 5A). Each domain significantly reduces the binding affinity for the catalytic domain (p < 0.001), but the largest effect occurs when the C1a domain is removed (∼4 nm to ∼3 μm). We next took full-length mCitrine-tagged PKCα and created a series of domain deletions. We compared the basal activity of these constructs (Fig. 5B), and only in the absence of the C1a domain is there a significant increase in basal activity (p < 0.0001). Together, these findings highlight the importance of the C1a domain, in contrast to previous studies that have primarily focused on C1b and C2 domains (16, 17).
FIGURE 5.
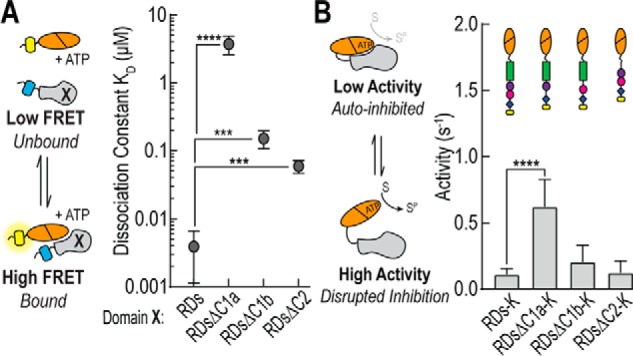
C1a is critical for regulatory domain binding. A, as described in the legend to Fig. 4, sensors lacking regions of the regulatory domain of PKCα were digested with TEV protease and the bimolecular interaction fit to determine equilibrium constants. In the schematic, Domain X represents the region of the regulatory domain being tested. B, effect of domain deletion on effector independent ATPase activity of PKCα. Schematics are included for each construct. Activity measurements were taken with 50 μm of both MBP peptide and ATP at 21–22 °C and are reported as mole of ATP per mol of protein per s or s−1. For all experiments, data are derived from at least three independent protein preparations with at least two measurements for each condition per preparation (mean ± S.E., n ≥ 3). ***, p ≤ 0.001; ****, p ≤ 0.0001 (Student's unpaired t test).
C1a Interactions with Other Regulatory Domains Are Important in Maintaining Autoinhibition
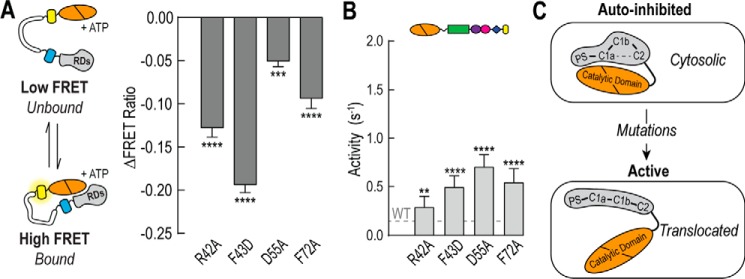
Previous work has suggested that the C1a domain may form intramolecular interactions with other regulatory domains in PKCα. To test the importance of these interactions on autoinhibition we tested four previously studied point mutations within the C1a domain. Three of these mutations (R42A, D55A, and F72A) have been identified as forming contacts with the C2 domain, two of which were tested through charge reversal (26). The fourth mutation (F43D) was recently identified and suggested to disrupt intramolecular contacts in PKCα (27). Indeed all four mutations disrupt both the interactions between the catalytic and regulatory domains and releases autoinhibition (Fig. 6, A and B). Together, these findings suggest that in addition to the PS domain, the C1a domain coordinates a network of domain-domain interactions in PKCα during autoinhibition (Fig. 6C).
FIGURE 6.
C1a mutations disrupt PKCα autoinhibition. A, the effect of C1a mutations on regulatory domain binding to the catalytic domain by FRET in the presence of 100 μm ATP. B, effector-independent ATPase activity of full-length PKCα containing C1a point mutations. For all FRET and activity measurements, data are derived from at least three independent protein preparations with at least two measurements for each condition per preparation (mean ± S.E., n ≥ 3). C, the C1a domain coordinates intramolecular interactions important in maintaining autoinhibition. Point mutations that are known to disrupt these interactions results in increased basal activity and membrane translocation. **, p ≤ 0.01; ***, p ≤ 0.001; ****, p ≤ 0.0001 (Student's unpaired t test).
Disrupting the Catalytic-Regulatory Domain Interaction Increases Membrane Translocation
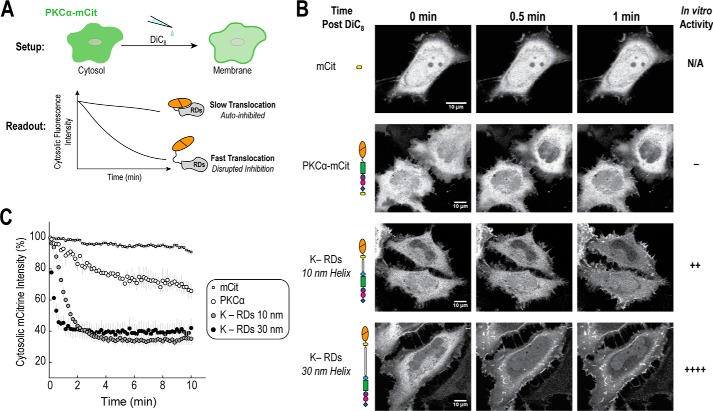
One of the common methods for identifying intramolecular interactions in classical PKC isoforms is to create mutations and measure changes in the rate of membrane translocation in cells upon stimulation. Faster translocation is then frequently interpreted as the disruption of a binding interface and exposure of an individual lipid-binding domain. For example, the four C1a mutations in Fig. 6 were previously tested and confirmed to increase translocation to the membrane (Fig. 6C) (26, 27). To understand the correlation between autoinhibition and translocation, we decided to take an alternative approach. As illustrated in Fig. 1B, the addition of the ER/K 10-nm linker between the catalytic and regulatory domains weakens autoinhibition. Previous work from our group has also shown that increasing this linker from 10 to 30 nm further releases autoinhibition (20). The advantage of using the 10- and 30-nm linker is that it does not directly disrupt any additional intramolecular contacts within the regulatory domains. Using this, we examined the rates of translocation for our 10- and 30-nm constructs compared with full-length PKCα in HeLa cells upon stimulation with calcium and 0.05 mg/ml of DiC8 lipid (Fig. 7). Indeed, the addition of a 10-nm linker dramatically increases the rate of translocation compared with full-length PKCα, and increasing the linker length from 10 to 30 nm further enhances this rate. These relative changes are also observed upon the addition of the phorbol ester phorbol 12-myristate 13-acetate (data not shown).
FIGURE 7.
Disrupting PKCα autoinhibition increases membrane translocation. A, upon stimulation with 0.05 mg/ml of DiC8 lipid, HeLa cells were imaged for 10 min at 22 °C using a confocal microscope. Movies were analyzed by selecting and monitoring fluorescence cytosolic intensity over time for three cytosolic regions per cell. B, representative images and C, analysis of one field of cells per condition (mean ± S.E., n ≥ 2 cells). For each condition, at least two independent experiments were performed and in total more than four cells per condition were analyzed. Autoinhibition was increasing disrupted by introducing either 10- or 30-nm ER/K linkers between the catalytic domain and regulatory domains, as previously described (20). The rate of translocation was compared with mCitrine-labeled full-length PKCα and a mCitrine (mCit) fluorophore control.
Discussion
For many kinases, autoinhibition is an essential mechanism to suppress basal activity. This is often achieved through interactions between the regulatory and catalytic domains that interfere with substrate binding to the active site (28). Resolving these interactions in large multidomain kinases, although, has been a significant challenge. In the case of PKC, a partial crystal structure of AMP-PNP-bound PKCβII was recently obtained, but there has been some controversy as to what domain(s) interact with the catalytic domain (16, 17). Additionally, it has been suggested that this structure represents a more “intermediate” state as opposed to the basal autoinhibited state, as it lacks both the C1a and the PS domains (14).
In this study, we find that both the PS and C1a domains act as a single structural unit to bind and suppress basal ATPase activity, and that the absence of either domain releases basal autoinhibition (Fig. 8). The importance of the C1a domain highlighted in this study is consistent with other findings in the PKC family. Kirwan et al. (29) used fragments of the regulatory domain of PKCα to inhibit lipid/Ca2+-activated full-length PKCα. In this context, the C1a domain was necessary to suppress the active kinase. Lopez-Garcia et al. (30) examined the basal activity of atypical PKCζ lacking regions of the regulatory domain. Surprisingly, removing the PS did not substantially activate the kinase. However, deletion of the single C1 domain substantially released autoinhibition (30). Together with our data, these studies suggest that the PS and C1a domains act together to directly interact and block catalytic activity of the kinase domain. The fact that in all PKC isoforms, the C1a domain (or C1 in the case of atypical PKCs) always follows the PS domain hints that this structural role may be highly conserved (14, 15).
FIGURE 8.
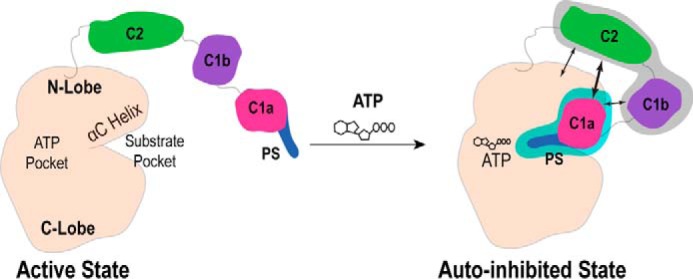
Coordinating the regulatory-catalytic domain interactions during autoinhibition. The PS and C1a domains operate as a single functional unit (blue region) that binds in a nucleotide-dependent manner and is necessary to maintain autoinhibition of PKCα. The C1a domain coordinates intramolecular interactions during this autoinhibited state, including direct C1a-C2 contacts (bold arrow)(22, 23, 26). The significance of the C1b and C2 domains is less clear (gray region), with conflicting literature evidence for C2-kinase (16) and C1b-kinase (17) interactions.
Previous studies have suggested that the C1 and C2 domains in PKCα form intramolecular contacts during the resting state of the kinase that regulate autoinhibition and are later disrupted upon lipid activation (22, 26). Here, we found that mutations that interfere with a C1a-C2 interaction also disrupt the binding between the catalytic and regulatory domains, leading to enhanced basal catalytic activity (Fig. 6). This suggests that C1a may also regulate inhibition indirectly by coordinating intramolecular interactions between other regulatory domains (Fig. 8). These results also highlight an often overlooked nuance of PKC mutation analysis. A mutation of a single residue may ultimately disrupt multiple intramolecular contacts due to the allosteric nature of PKC. As a result, the effects of a mutation may be context and assay dependent. For example, membrane translocation has frequently been used to assess specific domain-domain contacts. However, as our data illustrates, just weakening the association between the catalytic and regulatory domains is sufficient for increased translocation (Fig. 7). These findings illustrate the difficulty in interpreting the structural basis of point mutations in large multidomain proteins.
An interesting observation in our study is that the binding of the regulatory domains to the catalytic domain is also highly dependent on ATP (Figs. 1D and 4, and Table 2). There is precedence for nucleotide-dependent domain-domain affinity from work on PKA kinase. In PKA, the interaction between the catalytic subunit and type I regulatory subunits (which contain a pseudosubstrate region) show >1000-fold difference in KD in the presence of ATP (31). Beyond this, the effect of nucleotide binding on the conformation of multidomain kinases is unclear. The enhanced affinity of the regulatory-catalytic domain in the presence of nucleotide provides new context with which to consider recent work on PKC. First, the only partial crystal structure of full-length PKCβII is in the presence of AMP-PNP, a nucleotide analog (17). This is likely a result of increased stability in the nucleotide-bound state. Second, a study on PKCα found that occupancy of the nucleotide pocket induces a conformational change in the catalytic domain, which is important for priming and maturation of the kinase (32). Nucleotide binding also protects these priming sites from dephosphorylation by phosphatases (32, 33). One intriguing explanation is that the regulatory-catalytic domain interaction, which is significantly stronger in the presence of nucleotide, physically prevents phosphatases from accessing the phosphorylation sites on the catalytic domain. Finally, we recently observed that both PKC and PKA show positive cooperativity between substrate and ATP binding to the catalytic domain (34), which highlights a potentially conserved mechanism that drives catalytic-regulatory domain interactions.
Aberrant basal kinase activity is a frequent hallmark of oncogenic kinases (35). As highlighted in our study, however, activating point mutations can have variable effects on domain-domain interactions in multidomain proteins like PKC. Our study presents a series of tools and approaches that will provide new avenues for dissecting intramolecular interactions in multidomain kinases that can be harnessed in the design of new therapeutics.
Experimental Procedures
Reagents and Constructs
Myelin basic protein peptide (MBP peptide) was purchased from GenScript. Human PKCα cDNA was purchased from Open Biosystems as described previously (20). PKCα constructs were cloned using PCR (Expand High Fidelity PCR System, Sigma) or site-directed mutagenesis (Pfu-Turbo, Agilent) into either pBiex1 (Novagen) plasmid vector for Sf9 protein expression or pcDNA/FRT (Invitrogen) plasmid vector for mammalian expression. In FRET constructs containing the ER/K linker (Fig. 1A) (18, 20), regions are defined as follows: PS (amino acids 1–30), C1a (31–100), C1b (101–151), C2 (152–293), intact regulatory domain or RDs (1–293), and catalytic domain or K (335–672). For domain deletion constructs, missing regions were defined as follows: ΔPS (1–36), ΔC1a (32–100), ΔC1b (101–151), and ΔC2 (152–334). For bimolecular experiments, all PKC regions (except PS) were generated from FRET sensors using TEV digestion. PS (amino acids 1–30)-tagged with mCerulean was expressed and used for titration experiments in Fig. 1C. All constructs included a C-terminal FLAG tag for purification.
Insect Cell Expression and Protein Purification
pBiex1 vectors were transiently transfected into Sf9 insect cells cultured in Sf900-II media (Invitrogen) using Escort IV transfection reagent (Sigma) and Opti-MEM I (Life Technologies). Three days post-transfection, cells were lysed in 20 mm HEPES (pH 7.5), 200 mm NaCl, 4 mm MgCl2, 0.5% sucrose, 0.5% IGEPAL, 2 mm DTT, 50 μg/ml of PMSF, 5 μg/ml of aprotinin, and 5 μg/ml of leupeptin. Clarified lysate was incubated with anti-FLAG M2 affinity resin (Sigma) for 1 h. Resin was washed with 20 mm HEPES (pH 7.5), 150 mm NaCl, 10 mm MgCl2, 2 mm DTT, 50 μg/ml of PMSF, 5 μg/ml of aprotinin, and 5 μg/ml of leupeptin. Protein was eluted using FLAG peptide (Sigma), and buffer exchanged into PKC buffer (20 mm HEPES (pH 7.4), 5 mm MgCl2, 0.5 mm EGTA, and 2 mm DTT) using 7- or 40-kDa cutoff Zeba Spin Desalting Columns (Pierce) unless otherwise indicated. For bimolecular experiments, sensors were cleaved overnight at 4 °C with tobacco etch virus or TEV protease either while bound to FLAG-resin for isolation of individual domain regions (Figs. 1, B–D, and 3) or in solution after elution (Figs. 4 and 5A). Cleavage was assessed by SDS-PAGE gel analysis and comparing relative mCitrine and mCerulean fluorescence in the case of isolated domains. For all experiments kinase cleavage efficiency was ≥90%. Before each experiment, protein samples were centrifuged at >18,000 × g for 10 min to remove any precipitate. Protein concentration was determined from the fluorescent emission of mCitrine (excitation 490, emission 525 nm) or mCerulean (excitation 430, emission 475 nm) compared with fluorescent standards on a FluoroMax-4 fluorometer (Horiba, Scientific) or by eGFP absorbance on a NanoDrop One (Thermo).
ATPase Activity Assay
ATP consumed by the kinase-substrate interaction was measured by monitoring ATP consumption with the Kinase-Glo Max Luminescence Assay Kit (Promega). End-point luminescence was measured in white, 96-well plates using an M5e Spectramax spectrophotometer (Molecular Devices). Control experiments with only the kinase or the substrate showed negligible ATP consumption. All activity assays except in Fig. 1C were performed with 50 nm protein, 50 μm ATP, and 50 μm MBP peptide in PKC buffer at 21–22 °C. For Fig. 1C, the catalytic domain was used at 25 nm with 10 μm of both ATP and MBP peptide. Activity was corrected for nonspecific background activity at high protein concentrations. For each experiment, ≥2 experimental replicates were collected for ≥3 independent protein batches (n ≥ 3).
Pulldown Binding Experiments
All experiments were performed in PKC buffer containing 1 mm ATP and 1 mg/ml of BSA at 21–22 °C. In experiments, 500 nm mCerulean-labeled regulatory domain in solution was incubated with 10 μl of either blank FLAG resin (for background subtraction of nonspecific binding) or resin, containing 500 nm bound mCitrine-labeled catalytic domain. Reactions were incubated for 20 min at room temperature with shaking at 1000 rpm, and washed three times with reaction buffer. Resin was resuspended and domain binding was quantified via mCerulean levels on a FluoroMax-4 fluorometer (Horiba, Scientific). Measurements were background subtracted and normalized. For each experimental measurement, ≥2 experimental replicates were taken for ≥3 independent protein batches (n ≥ 3).
Steady-state FRET Measurements
All experiments were performed with 25–50 nm protein in PKC buffer containing 100 μm ATP at 21–22 °C. Samples were prepared in tubes pre-coated with 0.1 mg/ml of BSA to limit protein sticking to tube walls. Protein samples were excited at 430 nm (mCerulean) with an 8-nm bandpass, and emission monitored from 450 to 650 nm. The FRET ratio was calculated from the ratio of the emission for mCitrine (525 nm) to mCerulean (475 nm). For each experimental condition, ≥2 experimental replicates were measured for ≥3 independent protein batches (n ≥ 3).
Time-resolved FRET Measurements
Time-resolved fluorescence decay measurements were taken by single photon counting (SPC-130-EM, Becker & Hickl) using a 485-nm sub-nanosecond pulse diode laser (PicoQuant), a 520 ± 15-nm bandpass filter, and a PMH-100 photomultiplier module (Photonics Solutions) (36). In these experiments, sensors contained monomeric eGFP (37) and mCherry in place of mCerulean and mCitrine, respectively. Experiments were performed with 100–200 nm protein in PKC buffer containing 100 μm ATP and 0.1 mg/ml of BSA. The amplitude-weighted average lifetime, 〈τFRET〉 = (α1τ1 + α2τ2)/(α1+ α2), was generated by fitting the data to the double exponential decay α1e−t/τ1 + α2e−t/τ2, where α is amplitude and τ is lifetime. The efficiency of energy transfer was calculated as 1 − 〈τFRET〉/τGFP, where τGFP is the average lifetime for an eGFP control (2.62 ± 0.03 ns) (21). For each condition, ≥2 experimental replicates were measured for ≥3 independent protein batches (n ≥ 3).
BLItz Measurements
All experiments were performed in 20 mm HEPES (pH 7.4), 50 mm KCl, 2 mm MgCl2, 0.5 mm EGTA, 1 mm DTT, 1 mm ATP, 0.1 mg/ml of BSA, and 0.02% Tween 20 at 21–22 °C. Regulatory and catalytic domains were prepared by TEV protease as previously described. The construct for catalytic domain isolation contained an additional His6 tag for binding to HIS2K tips in the BLItz Pall ForteBio system. For each experimental condition, ≥3 independent biosensor measurements were taken for at least 2 protein batches (n ≥ 7).
Equilibrium Constants
Experiments were performed and analyzed as previously described (18). Constructs were purified at high concentrations (∼2–20 μm) and cleaved by TEV proteolysis. Binding was monitored by FRET (mCitrine to mCerulean; 525 to 475 nm) on a FluoroMax-4 fluorometer (Horiba, Scientific) in PKC buffer ± 1 mm ATP at 21–22 °C. Serial dilutions were used by the addition of sample buffer directly to Quartz submicrocuvettes to minimize pipetting error. The bandpass width on the fluorometer was selected to maximize the fluorescence signal without saturating of the detector. To determine KD values, data were fit as described in Ref. 18.
Cell Culture and Imaging
Mammalian HeLa cells (ATCC) were cultured in DMEM (Invitrogen, 11960) supplemented with 10% FBS, 4.5 g/liter of d-glucose, 1% Glutamax, and 20 mm HEPES (pH 7.5) at 37 °C in 5% CO2. For live-cell imaging, cells were re-plated on 35-mm glass-bottom dishes (MatTek Corp.) and constructs were transfected using X-tremeGENE HP (Roche Applied Science). At least 30 min prior to imaging, cells were loaded with 10 μm BAPTA-AM (Invitrogen) to deplete intracellular calcium levels. Immediately before imaging cells were washed twice and exchanged into 1 ml of HEPES-buffered saline (HBS) buffer (20 mm HEPES, pH 7.4, 2.5 mm MgCl2, 145 mm NaCl, 5 mm KCl). Imaging was performed using a Nikon A1Rsi confocal fluorescence microscope using a ×60 objective with a Perfect Focus System, 488 nm laser line, and an Andor iXon camera. Once a region was identified with at least two suitable cells, protein localization was then monitored for 10 min upon addition of 1 ml of HBS buffer containing 2 mm CaCl2 and either 0.1 mg/ml of 1,2-dioctanoyl-sn-glycerol (DiC8; Avanti) (26) or 2 μm phorbol 12-myristate 13-acetate (EMD) (20). Experiments were also performed with a mCitrine fluorophore control to monitor photobleaching. Images were then analyzed by selecting three regions in each cell and measuring the average intensity over time. For each condition, ≥2 independent experiments were performed with ≥2 cells per condition (n ≥ 4 cells).
Author Contributions
R. F. S., M. R., C. J. S., and S. S. planned and designed experiments; R. F. S. and M. R. performed experiments; R. F. S. analyzed the results; R. F. S. and S. S. wrote the manuscript.
Acknowledgments
For cell translocation assays, work was done using the Nikon A1Rsi confocal fluorescence microscope at the University of Minnesota, University Imaging Centers. Time-resolved fluorescence decay measurements were taken at the Biophysical Technology Center at the University of Minnesota.
This work was supported in part by American Heart Association Scientist Development Grant 13SDG14270009 and National Institutes of Health Grants 1DP2 CA186752-01 and 1-R01-GM-105646-01-A1 (to S. S.). The authors declare that they have no conflicts of interest with the contents of this article. The content is solely the responsibility of the authors and does not necessarily represent the official views of the National Institutes of Health.
- AMP-PNP
- 5′-adenylyl-β,γ-imidodiphosphate
- PS
- pseudosubstrate
- TEV
- tobacco etch virus
- RD
- regulatory domain
- TCSPC
- time-correlated single photon counting
- BLItz
- bio-layer interferometry
- MBP
- myelin basic protein
- BAPTA
- 1,2-bis(2-aminophenoxyl)ethane-N,N,N′,N′-tetraacetic acid
- eGFP
- enhanced green fluorescent protein.
References
- 1. Ubersax J. A., and Ferrell J. E. Jr. (2007) Mechanisms of specificity in protein phosphorylation. Nat. Rev. Mol. Cell Biol. 8, 530–541 [DOI] [PubMed] [Google Scholar]
- 2. Kholodenko B. N., Hancock J. F., and Kolch W. (2010) Signalling ballet in space and time. Nat. Rev. Mol. Cell Biol. 11, 414–426 [DOI] [PMC free article] [PubMed] [Google Scholar]
- 3. Beis I., and Newsholme E. A. (1975) The contents of adenine nucleotides, phosphagens and some glycolytic intermediates in resting muscles from vertebrates and invertebrates. Biochem. J. 152, 23–32 [DOI] [PMC free article] [PubMed] [Google Scholar]
- 4. Hanks S. K., and Hunter T. (1995) Protein kinases 6. The eukaryotic protein kinase superfamily: kinase (catalytic) domain structure and classification. FASEB J. 9, 576–596 [PubMed] [Google Scholar]
- 5. Taylor S. S., and Kornev A. P. (2011) Protein kinases: evolution of dynamic regulatory proteins. Trends Biochem. Sci. 36, 65–77 [DOI] [PMC free article] [PubMed] [Google Scholar]
- 6. Bhattacharyya R. P., Reményi A., Yeh B. J., and Lim W. A. (2006) Domains, motifs, and scaffolds: the role of modular interactions in the evolution and wiring of cell signaling circuits. Annu. Rev. Biochem. 75, 655–680 [DOI] [PubMed] [Google Scholar]
- 7. Koonin E. V., Wolf Y. I., and Karev G. P. (2002) The structure of the protein universe and genome evolution. Nature 420, 218–223 [DOI] [PubMed] [Google Scholar]
- 8. Leonard T. A., and Hurley J. H. (2011) Regulation of protein kinases by lipids. Curr. Opin. Struct. Biol. 21, 785–791 [DOI] [PMC free article] [PubMed] [Google Scholar]
- 9. Pawson T., and Nash P. (2003) Assembly of cell regulatory systems through protein interaction domains. Science 300, 445–452 [DOI] [PubMed] [Google Scholar]
- 10. Yang S., Blachowicz L., Makowski L., and Roux B. (2010) Multidomain assembled states of Hck tyrosine kinase in solution. Proc. Natl. Acad. Sci. U.S.A. 107, 15757–15762 [DOI] [PMC free article] [PubMed] [Google Scholar]
- 11. Ananthanarayanan B., Stahelin R. V., Digman M. A., and Cho W. (2003) Activation mechanisms of conventional protein kinase C isoforms are determined by the ligand affinity and conformational flexibility of their C1 domains. J. Biol. Chem. 278, 46886–46894 [DOI] [PubMed] [Google Scholar]
- 12. Pearce L. R., Komander D., and Alessi D. R. (2010) The nuts and bolts of AGC protein kinases. Nat. Rev. Mol. Cell Biol. 11, 9–22 [DOI] [PubMed] [Google Scholar]
- 13. Newton A. C. (1995) Protein kinase C: structure, function, and regulation. J. Biol. Chem. 270, 28495–28498 [DOI] [PubMed] [Google Scholar]
- 14. Igumenova T. I. (2015) Dynamics and membrane interactions of protein kinase C. Biochemistry 54, 4953–4968 [DOI] [PMC free article] [PubMed] [Google Scholar]
- 15. Steinberg S. F. (2008) Structural basis of protein kinase C isoform function. Physiol. Rev. 88, 1341–1378 [DOI] [PMC free article] [PubMed] [Google Scholar]
- 16. Antal C. E., Callender J. A., Kornev A. P., Taylor S. S., and Newton A. C. (2015) Intramolecular C2 domain-mediated autoinhibition of protein kinase C βII. Cell Rep. 12, 1252–1260 [DOI] [PMC free article] [PubMed] [Google Scholar]
- 17. Leonard T. A., Różycki B., Saidi L. F., Hummer G., and Hurley J. H. (2011) Crystal structure and allosteric activation of protein kinase C βII. Cell 144, 55–66 [DOI] [PMC free article] [PubMed] [Google Scholar]
- 18. Sivaramakrishnan S., and Spudich J. A. (2011) Systematic control of protein interaction using a modular ER/K α-helix linker. Proc. Natl. Acad. Sci. U.S.A. 108, 20467–20472 [DOI] [PMC free article] [PubMed] [Google Scholar]
- 19. House C., and Kemp B. E. (1987) Protein kinase C contains a pseudosubstrate prototope in its regulatory domain. Science 238, 1726–1728 [DOI] [PubMed] [Google Scholar]
- 20. Swanson C. J., Ritt M., Wang W., Lang M. J., Narayan A., Tesmer J. J., Westfall M., and Sivaramakrishnan S. (2014) Conserved modular domains team up to latch-open active protein kinase Cα. J. Biol. Chem. 289, 17812–17829 [DOI] [PMC free article] [PubMed] [Google Scholar]
- 21. Lakowicz J. R. (2006) Principles of fluorescence spectroscopy, 3rd Ed., Springer, New York [Google Scholar]
- 22. Slater S. J., Seiz J. L., Cook A. C., Buzas C. J., Malinowski S. A., Kershner J. L., Stagliano B. A., and Stubbs C. D. (2002) Regulation of PKCα activity by C1-C2 domain interactions. J. Biol. Chem. 277, 15277–15285 [DOI] [PubMed] [Google Scholar]
- 23. Swanson C. J., Sommese R. F., Petersen K. J., Ritt M., Karslake J., Thomas D. D., and Sivaramakrishnan S. (2016) Calcium stimulates self-assembly of protein kinase Cα in vitro. PloS One 11, e0162331. [DOI] [PMC free article] [PubMed] [Google Scholar]
- 24. Swanson C. J., and Sivaramakrishnan S. (2014) Harnessing the unique structural properties of isolated α-helices. J. Biol. Chem. 289, 25460–25467 [DOI] [PMC free article] [PubMed] [Google Scholar]
- 25. Huang S. M., Leventhal P. S., Wiepz G. J., and Bertics P. J. (1999) Calcium and phosphatidylserine stimulate the self-association of conventional protein kinase C isoforms. Biochemistry 38, 12020–12027 [DOI] [PubMed] [Google Scholar]
- 26. Stahelin R. V., Wang J., Blatner N. R., Rafter J. D., Murray D., and Cho W. (2005) The origin of C1A-C2 interdomain interactions in protein kinase Cα. J. Biol. Chem. 280, 36452–36463 [DOI] [PubMed] [Google Scholar]
- 27. Luc̆ić I., Truebestein L., and Leonard T. A. (2016) Novel features of DAG-activated PKC isozymes reveal a conserved 3-D architecture. J. Mol. Biol. 428, 121–141 [DOI] [PubMed] [Google Scholar]
- 28. Huse M., and Kuriyan J. (2002) The conformational plasticity of protein kinases. Cell 109, 275–282 [DOI] [PubMed] [Google Scholar]
- 29. Kirwan A. F., Bibby A. C., Mvilongo T., Riedel H., Burke T., Millis S. Z., and Parissenti A. M. (2003) Inhibition of protein kinase C catalytic activity by additional regions within the human protein kinase Cα-regulatory domain lying outside of the pseudosubstrate sequence. Biochem. J. 373, 571–581 [DOI] [PMC free article] [PubMed] [Google Scholar]
- 30. Lopez-Garcia L. A., Schulze J. O., Fröhner W., Zhang H., Süss E., Weber N., Navratil J., Amon S., Hindie V., Zeuzem S., Jørgensen T. J., Alzari P. M., Neimanis S., Engel M., and Biondi R. M. (2011) Allosteric regulation of protein kinase PKCζ by the N-terminal C1 domain and small compounds to the PIF-pocket. Chem. Biol. 18, 1463–1473 [DOI] [PubMed] [Google Scholar]
- 31. Herberg F. W., and Taylor S. S. (1993) Physiological inhibitors of the catalytic subunit of cAMP-dependent protein kinase: effect of MgATP on protein-protein interactions. Biochemistry 32, 14015–14022 [DOI] [PubMed] [Google Scholar]
- 32. Cameron A. J., Escribano C., Saurin A. T., Kostelecky B., and Parker P. J. (2009) PKC maturation is promoted by nucleotide pocket occupation independently of intrinsic kinase activity. Nat. Struct. Mol. Biol. 16, 624–630 [DOI] [PubMed] [Google Scholar]
- 33. Srivastava J., Goris J., Dilworth S. M., and Parker P. J. (2002) Dephosphorylation of PKCδ by protein phosphatase 2Ac and its inhibition by nucleotides. FEBS Lett. 516, 265–269 [DOI] [PubMed] [Google Scholar]
- 34. Sommese R. F., and Sivaramakrishnan S. (2016) Substrate affinity differentially influences protein kinase C regulation and Inhibitor potency. J. Biol. Chem. 291, 21963–21970 [DOI] [PMC free article] [PubMed] [Google Scholar]
- 35. Lahiry P., Torkamani A., Schork N. J., and Hegele R. A. (2010) Kinase mutations in human disease: interpreting genotype-phenotype relationships. Nat. Rev. Genet. 11, 60–74 [DOI] [PubMed] [Google Scholar]
- 36. Autry J. M., Rubin J. E., Svensson B., Li J., and Thomas D. D. (2012) Nucleotide activation of the Ca-ATPase. J. Biol. Chem. 287, 39070–39082 [DOI] [PMC free article] [PubMed] [Google Scholar]
- 37. Altman D., Goswami D., Hasson T., Spudich J. A., and Mayor S. (2007) Precise positioning of myosin VI on endocytic vesicles in vivo. PLoS Biol. 5, e210. [DOI] [PMC free article] [PubMed] [Google Scholar]


