

Abstract
Introduction:
Erythromycin (ERY) is known to induce hepatic toxicity which mimics other liver diseases. Thus, ERY is often used to produce experimental models of drug-induced liver-toxicity. The serum metabolic profiles can be used to evaluate the liver-toxicity and to further improve the understanding of underlying mechanism.
Objective:
To establish the serum metabolic patterns of Erythromycin induced hepatotoxicity in albino wistar rats using 1H NMR based serum metabolomics.
Experimental:
Fourteen male rats were randomly divided into two groups (n = 7 in each group): control and ERY treated. After 28 days of intervention, the metabolic profiles of sera obtained from ERY and control groups were analyzed using high-resolution 1D 1H CPMG and diffusion-edited nuclear magnetic resonance (NMR) spectra. The histopathological and SEM examinations were employed to evaluate the liver toxicity in ERY treated group.
Results:
The serum metabolic profiles of control and ERY treated rats were compared using multivariate statistical analysis and the metabolic patterns specific to ERY-induced liver toxicity were established. The toxic response of ERY was characterized with: (a) increased serum levels of Glucose, glutamine, dimethylamine, malonate, choline, phosphocholine and phospholipids and (b) decreased levels of isoleucine, leucine, valine, alanine, glutamate, citrate, glycerol, lactate, threonine, circulating lipoproteins, N-acetyl glycoproteins, and poly-unsaturated lipids. These metabolic alterations were found to be associated with (a) decreased TCA cycle activity and enhanced fatty acid oxidation, (b) dysfunction of lipid and amino acid metabolism and (c) oxidative stress.
Conclusion and Recommendations:
Erythromycin is often used to produce experimental models of liver toxicity; therefore, the established NMR-based metabolic patterns will form the basis for future studies aiming to evaluate the efficacy of anti-hepatotoxic agents or the hepatotoxicity of new drug-formulations.
KEY WORDS: Erythromycin, metabolomics, multivariate data analysis, nuclear magnetic resonance, rats, liver-toxicity
Erythromycin (ERY) belongs to a group of drugs called macrolide antibiotics and is widely used to treat or prevent different types of bacterial infections.[1,2] However, ERY has been found to induce certain side effects and may produce allergic reactions like hives, difficult breathing, swelling of face, lips, tongue, or throat. Further, the continuous use of ERY can also alter the gut flora;[3] thus additionally producing gastrointestinal disorders like abdominal pain, nausea, and diarrhea, but are rarely severe. However, the most adverse side-effect of frequent use of ERY have been linked to the instances of hepatotoxicity manifested as disturbances in liver function and jaundice.[4,5] ERY-induced hepatotoxicity likely arises from a combination of intrinsic hepatotoxic effects and the hypersensitivity reactions that characterize most cases with evidence of hepatocellular injury and cholestatic pattern of injury.[6,7] Such events of hepato-toxicity have been shown to cause significant metabolic perturbations in the sera of affected individuals. However, the serum metabolic patterns of ERY-induced liver toxicity have not been explored so far. To the best of our knowledge, this is the first study aiming to investigate the serum metabolic patterns specific to ERY-induced liver toxicity and to further improve the understanding of underlying mechanism.
Metabolomics allows rapid identification of metabolic perturbations in biological systems and is routinely used to evaluate systemic responses from minimal amounts of biological material,[8] to any subtle pathophysiological stimuli or stress.[9] Over the years, it has increasingly been recognized as a valuable complementary approach to genomics, transcriptomics, and proteomics to achieve a complete understanding of the disease mechanism.[10] It also provides opportunities for developing diagnostic/prognostic biomarkers related to the disease and certain pathophysiological condition.[11,12] Practically, metabolomics approaches relies on multivariate statistical analysis of data collected with advanced analytical techniques-such as gas chromatography-mass spectrometry (GC-MS), liquid chromatography- mass spectrometry (LC-MS), and nuclear magnetic resonance (NMR) spectroscopy. Of them, NMR combined with multivariate analysis is an ideal platform and it has extensively been used in several metabolomic studies.[13,14] In comparison to any other analytical and biochemical method, NMR possesses various advantages. First, it is rapid, quantitative and offers the potential for high-throughput (analysis of >100 samples a day is attainable). Second, it requires virtually no sample preparation and can be used for studying variety of biological/clinical samples, tissue extracts, and even cell lines.[15] Third, it is nondestructive, noninvasive, and nonselective, i.e., multiple metabolites are detectable in as little as 500 µl of blood plasma/serum (which can be obtained from 1.0 ml of peripheral blood). And last but not the least, it provides highly reproducible results. These technical advantages derived our interest to use NMR for identifying the serum metabolic patterns of ERY induced hepatotoxicity in rat models.
Methodology
Chemicals
ERY was purchased from Himedia, Mumbai, India. 3-trimethlysilyl [2,2,3,3-d4] propionate (TSP) was from Cambridge Isotope Laboratories Inc., (Andover, MA, USA). D2O (99.9%) was procured from Merck (Landisville, Pennsylvania, USA). Phosphate buffer in D2O was prepared using K2HPO4 and NaH2PO4 (20 mM, pH 7.4), containing 0.9% NaCl and 1.0% Soda azide.
Animals
Fourteen male Albino Wistar rats weighing 180–220 g were used for the experiment and the prior protocol approval was taken from the Institutional Animal Ethical Committee (Approval No. SDCOP and VS/AH/CPCSE01/017/R3). Animals were acclimatized to the new environment for 10 days before experiment at a temperature of 25°C±5°C and a humidity of 55%±5% with a 12-h light/dark cycle. The animals had free access to water and food throughout the study. All animal procedures were approved by the Institute's Ethics Committee, and performed strictly in accordance with the Guidelines for Animal Experimentation CPCSE.
Experimental protocol
The rats were randomly divided into 2 groups: ERY group (n = 7) and control group (n = 7). For ERY group, ERY (dissolved in 0.25% carboxymethyl cellulose abbreviated as CMC) was administered orally (50 mg/kg dose daily for 28 days).[16] Control group was orally given equal volume of physiological saline containing 0.25% CMC on the same day as ERY group did.
Sample collection
The blood samples were collected from femoral artery after 28 days of intervention, and kept at 37°C for 30 min and then centrifuged at 500 g, 4°C, for 15 min, the pale yellow supernatants (serum samples) were collected in centrifuge tubes and stored at −80°C prior to use. Animals were sacrificed by cervical decapitation and liver were dissected out and rinsed with ice cold saline and stored at −20°C for further studies.
Histopathological studies
Histopathological studies were performed to find out the morphological changes of liver cells after ERY administration. Liver tissues from each group were assessed for their morphological changes using hematoxylin and eosin staining. The tissues were preserved in 10% formalin overnight. Next day, the cells were again superseded by 70% isopropanol for overnight. Later, the tissues were exposed to isopropanol at various concentrations (70, 90, and 100%) and dehydrated by 100% xylene. The tissue samples were then embedded in bees wax and 5 μm sections were prepared by using microtome. Then, the tissues were succeeded by hematoxylin and eosin staining and observed under microscope (×40).
Scanning electron microscopy
The liver tissue samples were collected (2–4 mm) and fixed in 2.5% glutaraldehyde for 2–6 h at 4°C for primary fixation. Then, the samples were washed in 0.1 M phosphate buffer for 3 times each of 15 min at 4°C. After that, 1% osmium tetroxide was used as a post fixation for 2 h at 4°C. Again, the samples were washed in 0.1 M phosphate buffer for 3 times at 15 min interval and kept at 4°C. Later, these samples were dehydrated with acetone at various concentrations (30, 50, 70, 90, 95, and 100%). After that, all specimens were dried by air drying and critical point drying (31.5°C at 1100 psi). Finally, samples were mounted on to the aluminum stubs with adhesive tape and observed for the morphological changes using scanning electron microscope (JEOL JSM-6490 LV).
Sample preparation for nuclear magnetic resonance measurements
The NMR samples were prepared as described previously.[17] However, briefly, the serum samples were thawed at room temperature prior to use. A total of 300 µL serum of each sample was diluted with 300 µL of phosphate buffer of 20 mM strength with 0.9% saline, containing D2O for the purpose of field lock, and TSP (0.01%) as a chemical shift reference. The whole mixture was centrifuged (10,000-RPM, at 4°C, for 5 min) to remove the precipitates. The supernatants of 500 µL were transferred into 5 mm NMR tubes for 1H-NMR analysis.
Nuclear magnetic resonance (NMR) measurement
All NMR spectra were recorded at 298 K on Bruker Biospin Avance-III 800 MHz NMR spectrometer operating at proton frequency of 800.21 MHz, equipped with CryoProbe and an actively shielded gradient unit with a maximum gradient strength output of 53 g/cm. The raw NMR data were processed in Topspin-v2.1 (Bruker BioSpin GmbH, Silberstreifen 4 76287 Rheinstetten, Germany). For each serum sample, two types of one-dimensional (1D) 1H NMR spectra were recorded using the standard Bruker's pulse program library: (a) transverse relaxation-edited Carr–Purcell–Meiboom–Gill (CPMG) spectra[15] and (b) diffusion-edited bipolar pulse pair longitudinal eddy current delay spectra.[19,20,21] All recorded spectra were visually inspected for acceptability and subjected to multivariate statistical analysis to identify the altered metabolic patterns.
Spectral assignment
For the assignment of various peaks in the 1D 1H CPMG and diffusion-edited NMR spectra. Chemical shifts were identified and assigned as far as possible, by comparing them with the chemical shifts available with the software Chenomx 8.1 (Chenomx Inc., Edmonton, Canada). The remaining peaks in the CPMG 1H NMR spectra were assigned using previously reported NMR assignments of metabolites, data obtained from database Biological Magnetic Resonance Data Bank, and the human metabolome database (HMDB)[19,20,21] for diffusion-edited 1H NMR spectra assignment was done using previously reported assignments of metabolites in literature.[22,23,24]
Data reduction
NMR spectra were manually phased and baseline corrected using NMR data Processing Software Topspin v2.1 (Bruker Biospin). The CPMG spectral region δ 8.5–0.5 ppm was binned and automatically integrated using AMIX package (Version 3.8.7, Bruker, BioSpin). The region distorted due to water suppression, glycoproteins, and lipids δ(5.0–4.7), δ(5.25–5.38), δ(2.2–2.0), δ(1.4–1.20), and δ(0.9–0.5) were excluded from the CPMG data set. Finally, the selected regions were reduced to spectral bins of δ(0.01) ppm. For the diffusion-edited spectra δ(6.0–0.5) ppm, the region δ(5.1–4.6) ppm distorted due to water was excluded and the selected region was further reduced to spectral bins of δ(0.05) ppm. Subsequently, the spectral bins were exported to Microsoft office 2010. The resultant CPMG and diffusion-edited, data sets were finally used for univariate and multivariate analysis in statistical analysis module of MetaboAnalyst,[25] which is an open access web-based tool for the analysis of metabolomics data. All the statistical analyses were carried out on the binned data for metabolites identification and metabolic profiling.
Statistical analysis
The spectral data were converted to comma-separated values (CSV) format using Microsoft excel format and imported into MetaboAnalyst 3.0 for multivariate analysis in which all spectral data were Pareto scaled.[26] Initially, principal component analysis (PCA) was applied to identify the clustering patterns and outliers (two were found in CPMG data set and one was found in the DE data set). Partial least-squares-discrimination analysis (PLS-DA) was used for pattern recognition analysis and isolating significant metabolites based on their PLS-DA; variable influence on projection (VIP); and coefficient scores. The PLS-DA model was validated by 10-fold cross validation method by describing R2 and Q2 values. A value of P < 0.05 was considered to indicate a statistically significant difference.
Results
Multivariate analysis
The binned data derived from CPMG and diffusion-edited experiments were subjected to multivariate statistical analysis in MetaboAnalyst[25] (a freely available, user-friendly, web-based analytical platform for high-throughput metabolomics studies from the University of Alberta, Canada).[26] All the spectral data were subjected to Pareto scaling prior to multivariate analysis. The resulting scaled datasets were analyzed in an unsupervised and supervised manner, such as PCA and PLS-DA, respectively. PCA was used to observe inherent clustering and to identify the possible outliers (See Supplementary Figure 1 (580.3KB, tif) ). PLS-DA was applied to obtain an overview of the complete data set and discriminate the variables that are responsible for variation between the groups to identify features with discriminative power Figure 1. The quality and reliability of the PLS-DA models were validated based on R2 and Q2 values derived using 10-fold cross validation algorithm. The R2 and Q2 values enclosed in the Figure 1 alluded that the PLS-DA models possessed satisfactory fit with good predictive power. These results indicate that the established PLS-DA model is reliable and good at classifying and discriminating between controls and the ERY treated group. The differential metabolites were selected based on the statistically significant threshold of VIP values obtained from the PLS-DA model was larger than or equal to 1.0 (≥) and PLS-DA coefficients score (i.e., >30% in the present study). The coefficient importance is based on the weighted sum of PLS-regression scores; whereas the VIP score represents a weighted sum of squares of the PLS loadings and takes into account the amount of explained Y-variation in each dimension to measure the impact of each metabolite in the model. The VIP criterion indirectly imitates the correlation of the metabolites with disease and is an extensively used method for biomarker selection. The area under the receiver-operating characteristic curves (AUROC) was carried to evaluate the effectiveness of potential biomarkers that significantly contributed to the discrimination of ERY treated rats from controls. ROC curves are generated by Monte-Carlo cross validation using balanced subsampling. PLS-DA algorithm was selected as classification and feature ranking method. The AUROC gives of discriminatory ability (0.5 = no discrimination; 1 = perfect discrimination). The largest and smallest resulting AUC values range from 0.97–0.71, which indicated that these biomarkers may potentially be involved in the disease mechanisms. Figure 2 shows example ROC plots of three metabolites with AUROC values more than 0.9. The boxplot representation was used to visualize the variation in the levels of significantly altered metabolites identified in the multivariate analysis [Figure 2]. For generating the box plots, univariate analysis was performed by applying an independent samples t-test on significantly altered metabolites using their normalized and scaled values Supplementary Figure 2 (1.2MB, tif) . A P-value less than 0.05 (P < 0.05) was considered to indicate a statistically significant difference.
Figure 1.

(a and c) Two-dimensional PLS-DA score plot derived from one-dimensional 1H CPMG and diffusion edited NMR spectra of serum samples obtained from erythromycin and control groups represented by a triangle (red) and a circle (blue) respectively. One data point stands for one subject. The performance of the PLS-DA model was evaluated using 10-fold cross validation parameters derived using the top five components (latent variables) and the corresponding R2 and Q2 values are shown in (a and c) respectively. (b and d) The loading plots showing discriminatory potential of some of the metabolites responsible for the separation of the two groups, which are color-coded according to the absolute value of the correlation coefficient; a reddish signal indicates a more significant contribution to the class separation than a bluish signal. Positive (>0) and negative (<0) loadings indicate metabolites increased and decreased in concentration in the erythromycin group, respectively
Figure 2.

Area under the receiver-operating characteristic curves (AUROC) of the significant metabolite (with AUROC value>0.9), that decreased or increased in the erythromycin compared to control group with their respective boxplots. (a and b) Derived from the Carr–Purcell–Meiboom–Gill nuclear magnetic resonance spectra and (c) derived from the diffusion-edited nuclear magnetic resonance spectra
Principal component analysis score plot of control versus erythromycin of Carr–Purcell–Meiboom–Gill and diffusion edited spectra
Box-whisker plots of metabolites that were significantly perturbed across the erythromycin and control groups derived from Carr–Purcell–Meiboom–Gill and diffusion edited spectra. The blank circles represent the outlier data points which are not included in the box-plot calculation
Significant metabolic perturbations responsible for class separation were assigned and are enlisted in Table 1 along with their VIP, coefficient scores, AUROC, and P values. Twenty metabolites were selected as key metabolites for the classification of ERY group, mainly characterized (a) by the increased levels of glucose, dimethylamine, malonate, choline, and phospholipids and (b) by the decreased levels of isoleucine, leucine, valine alanine, glutamate, citrate, glycerol, lactate, threonine, high density lipoprotein (HDL), low density lipoprotein (LDL), very LDL (VLDL), N-acetyl glycoproteins (NAGs), and poly-unsaturated lipids (PUFAs). The dataset of selected differential metabolites was imported into MetaboAnalyst 3.0 for heat map [Figure 3] generation and pathway analysis [Figure 4].
Table 1.
Details of the distinctive metabolites best describing the variation between erythromycin and control groups
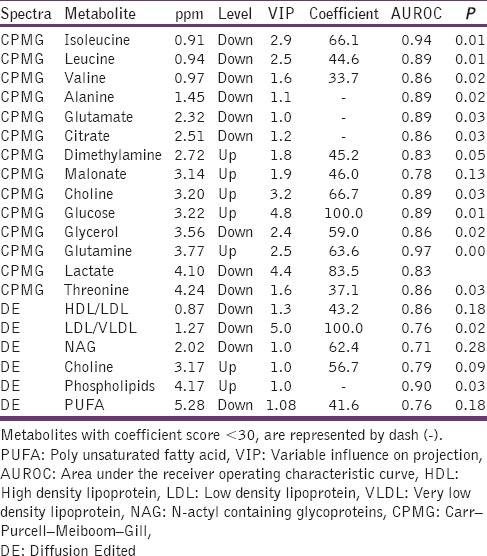
Figure 3.
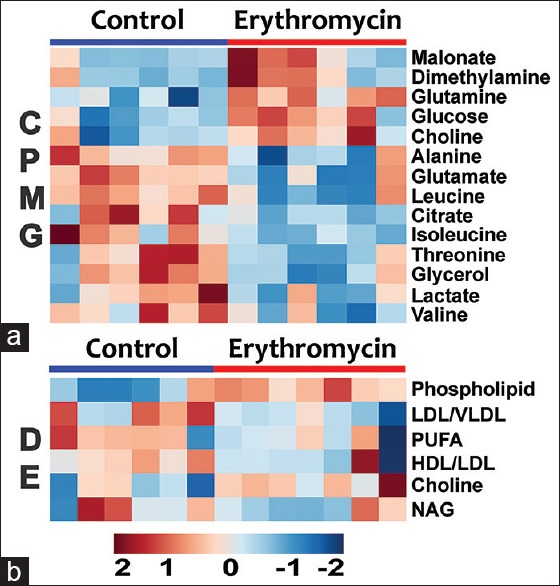
Heat map of statistically significant metabolites in erythromycin and control groups as derived from (a) Carr–Purcell–Meiboom–Gill and (b) diffusion-edited spectra. Red = elevated; Blue = reduced. Each column represents a sample, and each row represents a metabolite
Figure 4.

The pathway analysis showing metabolic pathways altered during ERY induced hepatotoxicity. The pathways were identified based on over-representation analysis using significantly altered metabolites enlisted in Table 1 except lipid metabolites (VLDL, LDL, HDL, phospholipids, PUFAs) and glycoproteins
Pathway analysis
The affected metabolic pathways were depicted using combinations of metabolite entities altered significantly in ERY group (identified through PLS-DA analysis). For this we used the metabolic pathways analysis module in MetaboAnalyst.[26,27] This web-based tool enables the identification of altered metabolic pathways from its extensive HMDB-derived collection pathways and metabolite libraries to annotate pathways and deduce a meaningful metabolic pattern to distinguish the affected metabolic pathways. The lipid and membrane metabolites such as LDL, VLDL, HDL, NAG, and glycerol were not recognized by the program; thus were not included in this analysis. The final list of altered metabolites that were significantly influenced by drug treatment, were uploaded and analyzed by metabolite set enrichment analysis overview) and over-representation analysis (ORA) in MetaboAnalyst. The built-in rat (Rattus norvegicus) pathway library for pathway analysis and hypergeometric test for ORA and the out-degree centrality algorithms were employed for pathway enrichment analysis and pathway topology analysis. One-tailed P values are provided after adjusting for multiple testing. The output of this program will mark a metabolic pathway as significant if significantly more compounds involved in that pathway are present in the input list than would be expected by random chance. Results are presented graphically in Figure 4.
Characteristics of erythromycin induced toxicity
According to Figure 5, we observed kupffer (K) cells with normal architecture of nucleus. In ERY treated samples, there was the presence of degenerated nucleus in kupffer cells (K) and also ruptured kupffer cells (RC). Scanning electron microscopy (SEM) analysis revealed that there is a presence of lesions in ERY groups than normal control.
Figure 5.
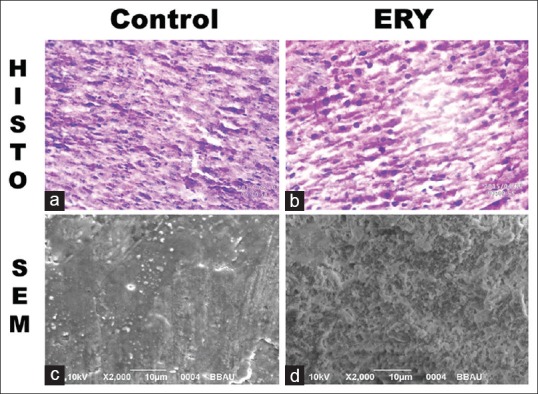
(a-d) Derived from liver tissue, (a and b) are the histopathology images, (c and d) are scanning electron microscopy images
Discussion
The liver plays a cardinal role in metabolic homeostasis with major regulatory roles in the metabolism of carbohydrates, fats, and proteins. Serum metabolic profiles of ERY compared with respect to control showed significant differences with (a) increased levels of glucose, glutamine, choline, phospholipids, dimethylamine, and malonate and (b) decreased levels of citrate, lactate, glycerol, lipids, poly unsaturated fatty acids (PUFA) and amino acids like alanine, glutamate, threonine, isoleucine, leucine, and valine. These serum metabolic changes and pathway analysis revealed perturbations in energy metabolism, amino acid metabolism, and lipid metabolism. The implications of these metabolic changes in the ERY induced liver toxicity have been discussed in detail below.
Glucose-energy and amino-acid metabolism
General comparison between ERY and controls showed a significant increase of glucose accompanied by a decrease in lactate and citrate, suggesting disturbed glucose metabolism with dampened aerobic glycolytic activity.[28] Further, the increased serum levels glucose (i.e. hyperglycemia) may produce conditions like oxidative-stress.[28,29] Citrate is an intermediate in the tricarboxylic acid (TCA) cycle and is involved in energy metabolism; its decrease in ERY group indicates the demand and rapid utilization of metabolites that feed energy producing pathways. The decrease of these metabolites correlates with disturbed energy metabolism, especially the suppression of oxidative phosphorylation and thus to meet the energy demands, the energy metabolism shifts from aerobic to anaerobic state. However, the process being less efficient cannot keep up with the production and utilization of adenosine triphosphate (ATP), the intracellular concentration of ATP drops with the depletion of cytosolic glucose. As a result, the alternative energy substrates like amino acids are oxidized to meet the energy demand. The decreased serum levels of AAs might be closely related to this phenomenon in addition to repair the physiological damage (including, protein degradation in the presence of oxidative stress).[30] Particularly, the branched chain AAs (BCAAs) are catabolized to replenish the depleted levels of TCA cycle intermediates or as acetyl derivatives to generate energy during stress suggesting dampened glycolysis alongside breakdown and release of AAs from muscle proteins[34] and liver.[35,36] Recent studies have shown clinical application of BCAAs to treat patients with liver diseases with conclusive effects, and a decreased level of BCAAs in diagnosis of liver dysfunction.[37] The significantly increased glucose in serum might be due to increased rate of gluconeogenesis from alanine and lactate (both found to be decreased in ERY sera). On the other hand, the serum levels of dimethylamine (DMA) was found to elevated in ERY rats which might be related to the differences in the composition of the intestinal microflora.[33] Overall, the observed metabolic changes provided several indications of disturbed energy metabolism and compromised ability of affected liver to maintain metabolic homeostasis owing to ERY-induced damage to liver cells as evaluated here based on inflammation and hepatocellular degeneration along with tissue necrosis [Figure 5].
Lipid and membrane metabolites
Lipids are the fundamental ingredients of biological membranes.[38] Lipid metabolism involves the degradation of fatty acids, however, they may also serve as primary energy source under conditions of oxidative stress.[39,40] In our NMR study, the lipid metabolites (LDL, VLDL, HDL, PUFA, and glycerol) were found to be significantly decreased in the sera of ERY rats compared to control rats indicating their augmented utilization to produce membrane metabolites for repairing the damaged cell membranes in addition to their enhanced fatty acid oxidation to maintain energy homeostasis. Hypolipidemia is common clinical manifestation of chronic liver disease and previous studies have also shown its correlation with hepatitis C infection and a number of other malignancies associated with the live disease.[43] A number of previous studies have reported the association of abnormal lipid metabolism with the activation of oxidative and inflammatory pathways in liver disease.[41,42] Contrary to this, the membrane metabolites choline and phospholipids were found to be elevated in the sera of ERY treated rats compared to control rats indicating a kind of self-repair mechanism activated in ERY rats to renovate the cell membranes damaged by reactive oxygen/nitrogen species under conditions of ERY induced hepatocellular degeneration caused by lipid peroxidation and oxidative-stress.[44,45] The most prominent and consistent change observed in the diffusion-edited NMR spectra was the decreased signals of N-acetyl containing glycoproteins (NAGs), mainly N-acetylglucosamine and N-acetylneuramic acid. Physiologically, NAGs are acute phase proteins with anti-inflammatory properties and are expressed more during inflammation and immune responses.[46] The primary site for the synthesis of glycoproteins is liver,[47,48] where it occurs in a multi-step fashion in the lumen of the endoplasmic reticulum and Golgi apparatus. The decreased levels of NAG have been reported in liver cirrhotic patient and hepatocellular carcinoma patients.[48,49] Consistent with these reports, the decreased levels of NAGs in ERY rats might be related to liver dysfunction. As liver cells are involved in many pathways of lipid and membrane metabolism, therefore, the decreased levels of lipid metabolites (HDL, LDL, and VLDL) and increased serum levels of membrane metabolites (choline, phosphocholine and phospholipids) in the sera of ERY rats are clear manifestations of ERY induced liver toxicity.
Conclusion
The current study reports the NMR-based serum metabolic patterns associated with ERY induced liver toxicity. As NMR based metabolic profiling is relatively simple and rapid, therefore, the resulted NMR based serum metabolic patterns will form the basis for future pre-clinical studies aiming to evaluate the hepatotoxicity of new drug regimens or as a primary screening tool to evaluate the therapeutic efficacy of anti-hepatotoxic agents/formulations.
Financial support and sponsorship
Dr. Anupam Guleria acknowledges the Department of Science and Technology (DST) and Govt. of India for financial assistance under DST INSPIRE Faculty Award (Ref. no. DST/Inspire Faculty Award 2014/LSBM-120). We also acknowledge the Department of Medical Education, Govt. of Uttar Pradesh for supporting the High Field NMR Facility at Centre of Biomedical Research (CBMR), Lucknow, India. We also acknowledge for the SRF fellowship of Atul Rawat from CSIR, India, and JRF fellowship of Durgesh Dubey and Umesh Kumar from ICMR, India
Conflicts of interest
There are no conflicts of interest.
Author contributions
Conceived and designed the experiments: DK and SS. Ethical approval: SS. Animal experiments and blood collection: UK, SC, AKK; Sample preparation and NMR data collection: AR, DD. Contributed reagents/materials/analysis tools: DK, AG, AP, SS. Data analysis, data interpretation and preparation of Figures: AR, DK, AG, DD, AP. Wrote the paper: AR, DK, SS. Critically reviewed the paper: AG.
References
- 1.Fair RJ, Tor Y. Antibiotics and bacterial resistance in the 21st century. Perspect Medicin Chem. 2014;6:25–64. doi: 10.4137/PMC.S14459. [DOI] [PMC free article] [PubMed] [Google Scholar]
- 2.Soares GM, Figueiredo LC, Faveri M, Cortelli SC, Duarte PM, Feres M. Mechanisms of action of systemic antibiotics used in periodontal treatment and mechanisms of bacterial resistance to these drugs. J Appl Oral Sci. 2012;20:295–309. doi: 10.1590/S1678-77572012000300002. [DOI] [PMC free article] [PubMed] [Google Scholar]
- 3.Moffa DA., Jr . Preventing Toxic Drug Interactions and Exposures. In: Carey WD, editor. Current Clinical Medicine. 2nd ed. Philadelphia, PA: Saunders Elsevier; 2010. pp. 1298–305. [Google Scholar]
- 4.Cacace LG, Schweigert BF, Gildon AM. Erythromycin estolate induced hepatotoxicity report of a case and review of the literature. Ann Pharmacother. 1977;11:22–5. [Google Scholar]
- 5.Shirin H, Schapiro JM, Arber N, Pinkhas J, Sidi Y, Salomon F. Erythromycin base-induced rash and liver function disturbances. Ann Pharmacother. 1992;26:1522–3. doi: 10.1177/106002809202601207. [DOI] [PubMed] [Google Scholar]
- 6.Zafrani ES, Ishak KG, Rudzki C. Cholestatic and hepatocellular injury associated with erythromycin esters: Report of nine cases. Dig Dis Sci. 1979;24:385–96. doi: 10.1007/BF01297126. [DOI] [PubMed] [Google Scholar]
- 7.Andrade RJ, Tulkens PM. Hepatic safety of antibiotics used in primary care. J Antimicrob Chemother. 2011;66:1431–46. doi: 10.1093/jac/dkr159. [DOI] [PMC free article] [PubMed] [Google Scholar]
- 8.Nicholson JK, Lindon JC. Systems biology: Metabonomics. Nature. 2008;455:1054–6. doi: 10.1038/4551054a. [DOI] [PubMed] [Google Scholar]
- 9.Serkova NJ, Niemann CU. Pattern recognition and biomarker validation using quantitative 1H-NMR-based metabolomics. Expert Rev Mol Diagn. 2006;6:717–31. doi: 10.1586/14737159.6.5.717. [DOI] [PubMed] [Google Scholar]
- 10.Patel S, Ahmed S. Emerging field of metabolomics: Big promise for cancer biomarker identification and drug discovery. J Pharm Biomed Anal. 2015;107:63–74. doi: 10.1016/j.jpba.2014.12.020. [DOI] [PubMed] [Google Scholar]
- 11.Viant MR, Rosenblum ES, Tieerdema RS. NMR-based metabolomics: A powerful approach for characterizing the effects of environmental stressors on organism health. Environ Sci Technol. 2003;37:4982–9. doi: 10.1021/es034281x. [DOI] [PubMed] [Google Scholar]
- 12.Lindon JC, Nicholson JK, Everett JR. NMR spectroscopy of biofluids. Annual Reports on NMR Spectroscopy. 1999;38:1–88. [Google Scholar]
- 13.Nicholson JK, Lindon JC, Holmes E. Metabonomics: Understanding the metabolic responses of living systems to pathophysiological stimuli via multivariate statistical analysis of biological NMR spectroscopic data. Xenobiotica. 1999;29:1181–9. doi: 10.1080/004982599238047. [DOI] [PubMed] [Google Scholar]
- 14.Nicholson JK, Wilson ID. Opinion: Understanding ‘global’ systems biology: Metabonomics and the continuum of metabolism. Nat Rev Drug Discov. 2003;2:668–76. doi: 10.1038/nrd1157. [DOI] [PubMed] [Google Scholar]
- 15.Wishart DS. Quantitative metabolomics using NMR. Trends Analyt Chem. 2008;27:228–37. [Google Scholar]
- 16.Allah-H N, Hameid A. Protective role of dimethyl diphenyl bicarboxylate (DDB) against erythromycin induced hepatotoxicity in male rats. Toxicology in vitro. 2007;21:618–625. doi: 10.1016/j.tiv.2006.12.006. [DOI] [PubMed] [Google Scholar]
- 17.Dinesh Kumar, Atul Rawat, Durgesh Dubey, Umesh Kumar, Amit K Keshari, Sudipta Saha, Anupam Guleria. “NMR Based Metabolomics: An Emerging Tool for Therapeutic Evaluation of Traditional Herbal Medicines”. SM-eBOOK: Nuclear Magnetic Resonance Spectroscopy SM-eBOOK: Nuclear Magnetic Resonance Spectroscopy. 2016 Jun 10;:1–18. [Google Scholar]
- 18.Wu DH, Chen AD, Johnson CS. An improved diffusion-ordered spectroscopy experiment incorporating bipolar-gradient pulses. J Magn Reson A. 1995;115:260–4. [Google Scholar]
- 19.Wishart DS, Jewison T, Guo AC, Wilson M, Knox C, Liu Y, et al. HMDB 3.0 – the human metabolome database in 2013. Nucleic Acids Res. 2013;41:D801–7. doi: 10.1093/nar/gks1065. [DOI] [PMC free article] [PubMed] [Google Scholar]
- 20.Guleria A, Bajpai NK, Rawat A, Khetrapal CL, Prasad N, Kumar D. Metabolite characterisation in peritoneal dialysis effluent using high-resolution (1)H and (1)H-(13)C NMR spectroscopy. Magn Reson Chem. 2014;52:475–9. doi: 10.1002/mrc.4094. [DOI] [PubMed] [Google Scholar]
- 21.Nicholson JK, Foxall PJ, Spraul M, Farrant RD, Lindon JC. 750 MHz 1H and 1H-13C NMR spectroscopy of human blood plasma. Anal Chem. 1995;67:793–811. doi: 10.1021/ac00101a004. [DOI] [PubMed] [Google Scholar]
- 22.Ala-Korpela M, Pentikäinen MO, Korhonen A, Hevonoja T, Lounila J, Kovanen PT. Detection of low density lipoprotein particle fusion by proton nuclear magnetic resonance spectroscopy. J Lipid Res. 1998;39:1705–12. [PubMed] [Google Scholar]
- 23.Malik A, Sharma U, Lakshmy R, Narang R, Jagannathan NR. Biochemical characterization of blood plasma of coronary artery disease patients by in vitro high-resolution proton NMR spectroscopy. J Biosci. 2015;40:31–9. doi: 10.1007/s12038-014-9493-1. [DOI] [PubMed] [Google Scholar]
- 24.Liu M, Tang H, Nicholson JK, Lindon JC. Use of 1H NMR-determined diffusion coefficients to characterize lipoprotein fractions in human blood plasma. Magn Reson Chem. 2002;40:S83–8. [Google Scholar]
- 25.Xia J, Sinelnikov IV, Han B, Wishart DS. MetaboAnalyst 3.0-making metabolomics more meaningful. Nucleic Acids Res. 2015;43(W1):W251–W257. doi: 10.1093/nar/gkv380. [DOI] [PMC free article] [PubMed] [Google Scholar]
- 26.Xia J, Psychogios N, Young N, Wishart DS. MetaboAnalyst: A web server for metabolomic data analysis and interpretation. Nucleic Acids Res. 2009;37:W652–60. doi: 10.1093/nar/gkp356. [DOI] [PMC free article] [PubMed] [Google Scholar]
- 27.Xia J, Wishart DS. Web-based inference of biological patterns, functions and pathways from metabolomic data using MetaboAnalyst. Nat Protoc. 2011;6:743–60. doi: 10.1038/nprot.2011.319. [DOI] [PubMed] [Google Scholar]
- 28.Schulze PC, Yoshioka J, Takahashi T, He Z, King GL, Lee RT. Hyperglycemia promotes oxidative stress through inhibition of thioredoxin function by thioredoxin-interacting protein. J Biol Chem. 2004;279:30369–74. doi: 10.1074/jbc.M400549200. [DOI] [PubMed] [Google Scholar]
- 29.Nita M, Grzybowski A. The role of the reactive oxygen species and oxidative stress in the pathomechanism of the age-related ocular diseases and other pathologies of the anterior and posterior eye segments in adults. Oxid Med Cell Longev 2016. 2016:3164734. doi: 10.1155/2016/3164734. [DOI] [PMC free article] [PubMed] [Google Scholar]
- 30.Neely JR, Morgan HE. Relationship between carbohydrate and lipid metabolism and the energy balance of heart muscle. Annu Rev Physiol. 1974;36:413–59. doi: 10.1146/annurev.ph.36.030174.002213. [DOI] [PubMed] [Google Scholar]
- 31.Friedrich N. Metabolomics in diabetes research. J Endocrinol. 2012;215:29–42. doi: 10.1530/JOE-12-0120. [DOI] [PubMed] [Google Scholar]
- 32.Jiang CY, Yang KM, Yang L, Miao ZX, Wang YH, Zhu HB. A (1) H NMR-based metabonomic investigation of time-related metabolic trajectories of the plasma, urine and liver extracts of hyperlipidemic hamsters. PLoS One. 2013;8:e66786. doi: 10.1371/journal.pone.0066786. [DOI] [PMC free article] [PubMed] [Google Scholar]
- 33.Rennie MJ. Muscle protein turnover and the wasting due to injury and disease. Br Med Bull. 1985;41:257–64. doi: 10.1093/oxfordjournals.bmb.a072060. [DOI] [PubMed] [Google Scholar]
- 34.Nair KS, Ford GC, Ekberg K, Fernqvist-Forbes E, Wahren J. Protein dynamics in whole body and in splanchnic and leg tissues in type I diabetic patients. J Clin Invest. 1995;95:2926–37. doi: 10.1172/JCI118000. [DOI] [PMC free article] [PubMed] [Google Scholar]
- 35.Tajiri K, Shimizu Y. Branched-chain amino acids in liver diseases. World J Gastroenterol. 2013;19:7620–9. doi: 10.3748/wjg.v19.i43.7620. [DOI] [PMC free article] [PubMed] [Google Scholar]
- 36.Dejong CH, van de Poll MC, Soeters PB, Jalan R, Olde Damink SW. Aromatic amino acid metabolism during liver failure. J Nutr. 2007;137(6 Suppl 1):1579S–85S. doi: 10.1093/jn/137.6.1579S. [DOI] [PubMed] [Google Scholar]
- 37.Saiz L, Bandyopadhyay S, Klein ML. Towards an understanding of complex biological membranes from atomistic molecular dynamics simulations. Biosci Rep. 2002;22:151–73. doi: 10.1023/a:1020130420869. [DOI] [PubMed] [Google Scholar]
- 38.Sztalryd C, Kimmel AR. Perilipins: Lipid droplet coat proteins adapted for tissue-specific energy storage and utilization, and lipid cytoprotection. Biochimie. 2014;96:96–101. doi: 10.1016/j.biochi.2013.08.026. [DOI] [PMC free article] [PubMed] [Google Scholar]
- 39.Fon Tacer K, Rozman D. Nonalcoholic Fatty liver disease: Focus on lipoprotein and lipid deregulation. J Lipids 2011. 2011:783976. doi: 10.1155/2011/783976. [DOI] [PMC free article] [PubMed] [Google Scholar]
- 40.Byrne CD, Olufadi R, Bruce KD, Cagampang FR, Ahmed MH. Metabolic disturbances in non-alcoholic fatty liver disease. Clin Sci (Lond) 2009;116:539–64. doi: 10.1042/CS20080253. [DOI] [PubMed] [Google Scholar]
- 41.Corey KE, Mendez-Navarro J, Barlow LL, Patwardhan V, Zheng H, Kim AY, et al. Acute hepatitis C infection lowers serum lipid levels. J Viral Hepat. 2011;18:e366–71. doi: 10.1111/j.1365-2893.2011.01434.x. [DOI] [PMC free article] [PubMed] [Google Scholar]
- 42.Ahn J, Lim U, Weinstein SJ, Schatzkin A, Hayes RB, Virtamo J. Prediagnostic total and high-density lipoprotein cholesterol and risk of cancer. Cancer Epidemiol Biomarkers Prev. 2009:1055–9965. doi: 10.1158/1055-9965.EPI-08-1248. [DOI] [PMC free article] [PubMed] [Google Scholar]
- 43.Lin B, Zhang H, Lin Z, Fang Y, Tian L, Yang H, et al. Studies of single-walled carbon nanotubes-induced hepatotoxicity by NMR-based metabonomics of rat blood plasma and liver extracts. Nanoscale Res Lett. 2013;8:236. doi: 10.1186/1556-276X-8-236. [DOI] [PMC free article] [PubMed] [Google Scholar]
- 44.Bell JD, Brown JC, Nicholson JK, Sadler PJ. Assignment of resonances for ‘acute-phase’ glycoproteins in high resolution proton NMR spectra of human blood plasma. FEBS Lett. 1987;215:311–5. doi: 10.1016/0014-5793(87)80168-0. [DOI] [PubMed] [Google Scholar]
- 45.Arnold JN, Saldova R, Hamid UM, Rudd PM. Evaluation of the serum N-linked glycome for the diagnosis of cancer and chronic inflammation. Proteomics. 2008;8:3284–93. doi: 10.1002/pmic.200800163. [DOI] [PubMed] [Google Scholar]
- 46.Bieberich E. Synthesis, processing, and function of N-glycans in N-glycoproteins. Glycobiology of the Nervous System. New York: Springer; 2014. pp. 47–70. [DOI] [PMC free article] [PubMed] [Google Scholar]
- 47.Fages A, Duarte-Salles T, Stepien M, Ferrari P, Fedirko V, Pontoizeau C, et al. Metabolomic profiles of hepatocellular carcinoma in a European prospective cohort. BMC Med. 2015;13:242. doi: 10.1186/s12916-015-0462-9. [DOI] [PMC free article] [PubMed] [Google Scholar]
- 48.Embade N, Mariño Z, Diercks T, Cano A, Lens S, Cabrera D, et al. Metabolic characterization of advanced liver fibrosis in HCV patients as studied by serum 1H-NMR spectroscopy. PLoS One. 2016;11:e0155094. doi: 10.1371/journal.pone.0155094. [DOI] [PMC free article] [PubMed] [Google Scholar]
- 49.Amathieu R, Triba MN, Nahon P, Bouchemal N, Kamoun W, Haouache H, et al. Serum 1H-NMR metabolomic fingerprints of acute-on-chronic liver failure in intensive care unit patients with alcoholic cirrhosis. PLoS One. 2014;9:e89230. doi: 10.1371/journal.pone.0089230. [DOI] [PMC free article] [PubMed] [Google Scholar]
Associated Data
This section collects any data citations, data availability statements, or supplementary materials included in this article.
Supplementary Materials
Principal component analysis score plot of control versus erythromycin of Carr–Purcell–Meiboom–Gill and diffusion edited spectra
Box-whisker plots of metabolites that were significantly perturbed across the erythromycin and control groups derived from Carr–Purcell–Meiboom–Gill and diffusion edited spectra. The blank circles represent the outlier data points which are not included in the box-plot calculation