

Abstract
The year 2015 is notable for the coincidence of several strong climate indicators that having bearing on the occurrence and intensity of tropical cyclones worldwide. This year, 2015, is clearly on track to become the warmest on record in terms of global temperatures. During the latter half of 2015, a very strong El Niño has formed and is predicted to build impressively, perhaps rivaling the memorable El Niño of 1997/1998. Warm Pacific Ocean temperatures, coupled with a strengthening El Niño, have supported the proliferation of Western North Pacific basin typhoons and Eastern/Central North Pacific Hurricanes. Most notable among these, Hurricane Patricia formed on October 20, 2015 and experienced extremely rapid intensification to become the strongest hurricane in the history of the Western Hemisphere and then weakened just as abruptly before dissipating on October 24, 2015. Rather than an aberration, these climate patterns of 2015 represent an ongoing trend with implications for the disaster health of coastal populations worldwide.
Keywords: accumulated cyclone energy (ACE), climate change, El Niño, ENSO, hurricanes, temperature anomalies, tropical cyclones, typhoons
Introduction
In 2015, increasing global temperatures and a vigorous El Niño are influencing the formation and movement of hurricanes, typhoons, and other tropical cyclones (TCs) worldwide. This convergence of elevated climate indicators appears to be affecting the frequency, intensity, and global geographic distribution of TCs. Climate scientists are actively exploring the complex interactions and interrelationships among these climate patterns in relation to TC development, seasonal and long-term secular frequencies, storm strength, and locale of formation and maximal intensification. When considered in longitudinal perspective, the year 2015 represents the continuation of ongoing climate changes rather than an exceptional spike or aberration. This composite of factors, including a warming planet, rising sea levels, and more frequent occurrences of “extreme” El Niño events, has implications for the disaster health of human populations, particularly for coastal and island residents living in areas that are regularly impacted by TCs.
Tropical cyclones
Tropical cyclones (TCs) are “cyclonic” weather systems composed of large rotating masses of thunderstorms. These systems form over the warm ocean waters of the tropics and subtropics usually between the latitudes of 30° N and 30° S. TCs originate and move within 7 tropical cyclone “basins” worldwide, 4 above the equator and 3 below the equator (Fig. 1).1
Figure 1.
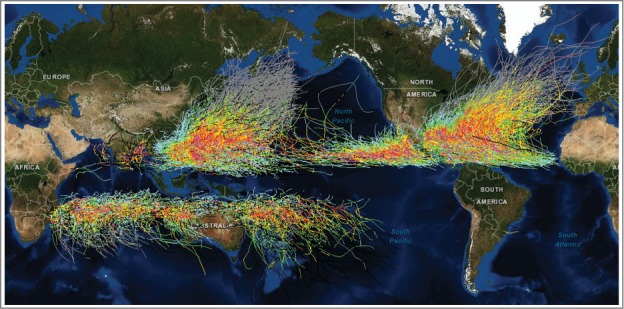
Global Cyclone Tracks 1848-2013. Warmer colors indicate stronger winds. Credit: https://geozoneblog.files.wordpress.com/2014/05/globalwrappedclipped.png.
A tropical system begins as a low-pressure trough (tropical wave) that develops into a moving concentration of thunderstorms (tropical disturbance) and begins to rotate with increasing velocity, ultimately forming a tropical depression. The direction of “spin” is counterclockwise in the Northern Hemisphere and clockwise in the Southern Hemisphere.
If the rotating depression strengthens to the point where sustained surface winds reach 39 miles/hour (62 km/hour), the system becomes a named tropical storm. With further intensification, TCs whose circulating wind speeds surpass 74 miles/hour (118 km/hour) achieve a special status and one of several monikers. Depending upon the geographic locale, these powerful storms are labeled "hurricanes" in the North Atlantic, the Caribbean, the Gulf of Mexico, the eastern and central North Pacific, and along the west coast of Mexico; "typhoons" in the western North Pacific; and "cyclones" in the Indian Ocean and Australasia (Fig. 1).1
There are 6 necessary ingredients for TC formation. First, TCs require warm ocean waters of at least 26.5o C to a minimum depth of 50 m (165 feet). TCs are monstrous heat engines, deriving their “fuel” from the warmth of the sea.1 Second, the atmosphere above the warm sea surface must cool rapidly with increasing vertical height; this is necessary for transforming the ocean's heat energy into thunderstorms. Third, inside the gathering cloud mass, there must be a moisture-laden layer at mid-troposphere altitude, 5 km (3 miles) above the ocean, to facilitate thunderstorm development.
Fourth, there must be a significant “Coriolis force” in effect. Due to the Earth's rotation, TCs tend to move from east to west and curve away from the equator. This is particularly evident upon examination of a composite graphic showing 165 years of TC tracks globally (Fig. 1). The Coriolis force is a by-product of the Earth's rotation that helps to spin the aggregation of thunderstorms into the characteristic spiral of circulating winds. In the Northern Hemisphere, Coriolis forces deflect winds to the right, and also tend to bend the path of the entire cyclonic system to the right and generally northward, away from the equator. Conversely, winds deflect left, and TCs bend left, in the Southern Hemisphere and away from the equator. Coriolis forces only operate at a distance from the equator. Hence, TCs do not form along a narrow beltline directly along the equator between 5 o N and 5 o S (see Fig. 1).
Fifth, hurricane development requires an organized, rotating system characterized by spin (vorticity) and low-level inflow (convergence). Sixth and finally, in order for a tropical system to survive, there must be minimal vertical “shear.” Wind shear is defined as a change in wind speed and/or direction with increasing altitude above the ocean surface. Shear can slice apart the towering, spinning cloud formation or snuff out the chimney effect that moves air vertically, allowing the system to “breathe.”
As the year unfolds, climate patterns in 2015 are interacting in important ways with TC formation and the concomitant human impacts from these storms. The following combination of narrative, high-resolution graphics, and links to online resources tells the story.
First, global temperatures are rising on both land and sea and the annual average temperature for 2015 will set a new record
Overwhelming and unassailable expert consensus indicates that Planet Earth is getting hotter2-8 and that human (“anthropogenic”) actions are major contributors to global warming.5 Although temperatures constantly fluctuate in complex ways, it is possible to observe robust patterns emerging over time. Across 136 years of temperature observations these changes have not been subtle. For global temperature, the trend line is steadily rising.
Dating from the year 1880, meteorologists, and more recently climate scientists, have been collecting and systematically tabulating global temperature data. Currently, researchers based at 1) the National Oceanic and Atmospheric Administration (NOAA); 2) the National Aeronautics and Space Administration (NASA); 3) the Climatic Research Center, United Kingdom Meteorological Office - Hadley Center (Met Office); and 4) the Japan Meteorological Agency (JMA) are independently monitoring land and ocean surface temperatures, so it is possible to compare and validate their findings. The close concordance of the temperature data generated by each of these 4 sources is visually apparent upon examination of the 4 overlapping plots of annual average temperature anomalies from 1880 to the present (Fig. 2).
Figure 2.
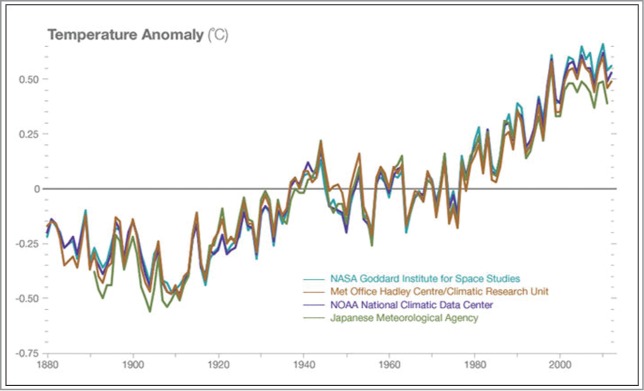
International Consensus on Rising Global Temperatures. Credit: NASA Global Climate Change, http://climate.nasa.gov/scientific-consensus/.
NOAA's National Center for Environmental Information (NCEI) examines “temperature anomalies” over periods of a month, multiple months, a year, or multiple years for the entire land and sea surface of the Earth. As NOAA uses the term, an “anomaly” denotes the temperature departure from a reference value. A positive departure indicates higher temperatures compared to the norm.
A depiction of planetary warming has been generated from the anomalies database at NCEI. Fig. 3 presents the temperature anomalies for January through August for each of the 136 years, 1880 through 2015. The figure was created using the NCEI public domain database available at “Climate at a Glance - Time Series” (http://www.ncdc.noaa.gov/cag/time-series/global). The consistent trend in the Earth's temperature rise is unmistakable. The graph for full calendar years, 1880-2014, displays a parallel up-sloping pattern.
Figure 3.
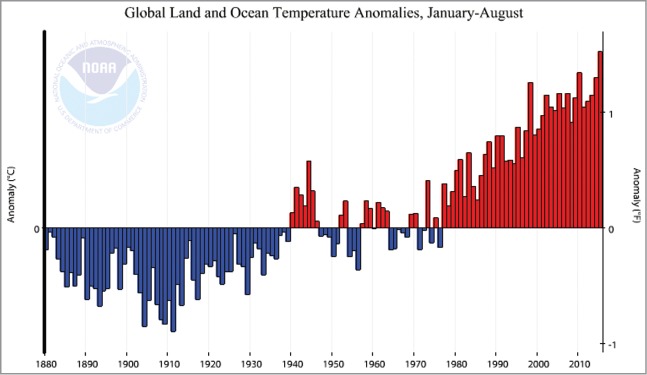
Land and Ocean Temperature Anomalies, January-August, 1880-2015. Credit: NOAA/NCEI Climate at a glance: Time series https://www.ncdc.noaa.gov/cag/time-series/global/globe/land_ocean/ytd/8/1880-2015.
Not surprisingly, as temperatures march upward, the annual average global temperatures have frequently reached new peaks in recent years. Of particular note, each of the first 15 years of the current century, 2001-2015, has registered high positive temperature departures above the reference norms for the months January through August. In fact, these 15 years, along with 1998, represent the 16 highest positive anomaly years in the 136-year history of temperature recording according to the NCEI database.
In the first 8 months of 2015, several new monthly high temperature records have been set and new daily highs have been registered for multiple dates. It appears that 2015 will continue on pace to become the hottest year since the inception of record keeping.9 Once confirmed, the year 2015 will surpass and supplant 2014 at the top of the list.2 Detailed findings for 2014 have been recently published in the “State of the Climate in 2014” report2 and succinctly summarized in a “NOAA News” brief available at: http://www.noaanews.noaa.gov/stories2015/071615-international-report-confirms-2014-was-earths-warmest-year-on-record.html. The occurrence of 2 consecutive “warmest-ever” years represents the continuation of a long-term rising trend.
Researchers at the Met Office, the United Kingdom's hub for weather and climate science, issued an update in September 2015 regarding “big changes” in the global climate system.10 The report confirms that the Met Office's December 2014 prognostications - that 2015 will be the warmest year ever - are precisely on target through August 2015. The Met Office further predicts that 2016 will follow suit. The reasoning is that the presence of a strong El Niño during the early months of 2016 will produce a “lagged” temperature-boosting effect globally.10
As another graphic portrayal of current global scenarios (Fig. 4), NOAA's world map shows the “blended” land and sea surface “temperature percentiles” in a manner that is visually clear and elegantly informative. NOAA researchers combined the land surface temperatures from the Global Historical Climate Network-Monthly (GHCN-M) with the sea surface temperatures (SSTs) from the extended reconstructed sea surface temperature (ERSST) analysis to create a unified global map. Researchers selected a standard pseudocylindrical map projection that is overlaid with a color-coded grid of cells (each representing 5o latitude × 5o longitude) to show how the August 2015 monthly temperatures depart from the Twentieth Century norms. For each cell, the anomaly was computed by comparing the August 2015 temperature to the average August temperature for the same geographic coordinates for the period 1901-2000 (http://www.ncdc.noaa.gov/sotc/global/201508).
Figure 4.
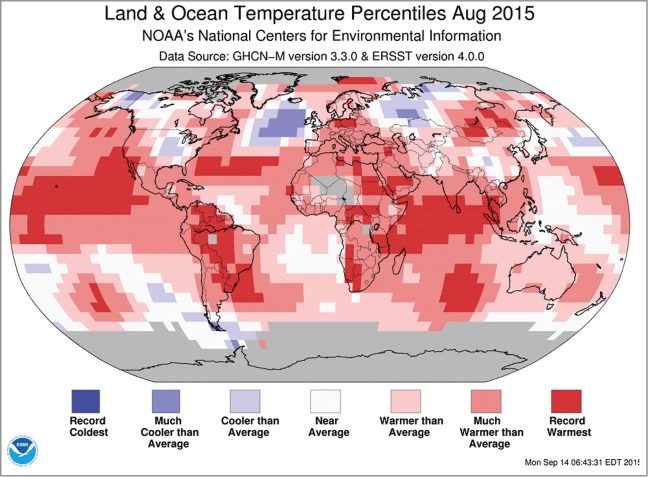
Land and Ocean Temperature Percentiles, August 2015. Credit: NOAA Global Analysis – July 2015. https://www.ncdc.noaa.gov/sotc/service/global/map-percentile-mntp/201508.gif.
Just a quick glance at Figure 4 is sufficient to ascertain that most of the globe is colored in pink, rose, and red hues, indicating temperatures that are elevated above the norms (positive anomalies). Focusing on the cells colored in bright red, it is apparent that large expanses of sea surface, most notably in the Pacific and Indian Oceans and the Caribbean; and land surface, particularly in South America and Africa, were experiencing “record warmest” temperatures during August 2015. Indeed, August 2015 was noteworthy for having the highest land temperature, the highest ocean temperature, and the highest land-and-ocean-combined temperature of any August in the 136-year time series.
It is important to clarify that most of the climate system's warming is taking place within the ocean. In contrast, atmospheric warming is a relatively minor player. In fact, rising ocean temperatures contribute significantly to warming the atmosphere.2
Second, a powerful El Niño is setting up and strengthening in the equatorial waters of the Pacific Ocean
The El Niño-Southern Oscillation (ENSO) describes fluctuations in temperature between the ocean and the atmosphere in the east-central equatorial Pacific Ocean. Temperatures vacillate between El Niño, the warm phase of ENSO, and La Niña, the cool phase, with many intervening months when temperatures hover close to long-term norms.
NOAA provides the following technical consensus definition of El Niño: “A phenomenon in the equatorial Pacific Ocean characterized by a positive sea surface temperature departure from normal in the Niño 3.4 region greater than or equal in magnitude to 0.5 degrees C (0.9 degrees Fahrenheit), averaged over 3 consecutive months (http://www.nws.noaa.gov/ost/climate/STIP/ElNinoDef.htm). The norm that is used is the 3-month moving average temperature for a specific Pacific ocean area directly along the equator (“Niño 3.4 region”) for the preceding 3 full decades (currently: 1981-2010). The El Niño or “warm ENSO” typically occurs every 2-7 years and lasts for approximately 9-12 months.
NOAA's El Niño Portal (http://www.elnino.noaa.gov) affirms that El Niño produces “important consequences for weather and climate around the globe.” El Niño produces numerous aberrations in global weather conditions that vary by geography and season, but are nevertheless predictable and relatively consistent each time a strong El Niño occurs (Fig. 5).
Figure 5.
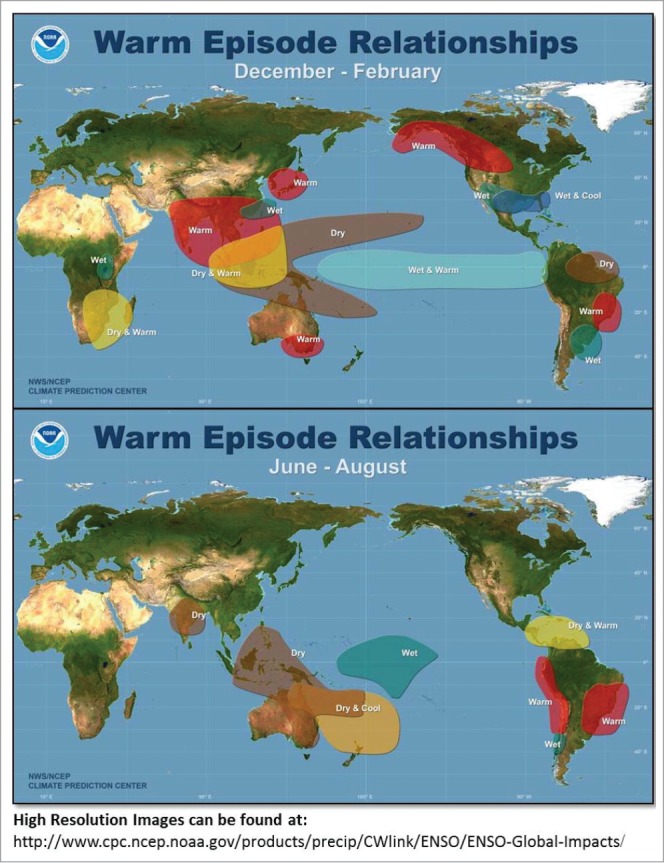
Warm ENSO (El Niño) Climate Changes by Season. Credit: NOAA Climate Prediction Center: http://www.cpc.ncep.noaa.gov/products/analysis_monitoring/impacts/warm.gif.
NOAA's Climate Prediction Center (CPC) and the National Center for Environmental Prediction (NCEP) made 3 statements in their El Niño Advisory released on September 21, 2015:11
El Niño conditions are present.
Positive equatorial sea surface temperature (SST) anomalies continue across most of the Pacific Ocean.
There is an approximately 95% chance that El Niño will continue through Northern Hemisphere winter 2015-16, gradually weakening through spring 2016.
The CPC noted that sea surface temperatures during August 2015 were approximately 2°C (3.6°F) above the 1981–2010 average, or greater, in the eastern half of the equatorial Pacific Ocean, consistent with the presence of an El Niño.
The significance of El Niño for global temperatures is partially based on the creation of a positive feedback loop, usually causing a 0.1o C temperature increase worldwide. As one immediate consequence - a kind of exclamation point to the extant and evolving conditions - the strengthening El Niño virtually guarantees that the final months of 2015 will be warm enough to clinch the new annual high temperature record. The NOAA advisory predicts that conditions will lead to the official declaration of a “strong” El Niño during Fall 2015 and that this El Niño will maintain strength during the winter months prior to diminishing during late spring 2016.11 How strong is the current El Niño? Based on the remarkable similarities in the evolving climate conditions, scientists have speculated that the 2015/2016 El Niño will rival its strongest predecessor on record, the infamous 1997/1998 El Niño (https://www.washingtonpost.com/blogs/capital-weather-gang/wp/2015/08/13/noaa-el-nino-is-significant-and-strengthening-could-rival-strongest-on-record/). The memorable warm ENSO of 1997/1998 triggered epic floods, droughts, and pandemics and was dubbed “the climate event of the Twentieth Century.”12
On the subject of the prognosis for the strengthening 2015/2016 El Niño, climate models from the United Kingdom's Met Office demonstrate that current patterns of equatorial Pacific warming are closely reproducing conditions seen during 1997/1998. On visual inspection of side-by-side global images from August 1997 and August 2015, the comparability of the Pacific Ocean heating patterns is striking. Fig. 6 derives from an animation showing the progression of the 2 El Niño events from January through early August produced by the U.S. National Center for Atmospheric Research in Boulder, Colorado (https://www.youtube.com/watch?v=whsQbIwWjBo).
Figure 6.
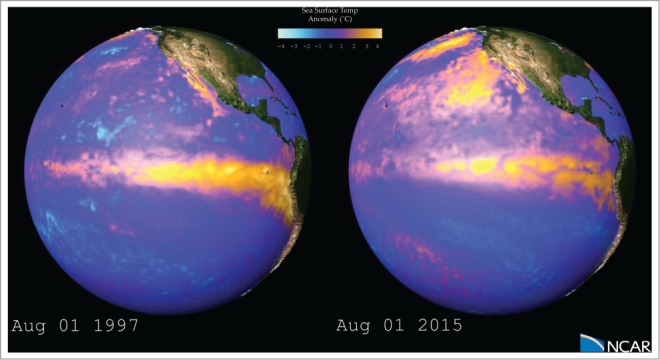
1997 and 2015 El Niño Sea Surface Temperature Anomalies. © 2015 UCAR. Reproduced by permission of Matt Rehme, National Center for Atmospheric Research. Permission to reuse must be obtained from the rightsholder.
An El Niño event reorganizes atmospheric convection and, in turn, broadly reconfigures global weather patterns. Strong or extreme El Niño events feature a pronounced eastward extension of the warm pool of western Pacific Ocean waters, coupled with atmospheric convection. This creates multiple outcomes; for example, rainfall in the usually dry equatorial eastern Pacific increases markedly. El Niño affects ecosystems and agriculture while also influencing climatological patterns. The warm ENSO alters the worldwide frequency and distribution of droughts, floods, brushfires, tropical cyclones, and other extreme weather events.13
While the 2015/2016 El Niño is a contender to be one of the strongest on record, this is not the end of the story. In the future, such extreme El Niño conditions are likely to occur more often. With ongoing greenhouse warming, climate models have predicted a doubling in the frequency of these powerful El Niño events primarily due to the mechanism of rapid surface heating of the eastern Pacific equatorial waters.13 These waters warm at a rate much faster than the surrounding ocean thus facilitating and intensifying atmospheric convection in the eastern Pacific equatorial region.13
Third, rising global temperatures and a surging El Niño are influencing the global frequency and distribution of tropical cyclones in 2015
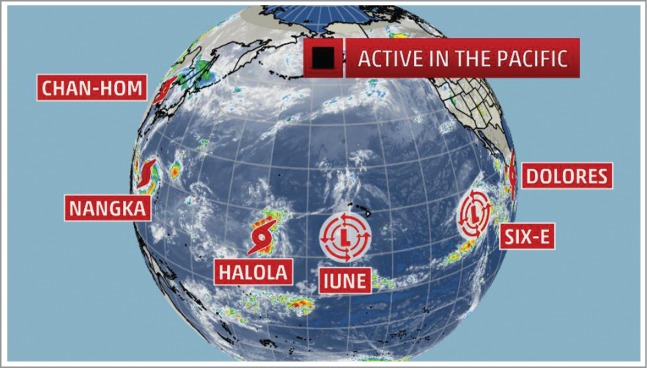
The warm ENSO influences the global patterning of low-pressure systems that produce storms, including TCs. As noted, TCs with winds in excess of 74 mph are variously termed hurricanes, typhoons, or cyclones depending upon the TC basin of origin. The presence of an El Niño usually energizes the TC seasons in the North Pacific by creating the superheated equatorial waters that power these storms while simultaneously reducing vertical wind shear. These cyclone-promoting phenomena are currently playing out in 2015 for both the eastern/central North Pacific hurricane basin and the western North Pacific typhoon basin.
Through September 30, 2015, the eastern/central North Pacific hurricane season produced 23 tropical depressions, including 20 that intensified to become named tropical storms (Table 1, Fig. 7). Twelve of these 20 tropical storms strengthened to become hurricanes. Wind velocities accelerated to the level of “major” hurricanes (Category 3 or higher) for 8 of the 12 hurricanes, with 7 reaching Category 4 status. The eastern/central North Pacific hurricane season continues to be highly active through Fall 2015.
Table 1.
2015 Tropical Cyclones through September 30, 2015.
| Named Storms |
|||||||
|---|---|---|---|---|---|---|---|
| Hurricane or Typhoon Force Winds |
|||||||
| “Major” Tropical Cyclone | |||||||
| Tropical Depression | Tropical Storm | Cat 1 | Cat 2 | Cat 3 | Cat 4 | Cat 5 | |
| Tropical Cyclone Basin |
0-38 mph 0-33 knots 0-61 km/h |
39-73 mph 34-64 knots 62-118 km/h |
74-95 mph 65-83 knots 119-153 km/h |
96-110 mph 84-95 knots 154-177 km/h |
111-130 mph 96-113 knots 178-208 km/h |
131-155 mph 114-134 knots 209-251 km/h |
>156 mph >135 knots >252 km/h |
| Atlantic | 1 | 7 | 1 | 0 | 2* | 0 | 0 |
| Eastern/Central North Pacific | 3 | 8 | 3 | 1 | 1 | 7 | 0 |
| Western North Pacific | 5 | 9 | 1 | 2 | 5 | 7 | 0 |
Hurricane Joaquin reached Category 3 on September 30, but peaked at Category 4 October 1-3, almost reaching Category 5 on October 3, 2015.
Figure 7.
July 12, 2015: Six Simultaneous Tropical Systems in the North Pacific Basins, July 12, 2015. Credit: http://www.weather.com/storms/typhoon/news/five-tropical-cyclones-pacific-july2015.
Equally impressive, through September 30, 2015, the western North Pacific typhoon season produced 29 storms of tropical depression strength or higher (Table 1, Fig. 8). Using the official typhoon classification system for this TC basin, these 29 storms partitioned into: 7 tropical depressions, 5 tropical storms, 3 “strong” tropical storms, 8 typhoons, and 6 super typhoons. To facilitate direct comparison with the TC seasons in the Atlantic and eastern/central North Pacific hurricane basins, Table 1 uses the wind speed categories from the Saffir-Simpson Hurricane Wind Scale (SSHWS). This creates a modified classification of the 29 storms in the western North Pacific typhoon basin through the end of September 2015: 5 tropical depressions, 9 tropical storms, and 15 hurricane-force typhoons including 12 with “major” Category 3 or 4 wind speeds. The western North Pacific typhoon season also continues to be highly active through Fall 2015.
Figure 8.
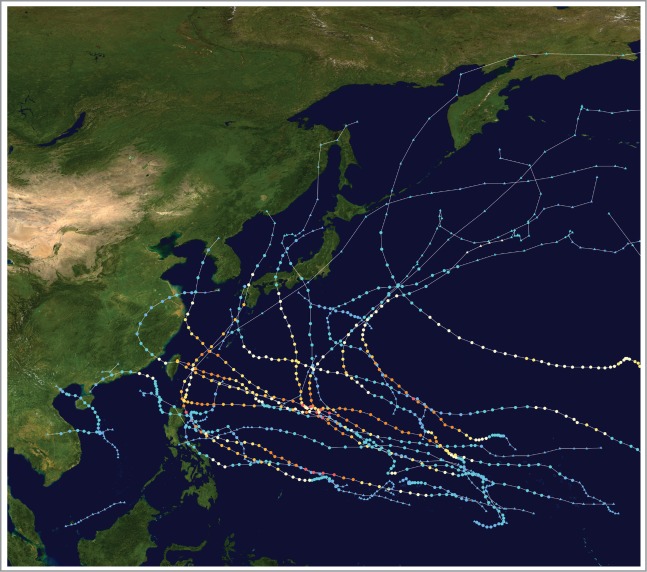
2015 Western North Pacific Hurricane Season through September 30, 2015. Credit: https://en.wikipedia.org/wiki/2015_Pacific_typhoon_season#/media/File:2015_Pacific_typhoon_season_summary.png.
In contrast, during El Niño, high-pressure systems (usually associated with sinking air) and vertical wind shear increase in the North Atlantic hurricane basin, making it difficult for the storms to form and strengthen. In 2015, the number of TCs that have formed in the Atlantic Basin is actually close to seasonal averages. NOAA's Hurricane Research Division reports the following annual averages for the period 1968-2014: 11.8 named storms, 6.2 hurricanes, and 2.4 “major” hurricanes (categories 3-5 on the SSHWS) (http://www.aoml.noaa.gov/hrd/tcfaq/E11.html). During the first 4 months of the 2015 Atlantic hurricane season, June 1 through September 30, a total of 11 tropical depressions formed including 10 named storms, 3 hurricanes, and 2 major hurricanes. Two months remain in the official season.
Throughout July to September 2015, numerous tropical waves formed directly off the coast of Africa but while moving westward in the direction of the Caribbean and the Americas, these systems tended to encounter dry air masses and strong shear. Most waves failed to evolve into tropical depressions. Several storms that formed quickly fell apart in hostile environments.
Three Atlantic storms achieved hurricane status through September 30, 2015. Hurricane Danny ramped up to Category 3 wind speeds briefly but dissipated before affecting any populated areas. Hurricane Fred (Category 1) was notable as one of very few TCs to form east of 20o W longitude. Fred formed so far east in the Atlantic that the storm created minor impacts for the Cape Verde Islands directly off the African coast. The powerhouse of the 2015 North Atlantic season so far has been Hurricane Joaquin, a TC that increased to Category 4 status during October 1-3 while moving slowly over the central Bahamas (Table 1, Fig. 9).
Figure 9.
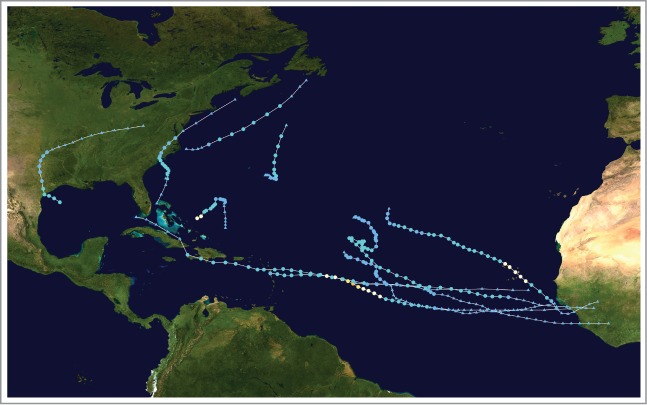
2015 Atlantic Hurricane Season through September 30, 2015. Credit: https://upload.wikimedia.org/wikipedia/commons/f/fc/2015_Atlantic_hurricane_season_summary_map.png.
With two months remaining in the official Atlantic hurricane season, and with SSTs far above seasonal norms, the prospect for additional strong storms remains a possibility. El Niño tends to diminish storm numbers but may increase storm intensities in the Caribbean (case in point: Hurricane Joaquin) and the Gulf of Mexico.
In summary, the 2015 Atlantic Basin hurricane season to date, with typical storm numbers but primarily low intensities is offset by the more numerous North Pacific Ocean hurricanes and typhoons that have already subjected millions of persons to powerful winds, storm surges, and deluging rains. The proliferation of Pacific storms has already created situations when multiple tropical systems coexist across the basin. In fact, for only the second time in recorded history, on July 12, 2015, 6 active storms were arrayed across the Pacific concurrently (Fig. 10).
Figure 10.
July 12, 2015: Six Simultaneous Tropical Systems in the North Pacific Basins, July 12, 2015. Credit: http://www.weather.com/storms/typhoon/news/five-tropical-cyclones-pacific-july2015.
Fourth, tropical cyclone intensity appears to be increasing over time
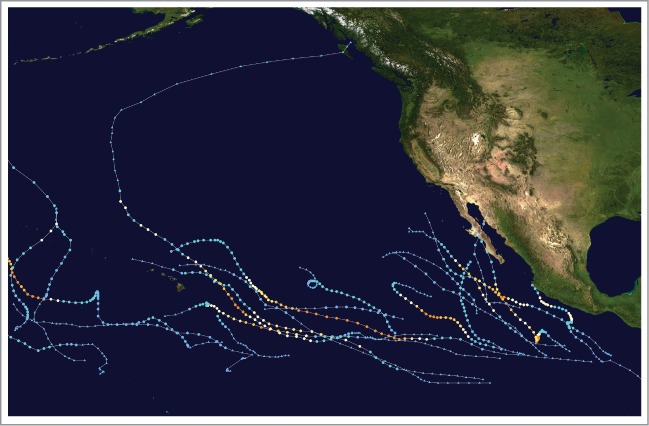
During 2015, the number and proportion of “major” TCs, defined as Category 3 or higher on the 5-category SSHWS, are higher than usual for both the western and eastern/central North Pacific. This is particularly apparent from the tallies of storms by intensity, through September 30, 2015, displayed in Table 1. As one vivid example, not only did 3 eastern/central North Pacific hurricanes - Ignacio, Jimena, and Kilo - co-habit the Pacific basin in the vicinity of Hawaii for several days (Fig. 11), on August 29, 2015 all 3 storms were simultaneously spinning at Category 4 strength, a true rarity.
Figure 11.
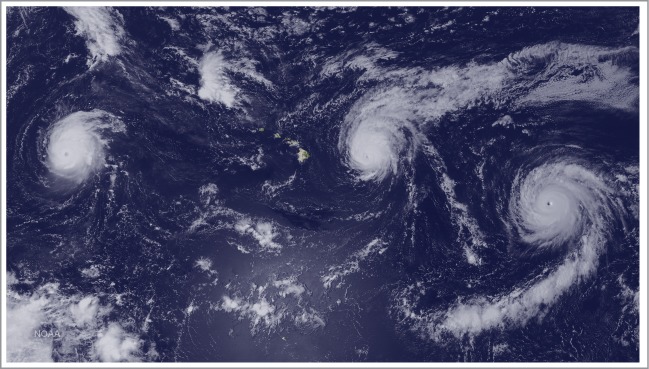
Simultaneous Hurricanes Kilo (left), Ignacio (center), and Jimena (right), in the vicinity of Hawaii, August 2015. Credit: NOAA National Weather Service National Hurricane Center http://www.nnvl.noaa.gov/MediaDetail2.php?MediaID=1760&MediaTypeID=1.
In the Atlantic basin, TC Joaquin became a hurricane on September 30 and rapidly increased to Category 3 strength. Meandering directly over the central Bahamas, Joaquin remained almost stationary for the period October 1-3, 2015, battering the islands with strong Category 4 winds before moving in a northeasterly direction and impacting Bermuda as a Category 2 storm on October 4-5, 2015. Joaquin was the strongest Atlantic basin storm since 2011 and demonstrated that, even in this strengthening El Niño year, the Atlantic can produce some strong hurricanes. Joaquin provided evidence that unseasonably warm Caribbean waters are conducive to rapid cyclone intensification with sustained strength lasting multiple days. Joaquin may also have contributed to a “complex meteorological event” that led to a 1,000-year rain event throughout South Carolina, USA, by funneling a narrow stream of water vapor directly into the state, a phenomenon described as a “hybrid atmospheric river” (http://www.forbes.com/sites/marshallshepherd/2015/10/02/what-is-an-atmospheric-river-and-why-is-this-relevant-to-joaquin-and-weekend-rainfall/) (Fig. 12).
Figure 12.
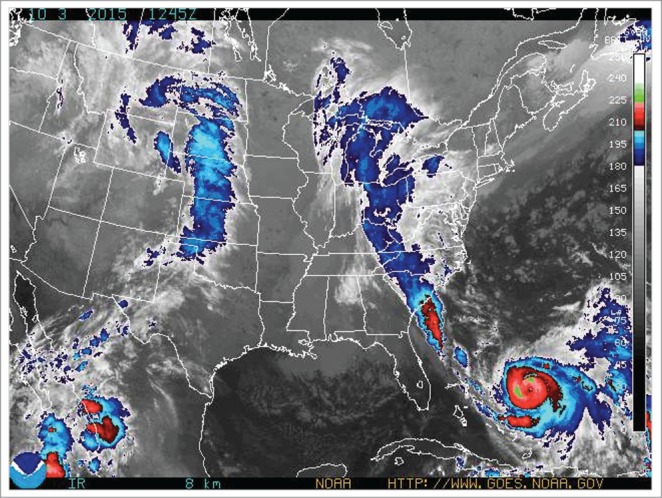
“Hybrid Atmospheric River.” This rare phenomenon brought moisture associated with Hurricane Joaquin into South Carolina that contributed to 1,000-year flooding in the state. Credit: NOAA: http://www.goes.noaa.gov.
These observations of storm intensity are consistent with research that demonstrates that TC intensity increases in the presence of a warm ENSO. This has been shown for the western North Pacific where, during El Niño years, typhoon intensity and duration both increase.14 Hotter oceans (higher SSTs) also intensify TCs. In the Atlantic Basin, “mean intensification increases by 16% for every 1°C increase in mean SST.”15 In 2015, these 2 factors are co-occurring; a robust El Niño is strengthening while SSTs are at record highs.
The relationship among SSTs, TC frequency, and TC intensity is remarkably complex. According to Kang and Elsner,16 30 years of ocean warming is associated with an increase in TC intensity worldwide but there is a “trade-off.” These researchers describe an “out-of-phase” relationship such that, during years of greater ocean warmth, TC formation is slightly inhibited (lower frequency) even as intensity is increased.16
According to Dr. James Elsner, Florida State University, there has been “an unusual level of high-latitude tropical storminess” during 2015. This is consistent with an observed trend over time featuring a “poleward migration” of the location of TC maximum intensity.17 In other words, TCs are reaching and maintaining higher intensities in latitudes that are increasingly farther away from the equator, and hence, closer to the poles.17 The research on this theme by Kossin and colleagues17 has relied on a technique that was developed by Elsner et al.18 to detect the increasing intensity of TCs. Moreover, it was precisely the Elsner paper that demonstrated that the strongest TCs are, in fact, getting more intense over time.18
The human contribution is clearly evident in the progression toward higher TC intensities. According to the World Meteorological Organization, greenhouse warming, a human-generated or “anthropogenic” factor, is projected to increase the intensity of the TCs by 2-11%.19 The human risk associated with TCs will increase concomitantly throughout the Twenty-first Century based primarily on these anthropogenic factors.19
Regarding patterns of TC intensity, it is important to introduce the metric of “accumulated cyclone energy” (ACE). As described on The Weather Underground's ACE portal, “ACE is used to express the activity and destructive potential of individual tropical cyclones and entire tropical cyclone seasons” (http://www.wunderground.com/hurricane/accumulated_cyclone_energy.asp?basin=gl#fXfP1fH0BqFrDuZP.99).
The formula for calculating the ACE for a single storm uses wind speed measures taken every 6 hours throughout the life of the storm. For example, during the 2015 North Atlantic season, the ACE for Hurricane Joaquin (the 11th TC to form) was greater than the sum of the ACE's for the 10 preceding TCs combined.
According to the ACE portal, for each TC basin, “the ACE of a season is the sum of the ACE for each storm,” combining “the number, strength, and duration of all the tropical storms in the season.” Moreover, it is possible to aggregate the ACE values for all basins to generate the “global” ACE for the calendar year.
Despite rising global temperatures and a steadily strengthening El Niño, the global ACE values for the years 2012-2014 have been among the lowest recorded since ACE calculations commenced in 1970. For 2015, ACE will be higher than for these 3 previous years but unlikely to reach or to exceed the mean ACE for the period 1970-2014.
Fifth, trends in tropical cyclone frequency are more difficult to predict
The research literature points to more intense TCs based on climate change but does not necessarily predict higher frequency over time.16,18-21 The uncertainty regarding the effect of warming oceans on TC frequency may seem counter-intuitive. Wouldn't warming oceans necessarily generate more TCs?
Here is the logic: the presence of warm SSTs is a necessary condition for TC formation. SSTs have been rising steadily and should have the effect of keeping larger expanses of the global basins percolating above the critical 26.5o C temperature threshold for TC formation (also called “cyclogenesis”1) for more days each year on average. So if rising SSTs – warmer oceans - produce more “potential formation days” each year, wouldn't this have the effect of broadening the swath of “actual TC days” throughout the annual season for each basin? This can be visualized by examining the annual hurricane cycles for the North Atlantic, eastern North Pacific, and western North Pacific basins (Figs. 13-15).
Figure 13.
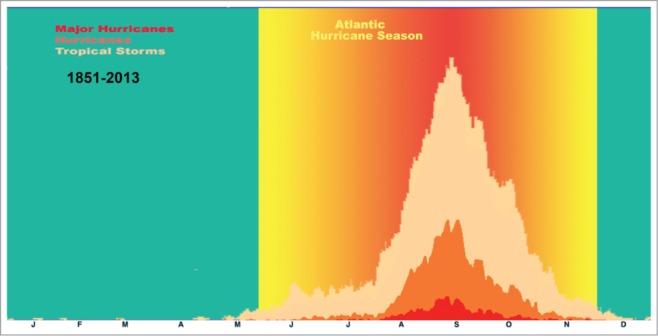
Atlantic Hurricane Season, 1851–2013. Credit: http://www.aoml.noaa.gov/hrd/tcfaq/G1.html.
Figure 14.
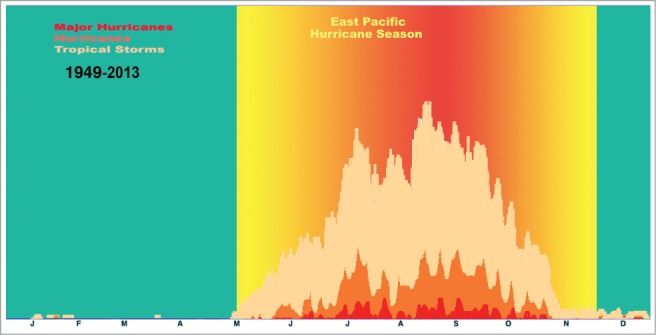
Eastern North Pacific Hurricane Season, 1949–2013. Credit: http://www.aoml.noaa.gov/hrd/tcfaq/G1.html.
Figure 15.
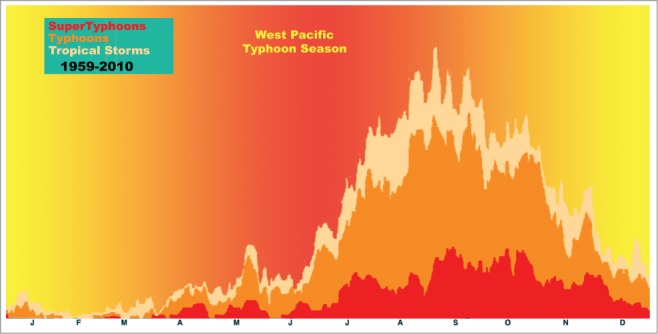
Western North Pacific Typhoon Season, 1959–2013. Credit: http://www.aoml.noaa.gov/hrd/tcfaq/G1.html.
In each of the 3 figures it is clear that TCs primarily concentrate during several months within the official seasons. As an example, in the North Atlantic basin, with the official annual season extending from June 1 to November 30, storms form only occasionally in June, the first month of the season; seldom in November, the last month; and most frequently from mid-August through early October, bracketing the seasonal peak of September 10 (Fig. 13).
Would it not be reasonable to surmise that warming oceans would increase the number of TC days each season? Over time, this would cause the distribution of TC days to become wider and flatter on each of the diagrams. Also there could also be an increase in the number of TC days forming before the designated season start date or after the official end date.
Taken together, wouldn't these changes contribute to increasing total numbers of TCs on a long-term basis? Perhaps, or alternatively, more TC days could occur as an outcome of having strong storms of longer duration, but not necessarily higher numbers of TCs.
As a starting point, in a much-cited paper, Webster et al. (2005)21 analyzed trends over 35 years, 1970-2004, and found substantial increases in both the numbers and proportions of category 4 and 5 TCs for all global basins. This reinforces the previous point that intensities appear to be increasing. However, Webster and colleagues actually found decreasing numbers of TCs and TC days during the same period. Furthermore, 10 years later, Klotzbach and Landsea (2015) 22 extended the observations out to 2014 and found a more recent downturn in numbers of category 4 and 5 TCs even with rising SSTs. They also note a highly significant downturn in ACE during recent years. Klotzbach and Landsea attribute the findings of Webster and colleagues to an artifact of improved TC tracking over time.
It is important to note that annual numbers of TCs also follow cyclical patterns that vary on the order of multiple decades (typically 30-40 years). These trends have been observed for more than a century and in the Atlantic Basin, a metric has been developed called the Atlantic Multi-decadal Oscillation (AMO). Just weeks ago, Klotzbach, Gray, and Fogarty (2015)23 published a letter in Nature that described “the end” of the current Atlantic hurricane era. Authors displayed and illustrated trends over 136 years, dating from 1880 to the present. In recent years both the AMO and the ACE have plummeted, marking the end of a high-frequency “era.” It remains to be seen how the competing roles of AMO, ACE, and anthropogenic warming evolve going forward through the Twenty-first Century.
Sixth, sea levels are rising unstoppably
Based on a 3.22 mm annual rise in sea level since 1993, the Twenty-first Century will see a 320 mm to 1 m rise in sea level. According to NASA, “Sea level rise is caused primarily by 2 factors related to global warming: the added water from melting land ice and the expansion of sea water as it warms” (http://climate.nasa.gov/vital-signs/sea-level/).
The unrelenting sea level rise interplays with TC risks to human populations in several ways. One of the most obvious and immediate effects is that sea level rise will worsen the risks from TC storm surge. As sea level rises, more coastal area will be inundated by storm surge directly beneath the rotating cyclone, particularly for the strongest storms. The storm surge from 2005 Hurricane Katrina (Category 5) was estimated to reach 8.5 m (28 ft.) in Mississippi and pushed inland for distances in excess of 2 miles. In 2013, Supertyphoon Haiyan (equivalent to Category 5) was remarkable for the loss of life directly attributable to storm surge in the Philippines.
In September and October 2015, Hurricane Joaquin hovered for days above the central Bahamas, causing major flooding across several of the islands, including Long Island, San Salvador, Cat Island, Rum Cay and Crooked Island – islands described by photojournalist Eddy Rafael as “completely obliterated” (http://www.weather.com/safety/hurricane/news/hurricane-joaquin-bahamas-impacts), Figure 16 shows that the wave heights beneath the Category 4 Joaquin were in the 6.0-9.5 m (20-31 ft.) range.
Figure 16.
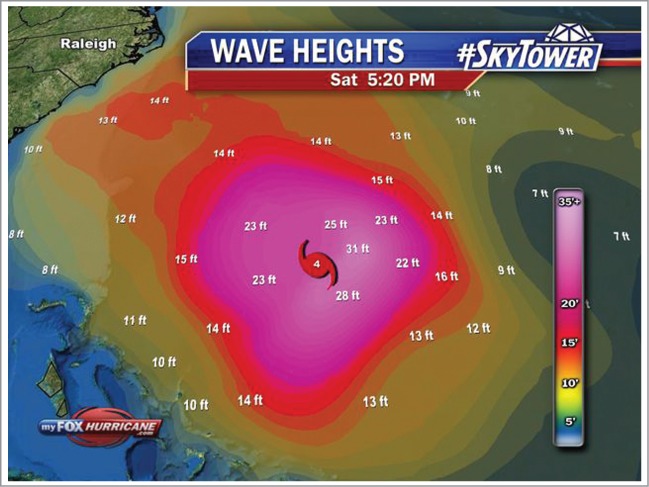
Wave Heights Associated with Atlantic Basin Hurricane Joaquin at Category 4 Strength on 3 October, 2015. Credit: http://www.myfoxhurricane.com/custom/storms/storm2_wave_heights.html.
Storm surge is also relevant when a rotating cyclone piles up waves along the shoreline. While the central Bahamas endured the continuous assault from Joaquin's Category 4 winds for several days, the continental United States did not experience any strong winds. However, the storm's circulation caused significant wave height elevation along the entire southeastern US coastline.
Sea level rise poses graver risks for coastal populations residing close to the shore. Over a period of several decades, sea level rise may appreciably diminish the amount of livable space. As ocean waters progressively encroach upon and submerge low-lying terrain, livable space will disappear. Coastal populations that are unable to erect seawalls or elevate structures will be compressed into a smaller geographic footprint. Evacuating populations to safe shelter on higher ground will be impossible in many cases and increasingly dangerous even where it is feasible.
Seventh, human settlement patterns are bringing burgeoning numbers of world citizens to coastal areas
With the upsurge in global urbanization, coastal populations are increasing in numbers and becoming ever more dense-packed thereby heightening human TC disaster risks.
“Climate migrants” will be forced to reside increasingly in densely populated urban areas. This will exacerbate the disaster risk reduction challenges, making it more difficult to evacuate or to adequately shelter coastal dwellers when a TC is approaching. The Intergovernmental Panel on Climate Change (IPCC)24 has quantified the “average physical exposure” to TCs by continent, showing the startling changes expected between 1970 and 2030 based on the assumption of constant hazard exposure based on Peduzzi25 (Fig. 17). This increase in human exposure – more than a doubling over the 60-year interval - is largely based on increasing population. However, the assumption of constant hazard exposure is unlikely. Not factored into the estimate are the likely increases in TC intensity with rising SSTs, effects of sea level rise, worsening storm surge effects, and more frequent extreme El Niños. Also, the estimate for 2030 is not an endpoint. The 2030 numbers will be eclipsed later in the century as the at-risk populations continue to increase numerically and each of the compounding risks becomes more severe.
Figure 17.

Average Physical Exposure to Tropical Cyclones (in thousands of people per year) 1970 and 2030. Credit: Diagram from IPCC, 201224 based on data from Peduzzi et al., 201125.
Concluding comments
The year 2015 is characterized as the warmest on record. A dauntingly powerful El Niño is building in the Pacific. Sea levels are rising relentlessly. In tandem with the swelling global census, population density is increasing for coastal areas and island nations at high risk for impacts from TCs. Collectively, these phenomena are modifying the global patterning of TCs. Moreover, they add support to the sobering predictions from the IPCC, predicting rapidly-escalating human exposure to cyclones worldwide (Fig. 17).3,24
Going forward, regarding TCs and other extreme weather events, the complex interrelationships among human behaviors, anthropogenic causation, and planetary climate trends create the potential for the emergence of unpredictable and unforeseen outcomes and pose immense challenges for adaptation.
Even as climate patterns are newsworthy at this moment, it is almost guaranteed that the year 2015 will not even merit a mention in the record books 5 or certainly 25 years from now. However, the headline climate events of 2015 serve as harbingers of progressively formidable challenges developing throughout the twenty-first century.
Seemingly right on cue, a 2015 “headline climate event” occurred as this Disaster Health Briefing was in production. A tropical depression formed in the Eastern North Pacific basin on October 20 and became Tropical Storm Patricia on October 21. During October 22, in one of the most rapid intensification cycles ever witnessed, this TC exploded in strength to become a Category 5 hurricane in just over 24 hours (Fig. 18). In fact, Patricia's winds reached sustained speeds of 200 mph (325 km/h) while the central pressure plummeted to 879 mbar, making Patricia the strongest TC on record in the Western Hemisphere (stronger than any previous TC in either the North Atlantic or the Eastern North Pacific basins). Perhaps equally startling, after striking the sparsely populated western coastline of Mexico close to La Manzanilla and Puerto Vallarta at Category 5 wind velocity on the evening of October 23, Patricia dissipated as rapidly as it formed, diminishing to a remnant low by the afternoon of October 24.
Figure 18.
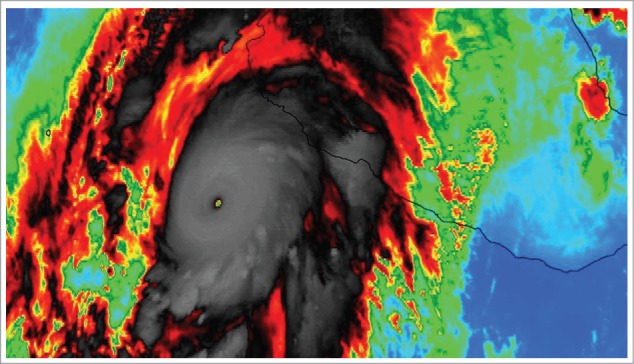
Hurricane Patricia at Category 5 Intensity Near the Coast of Mexico, October 23, 2015. Credit: Obtained from: http://www.weather.com/storms/hurricane/news/stunning-meteorological-images-hurricane-patricia with acknowledgement to NASA Earth Science Office.
Atmospheric scientists will be examining the connections among global temperatures, the 2015/2016 El Niño, and Patricia's extraordinary pace of amplification to record-setting levels of intensity (See: http://www.forbes.com/sites/marshallshepherd/2015/10/23/hurricane-patricia-is-something-we-havent-seen-before-and-there-may-be-an-el-nino-connection/).
References
- 1.Shultz JM, Russell JA, Espinel Z. Epidemiology of tropical cyclones: the dynamics of disaster, disease, and development. Epidemiol Rev. 2005; 27(1):21-35; PMID:15958424; http://dx.doi.org/ 10.1093/epirev/mxi011 [DOI] [PubMed] [Google Scholar]
- 2.Blunden J, Arndt DS. (eds.) State of the climate in 2014. Bull Amer Meteor Soc 2015; 96(7):S1-S267; https://www2.ametsoc.org/ams/index.cfm/publications/bulletin-of-the-american-meteorological-society-bams/state-of-the-climate/ [Google Scholar]
- 3.Pachauri RK, Meyer LA (eds.). Climate Change 2014: Synthesis report. Contribution of working groups I, II and III to the fifth assessment report of the Intergovernmental Panel on Climate Change. IPCC, Geneva, Switzerland, 2014. http://www.ipcc.ch/report/ar5/syr/ [Google Scholar]
- 4.Anderegg WRL, Prall JW, Harold J, Schneider SH. Expert credibility in climate change. Proc Natl Acad Sci USA 2010; 107(27):12107-9; PMID:20566872; http://dx.doi.org/ 10.1073/pnas.1003187107 [DOI] [PMC free article] [PubMed] [Google Scholar]
- 5.Cook J, Nuccitelli D, Green SA, Richardson M, Winkler B, Painting R, Way R, Jacobs P, Skuce A. Quantifying the consensus on anthropogenic global warming in the scientific literature. Environ Res Let 2013; 8(2):1-7; http://dx.doi.org/ 10.1088/1748-9326/8/2/024024 [DOI] [Google Scholar]
- 6.Doran PT, Zimmerman MK. Examining the scientific consensus on climate change. EOS Trans AGU 2009; 90(3):22; http://dx.doi.org/ 10.1029/2009eo030002 [DOI] [Google Scholar]
- 7.Oreskes N. Beyond the ivory tower: the scientific consensus on climate change. Science 2004; 306(5702):1686; PMID:15576594; http://dx.doi/ 10.1126/science.1103618. [DOI] [PubMed] [Google Scholar]
- 8.NASA http://climate.nasa.gov/scientific-consensus/ Scientific Consensus: Earth's climate is warming. National Aeronautics and Space Administration, Global Climate Change: Vital Signs of the Planet. 2015; Available from. [Google Scholar]
- 9.Thompson A, Climate Central. 2015 may just be hottest year on record. Sci American. 20 August 2014. Available from: http://www.scientificamerican.com/article/2015-may-just-be-hottest-year-on-record/ [Google Scholar]
- 10.Scaife A, Allan R, Beicher S, Brookshaw A, Davey M, Eade R, Folland C, Gordon M, Hermanson L, Ineson S, et al. Big changes underway in the climate system? Met Office; 2015 Sept 14. Available from: http://www.metoffice.gov.uk/media/pdf/8/c/Changes_In_The_Climate_System.pdf [Google Scholar]
- 11.Climate Prediction Center and National Center for Environmental Prediction (NCEP) ENSO: recent evolution, current status and prediction. National Oceanic and Atmospheric Administration (US); 2015 Sept 28. Available from: http://www.cpc.ncep.noaa.gov/products/analysis_monitoring/lanina/enso_evolution-status-fcsts-web.pdf [Google Scholar]
- 12.Changnon SA, Bell GD. El Niño 1997-1998: the climate event of the century. New York, NY: Oxford University Press; 2000. [Google Scholar]
- 13.Cai W, Borlace S, Lengaigne M, van Rensch P, Collins M, Vecchi G, Timmermann A, Santoso A, McPhaden MJ, Wu L, England MH, Wang G, Guilyardi E, Jin F-F. Increasing frequency of extreme El Niño events due to greenhouse warming. Nat Clim Chang 2014; 4(2):111-6; PMID:22895343; http://dx.doi.org/ 10.1038/nclimate210022895343 [DOI] [Google Scholar]
- 14.Camargo SJ, Sobel AH. Western north pacific tropical cyclone intensity and ENSO. J Clim 2005; 18:2996-3006; http://dx.doi.org/ 10.1175/JCLI3457.1 [DOI] [Google Scholar]
- 15.Fraza E, Elsner JB. A climatological study of the effect of sea-surface temperature on North Atlantic hurricane intensification. Phys Geogr 2015; 36(5):395-407; http://dx.doi.org/ 10.1080/02723646.2015.1066146 [DOI] [Google Scholar]
- 16.Kang NY, Elsner JB. Trade-off between intensity and frequency of global tropical cyclones. Nat Clim Chang 2015; 5(7):661-4; http://dx.doi.org/ 10.1038/nclimate2646 [DOI] [Google Scholar]
- 17.Kossin JP, Emanuel KA, Vecchi GA. The poleward migration of the location of tropical cyclone maximum intensity. Nature 2014; 509(7500):349-52; PMID:24828193; http://dx.doi.org/ 10.1038/nature13278 [DOI] [PubMed] [Google Scholar]
- 18.Elsner JB, Kossin JP, Jagger TH. The increasing intensity of the strongest tropical cyclones. Nature 2008; 455(7209):92-5; PMID:18769438; http://dx.doi.org/ 10.1038/nature07234 [DOI] [PubMed] [Google Scholar]
- 19.Knutson TR, McBride JL, Chan J, Emanuel K, Holland G, Landsea C, Held I, Kossin JP, Srivastava AK, Sugi M. Tropical cyclones and climate change.” Nature Geosci. 2010; 3(3):157-63; http://dx.doi.org/ 10.1038/ngeo779 [DOI] [Google Scholar]
- 20.Holland G, Bruyere CL. Recent intense hurricane response to global climate change. Clim Dyn. 2014; 42:617-27; http://dx.doi.org/ 10.1007/s00382-013-1713-0 [DOI] [Google Scholar]
- 21.Webster PJ, Holland GJ, Curry JA, Chang HR. Changes in tropical cyclone number and intensity in a warming environment. Science. 2005; 309:1844-6; PMID:16166514; http://dx.doi.org/ 10.1126/science.1116448. [DOI] [PubMed] [Google Scholar]
- 22.Klotzbach PJ, Landsea CW. Extremely intense hurricanes: Revisiting Webster et al. (2005) after 10 years. J Climate 2015; 28(19):7621-9; http://dx.doi.org/ 10.1175/JCLI-D-15-0188.1 [DOI] [Google Scholar]
- 23.Klotzbach P, Gray W, Fogarty C. Active Atlantic hurricane era at its end? Nature Geosci 2015; 8(10):737-8. http://dx.doi/ 10.1038/ngeo2529 [DOI] [Google Scholar]
- 24.Field CB, Barros V, Stocker TF, Qin D, Dokken DJ, Ebi KL, Mastrandrea MD, Mach KJ, Plattner G-K, Allen SK, Tignor M, Midgley PM (eds.). Managing the risks of extreme events and disasters to advance climate change adaptation: A special report of the Intergovernmental Panel on Climate Change (IPCC). Cambridge University Press: New York, NY; 2012. [Google Scholar]
- 25.Peduzzi P, Chatenoux B, Dao H, Herold C, Giuliani G. Preview global risk data platform. UNEP/GRID and UNISDR, Geneva, Switzerland, 2011. preview.grid.unep.ch/index.php?preview=tools&cat=1&lang=eng. [Google Scholar]