

ABSTRACT
We analyze a correlation between the GC content in genes of 12 eukaryotic species and the level of intrinsic disorder in their corresponding proteins. Comprehensive computational analysis has revealed that the disordered regions in eukaryotes are encoded by the GC-enriched gene regions and that this enrichment is correlated with the amount of disorder and is present across proteins and species characterized by varying amounts of disorder. The GC enrichment is a result of higher rate of amino acid coded by GC-rich codons in the disordered regions. Individual amino acids have the same GC-content profile between different species. Eukaryotic proteins with the disordered regions encoded by the GC-enriched gene segments carry out important biological functions including interactions with RNAs, DNAs, nucleotides, binding of calcium and metal ions, are involved in transcription, transport, cell division and certain signaling pathways, and are localized primarily in nucleus, cytosol and cytoplasm. We also investigate a possible relationship between GC content, intrinsic disorder and protein evolution. Analysis of a devised “age” of amino acids, their disorder-promoting capacity and the GC-enrichment of their codons suggests that the early amino acids are mostly disorder-promoting and their codons are GC-rich while most of late amino acids are mostly order-promoting.
KEYWORDS: disorder prediction, DNA-binding protein, GC content, protein evolution, RNA-binding protein
Introduction
Intrinsically disordered proteins (IDPs) do not require a unique 3-D structure as a whole or in part to be functional. IDPs and intrinsically disordered protein regions (IDPRs) form dynamic conformational ensembles1-4 with ensemble-averaged structural properties ranging from collapsed (molten globule-like), to partially collapsed (pre-molten globule-like) and even highly extended (coil-like) structures.5-7 IDPs and proteins with IDPRs are very common in many proteomes that were analyzed so far.8-11 Functionally important IDPs include transcription factors,12,13 some mitochondrial proteins,14 ribosomal proteins,15 and nuclear proteins,16,17 to name a few.
IDPs/IDPRs are noticeably different from structured (ordered) proteins and domains at multiple levels. For example, based on the simple comparative analysis of the composition of amino acids of IDPs/IDPRs and structured proteins/domains, the disordered proteins were shown to be enriched in disorder-promoting residues (such as Ala, Arg, Gly, Gln, Ser, Glu, Lys and Pro) and being relatively depleted in order-promoting amino acids (such as Trp, Tyr, Phe, Ile, Leu, Val, Cys, and Asn).7,18,19 These noticeable amino acid biases make IDPs/IDPRs predictable and a wide range of accurate computational tools for disorder prediction was developed.20-25
In spite of the fact that peculiarities of the amino acid sequences and various aspects of structural and functional properties of IDPs/IDPRs were addressed in numerous studies, an important question on how protein intrinsic disorder is encoded in the corresponding genes remains understudied. Below, we overview several studies that address some of the genetic aspects of protein intrinsic disorder. It was pointed out that some nucleotide biases in a gene can be potentially used to evaluate the abundance of intrinsic disorder in the corresponding proteins.26 In fact, higher GC values in genes allow for the increased propensity of Gly, Ala, Arg and Pro in proteins encoded by these genes, whereas proteins encoded by genes with lower GC values are expected to be enriched in Phe, Tyr, Met, Ile, Asn and Lys.27,28 As mentioned above, in relation to the protein intrinsic disorder phenomenon, Gly, Ala, Arg and Pro are considered as disorder-promoting residues, whereas Phe, Tyr, Ile, and Asn are enriched in ordered proteins. However, GC content was also shown to be related to some other important characteristics of organisms, such as their genome size, oxygen utility, and optimum growth temperature.27,29,30 Furthermore, GC content was shown to vary greatly between different genomic regions in many eukaryotes, with these variations reflecting selection, mutational bias and biased recombination-associated DNA repair.31 In agreement with some of these observations, a computational analysis of 296 prokaryotic completely sequenced genomes revealed that maximum disorder in bacterial proteins is observed for large genome size organisms with high GC contents, whereas in archaea, proteomes with higher disorder content are found in high GC content-small genome size organisms and in high GC content-facultative anaerobic or aquatic or mesophilic organisms.26 Relatively high GC contents were reported for the terminal regions of genes encoding members of the sirtuin family of proteins, which are found in eubacteria, archaea and eukaryotes and are characterized by noticeable amount of functional disorder in their N- and C-terminal regions.31 Analysis of proteins containing tandem repeats of amino acids (which often correspond to IDPRs32) revealed that some repeats of single amino acids correlate with the GC-richness of the corresponding regions of the genes.33 Finally, based on the comparative analysis of sex chromosome-coded and autosome-coded proteins in mammalian species and their corresponding genes it has been concluded that the autosomes have a stronger correlation between the GC content of the transcripts and the structural disorder of the coded proteins than the sex chromosomes.34 These authors also established that some small but statistically significant positive correlation exists between the GC content of the most human chromosomes and disorder content in the corresponding proteins, with the exception of chromosomes 21 and Y, where no statistically significant difference could be found between these 2 parameters.34
In this study, we report results of a systematic analysis of a correlation between the GC content in genes of 12 diverse eukaryotic species and the level of disorder in their corresponding proteins. We also compare the GC content in the gene regions encoding structured and disordered protein fragments and analyze relation between GC content and content of amino acids. The results of these analyses prompt us to characterize the molecular functions and subcellular locations of proteins that are encoded by GC content rich genes. Finally, we analyze potential links between the GC content of codons, disorder content of corresponding amino acids and protein evolution.
Materials and methods
Data set
We analyze GC content in 12 diverse eukaryotic species, see Table 1. Motivated by the high quality of annotations of protein-coding regions in the human and mouse genomes generated by the collaborative consensus coding sequence (CCDS) project,35 we collect the transcripts and their corresponding translated protein sequences from this resource. We map the resulting 29,064 human and 23,089 mouse proteins from CCDS into UniProt (ref. 36) using the RefSeq and/or Ensembl identifiers provided in CCDS. The mapping is needed to investigate functional annotations of these proteins. We collect complete proteomes from UniProt release 2013_11 (ref. 36) for the remaining 10 species. The 12 species were selected to provide a broad coverage of the key relevant characteristics, such as amount of intrinsic disorder, GC content and the proteome size. The proteomes include between 4050 and 30480 proteins with median size of 9300 proteins. The median disorder content of these proteomes ranges between low of 3.4% and high of 15.3%, and GC content ranges between low of 24.7% and high of 66.8%. We include 4 organisms characterized by relatively low disorder content up to 5%, 4 with medium disorder content between 5 and 10%, and 4 with high content of over 10%. This was done to ensure that sampling is adequate to quantify relation between disorder and GC content values. We use the subsection “sequence databases” in UniProt to map into and extract the corresponding transcripts from EMBL;37 we considered the feature key “CDS” in the EMBL's feature table. If a given transcript is composed of multiple gene segments, we consider the “join” and “complement” operators to join these gene segments together. The EMBL's feature table and operators are described in the ftp://ftp.ebi.ac.uk/pub/databases/embl/doc/FT_current.txt file. In case when we obtain multiple transcripts for a given protein from UniProt, we compute sequence similarity between each translated sequence and the sequence in the UniProt, and select the most similar translated sequence from EMBL.
Table 1.
Summary of the considered eukaryotic organisms. Taxonomy ID is the unique numerical identifier taken from the NCBI's taxonomy. Disorder content is defined as a fraction of disordered residues in protein sequences. GC content is the fraction of guanines (G) and cytosines (C) in a corresponding nucleotide sequence. We provide median, 30th centile, and 70th centile of content values over proteins in a given genome.
| Disorder content [%] |
GC content [%] |
|||||
|---|---|---|---|---|---|---|
| Species | Taxonomy ID | Number of proteins | median | [30, 70] centile range | median | [30, 70] centile range |
| Ichthyophthirius multifiliis | 857967 | 6789 | 3.4 | [1.5, 7.0] | 24.7 | [22.4,27.0] |
| Entamoeba dispar | 370354 | 7871 | 3.6 | [1.6, 8.3] | 28.3 | [26.4,30.2] |
| Nosema bombycis | 578461 | 4050 | 4.2 | [1.7, 9.7] | 29.9 | [28.0,32.1] |
| Trichoplax adhaerens | 10228 | 9628 | 5.0 | [2.3, 11.7] | 38.0 | [36.7,39.2] |
| Naegleria gruberi | 5762 | 14769 | 6.7 | [2.8, 15.7] | 34.8 | [33.5,36.1] |
| Giardia intestinalis | 5741 | 9235 | 6.8 | [3.0, 14.3] | 48.1 | [46.4,50.2] |
| Arabidopsis lyrata | 81972 | 30480 | 8.5 | [3.8, 19.1] | 44.3 | [42.8,46.0] |
| Aureococcus anophagefferens | 44056 | 7383 | 9.3 | [4.6, 17.2] | 71.7 | [68.8,74.2] |
| Mus musculus | 10090 | 23089 | 12.0 | [4.6, 25.8] | 52.3 | [48.3,56.0] |
| Homo sapiens | 9606 | 29064 | 13.8 | [6.0, 27.6] | 52.5 | [47.0,58.1] |
| Leishmania infantum | 5671 | 7909 | 15.2 | [7.5, 26.9] | 61.9 | [60.3,63.4] |
| Chlamydomonas reinhardtii | 3055 | 9420 | 15.3 | [7.7, 26.7] | 66.8 | [64.5,68.9] |
Quantification of intrinsic disorder
We apply 2 methods: IUPred38 and ESpritz,39 to annotate putative intrinsic disorder in the proteins from the 12 species. These methods were shown to provide good predictive quality23,38,40 and are their low runtime requirements allow for the multiple-genome-scale analysis. The two method predict different types of disordered regions and apply complementary annotations of disorder. We utilize 2 versions of IUPred that were designed for the predictions of long and short disordered segments. ESpritz has 3 versions that consider disorder annotations based on the X-ray crystal structures, nuclear magnetic resonance structures, and the experimental annotations from the DisProt database.41 We combine the resulting 5 predictions together using a majority vote-based consensus. This was motivated by an observation that consensus-based approaches provide improved predictive quality.42,43 We also note that the same consensus was applied in several similar studies.11,44-47 The putative disorder was used to calculate the disorder content (i.e., fraction of disordered residues in protein sequences) and to extract disordered regions and fully disordered/ordered proteins. Based on refs. 48, 49 we assume that the disordered regions include at least 4 consecutive disordered residues. Similarly, structured regions are also set to be at least 4 residues long. We define a protein as fully disordered (ordered) protein if it has at least 90% (at most 10%) of disordered residues and no ordered (disordered) regions. This definition was used to divide proteins in each organisms into 3 subsets: majority of proteins that include both ordered and disordered regions (DOProt), fully disordered proteins (DProt), and fully ordered proteins (OProt).
Quantification of GC content
We compute the GC content for transcripts from each of the considered 12 genomes. Moreover, to quantify relation between GC content and intrinsic disorder we calculate relative enrichment in GC content in the DOProt data set for each organism, which is defined as:
This value quantifies the amount of enrichment in the GC content in the disordered regions compare with the GC content in the ordered regions.
Functional annotation of proteins enriched in GC content in disordered regions
Using the Gene Ontology (GO)50 terms that are available in the UniProt, we annotate biological processes, molecular function and cellular components of the considered eukaryotic proteins. We extract a subset of these molecular-level annotations that are specific to the proteins that have enriched GC content in the disordered regions and also to proteins that have enriched GC content in the disordered regions and substantial amount of disorder, i.e., at least 50% more disorder than the average disorder content in a given species. The GC content enriched proteins are defined as proteins that have at least 20% relative enrichment of GC content in the disordered regions. First, we extracted a set of proteins (proteins with large disorder content) with GC-enriched disordered regions from given DOprot data sets, and the same number of proteins (proteins with large disorder content) with GC-depleted disordered regions. Next, we select at random half of the proteins from these 2 sets and repeated this selection 10 times. We compute a fraction of the proteins that have a given annotation in each repetition and each set. As a result, we obtain 2 vectors of 10 fractions for each annotation. We assume that a given annotation is specific to proteins with GC-enriched disordered regions if the corresponding fractions are significantly higher. If the corresponding vectors of fractions were normal, which we test using the Anderson-Darling test at the 0.05 significance, then we utilize t-test to measure significance; otherwise we use the non-parametric Wilcoxon rank sum test. We annotate the significance of the differences at the 0.05 and the 0.001 levels. We consider annotations that are observed for at least 10 proteins to assure that the values of fraction are statistically sound.
Results and discussion
Relation between GC content and content of intrinsic disorder
The GC content is defined as a fraction of G (guanine) and C (cytosine) in a given set of transcripts or fragments of transcript. The content of intrinsic disorder is defined as a fraction of disordered amino acids in a given set of protein sequences. We use putative annotation of disorder, as described in the Materials and Methods. Fig. 1 summarizes results of the correlation analysis between the mean GC content of genes and the mean putative intrinsic disorder content (PIDC) of the respective proteins aggregated per entire genome for the considered 12 eukaryotic organisms. The corresponding linear regression is:
Figure 1.
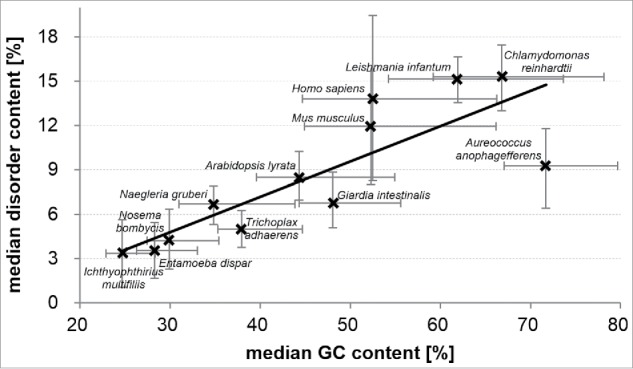
Correlation between the median GC contents in the 12 eukaryotic genomes and the median content of putative intrinsic disorder in the corresponding 12 proteomes. Error bars represent the 30th centile and 70th centile of the disorder content (vertical bars) and GC content (horizontal bars) over proteins/genes in a given proteome/genome.
This analysis show a strong correlation between the mean intrinsic disorder content in eukaryotic proteins and the mean GC contents of their corresponding transcripts at the genome level. The organisms that are biased toward larger GC content have more intrinsic disorder. We note that the considered organisms provide a wide coverage of the range of the disorder content values and the range of the GC content values, including low, medium and high values. This ensures robustness of our observation.
Relation between GC content and putative disorder content for individual organisms computed at the protein level is summarized in Fig. 2. This figure shows relation between average values of the disorder content for proteins binned into 6 equally sized groups and the GC content for the corresponding transcripts. The results are consistent with Fig. 1 and they demonstrate that the disorder content of proteins in each considered organism is correlated with the GC content. The corresponding R2 values are shown in the legend of the figure and they range between 0.49 and 0.99. We observe that these trends are consistent across all considered organisms, irrespective of their underlying range of their GC and disorder content values.
Figure 2.
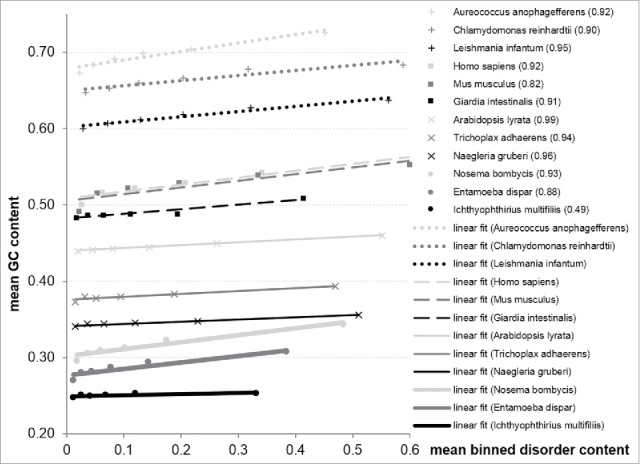
Relation between the GC content and disorder content for the 12 considered organisms. The disorder content values are binned into 6 equally sized intervals and the disorder and GC content values are computed as the corresponding averages over proteins/genes in each bin. We consider proteins that have both disordered and ordered regions. The lines show linear fit into these data and the corresponding R2 value between GC content and disorder content are shown in the figure legend.
We further analyze the GC and intrinsic disorder content values at a sub-protein level, by contrasting putative disordered and structured regions in the protein chains. Comparison of the GC content in the disordered regions relative to the GC content in the ordered regions indicates substantial and consistent enrichment in the disordered regions, see Fig. 3A. Median enrichment computed over the 12 organisms equals 7.2%. Eleven out of the 12 eukaryotic organisms show enrichment. Moreover, over 70% of disordered regions are enriched in GC content in these 11 organisms (30th centile is at or above the 0% relative enrichment line in Fig. 3A). We conclude that the GC content is enriched in the intrinsically disordered regions, irrespective of the overall amount of disorder in a given organism.
Figure 3.
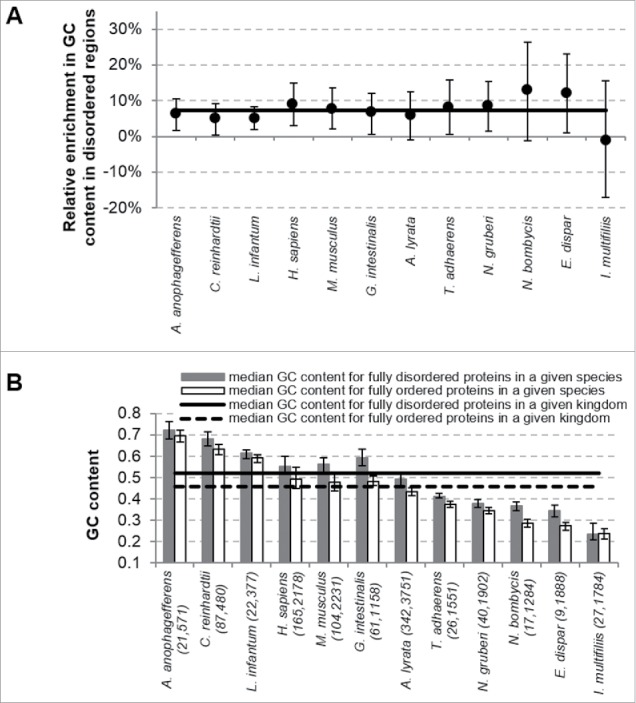
Comparison of the GC content between disordered and ordered proteins for the 12 eukaryotic organisms. Panel (A) shows relative enrichment in GC content (enrichment in the GC content in the disordered regions compare with the GC content in the ordered regions) in the DOProt set (proteins having both disordered and ordered regions). Black circles represent the median value of the relative enrichment and the error bars represent the 30th and 70th centiles. The solid line corresponds to the median value of the relative enrichment over the considered eukaryotic organisms. Panel (B) summarizes average GC content values for fully disordered (DProt data sets) and fully ordered (OProt data sets) proteins. The bars and error bars represent the median and 30 to 70% centiles of the GC content. The solid and dashed lines show the median GC content for fully disordered and fully ordered proteins across the 12 organisms. The species are listed on the x-axis; values in the brackets include the number of fully disordered proteins followed by the number of fully ordered proteins
We also investigate values of the GC content in the fully disordered (DProt data set) and in fully ordered (OProt data set) proteins, see Fig. 3B; we cannot compute the enrichment for these proteins since they have no ordered and no disordered regions, respectively. Our analysis reveals that fully disordered proteins have larger GC content when compared with the ordered proteins across 11 out of the 12 considered species. The overall increase across the 12 organisms, which corresponds to the difference between the solid and dashed horizontal lines in Fig. 3B, is relatively large and equals 6.5%.
Our analysis demonstrates that the enrichment of the GC content is associated with an increase in intrinsic disorder. Using a representative sample of eukaryotic organisms we empirically show that this relation is true at the whole genome, protein and sub-protein levels.
Relation between GC content and amino acid content
We investigate whether the correlation between GC and disorder content values is associated with differences in utilization of specific codons across eukaryotic species. To this end, we computed correlations between GC content and content of individual AAs, see Fig. 4. We observe that the Pearson correlation coefficient (PCC) values are consistent across the 12 eukaryotic species for all amino acids that are characterized by at least weak correlation with the GC content (average |PCC| > 0.2). In agreement with earlier studies,27,28 several amino acids including Alanine (A), Glycine (G), Proline (P), and Arginine (R) are positively correlated with the GC content, while Isoleucine (I), Asparagine (N), Phenylalanine (F), Lysine (K), and Tyrosine (Y) are negatively correlated. The high GC content is expected for A, G, P and R because the corresponding 16 codons are GC-enriched, i.e., GGX (for Glycine), CCX (for Proline), GCX (for Alanine) and CGX (for Arginine) patterns, where X is any of the 4 nucleotides.
Figure 4.
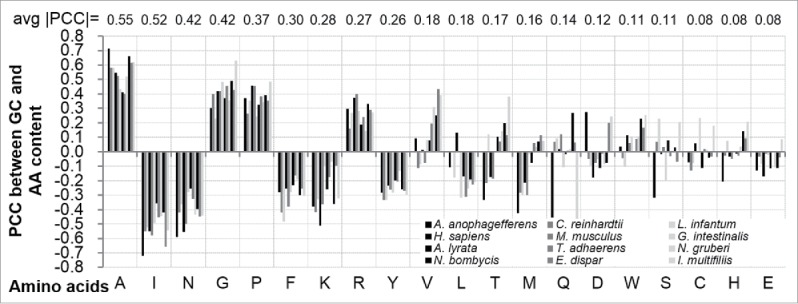
Pearson correlation coefficient (PCC) between GC content and content of individual AAs across the 12 organisms. The x-axis lists 1-letter encoded AAs sorted in descending order by their average (over the 12 species) absolute correlation with GC content; the average PCC values are shown at the top of the figure. Each bar corresponds to one color-coded organism.
This is a relevant finding since these correlations with the GC content are in agreement with the propensity of a given protein region to be intrinsically disordered. In particular, Glycine, Alanine, Arginine and Proline are considered as disorder-promoting residues, whereas Phenylalanine, Tyrosine, Isoleucine, and Asparagine are enriched in ordered proteins.7,18,19 Interestingly, several other amino acids, including E, S, K, Q, H, and D19 are also enriched in the disordered regions, and in spite of that we observe that the increase in GC content is associated with the increase in amount of the intrinsic disorder. This empirical result suggests that the enrichment in GC content in disordered regions in eukaryotes is due to inclusion of a larger number of GC-enriched amino acids in the disordered regions in eukaryotes, rather than due to differences in utilization of codons.
Functional analysis of GC-enriched disordered regions in eukaryotes
The enrichment in GC content in the disordered regions in eukaryotes may possibly have functional significance. Using GO annotations available in UniProt, we investigated whether proteins that have disordered regions enriched in GCs carry our specific molecular functions, are enriched in certain biological processes, and are found in specific subcellular locations (see Materials and Methods for details). We collected a sufficiently high number of GO annotation in H. sapiens and M. musculus, however were not able to secure enough data for the other species. Since the results for human and mouse are similar, we present results for H. sapiens. Moreover, we also analyze annotations that are aggregated across the 12 eukaryotes. Using proteins that have disordered regions, we compare the abundance of the functional and subcellular location annotations between proteins that are enriched (> 20% enrichment) vs. depleted in GC content to find annotations that are overrepresented in the GC content enriched proteins. We also repeat this analysis using proteins that have large amount of disorder (> 50% enrichment) to enumerate annotations that are overrepresented in the GC content and disorder enriched proteins. In total, we used 322, 976 and 465 human proteins and 434, 1469, 940 eukaryotic proteins to analyze abundance of biological processes, subcellular locations and molecular functions, respectively, across the proteins with disordered regions. The analysis of abundance for the proteins enriched in disorder is based on 20, 106, and 46 human proteins, and 96, 228, and 126 eukaryotic proteins with the annotations of biological processes, subcellular locations and molecular functions, respectively.
Annotations of biological processes, molecular function, and subcellular locations that are significantly enriched in proteins that are enriched in GC content in disordered regions (> 20% enrichment compare with the ordered regions) are given in Fig. 5A. The enrichment in annotations is shown using white horizontal bars for H. sapiens and black bars for the considered 12 eukaryotes. The red bars provides a point of reference, defined as an average fraction of annotations, to assess the magnitude of enrichment; i.e., black bars of the same length as the red bar denote enrichment by 100%. We observe that the enriched annotations are similar between the human and the aggregate over the 12 eukaryotes. This means that the functions and locations associated with the proteins enriched in GC content in the disordered regions are likely to be invariant between different eukaryotic organisms. The proteins enriched in GCs in disordered regions are involved in several binding events including interactions with RNAs, DNAs, nucleotides, calcium and metal ions, and ATP. They are involved in transcription, transport, cell division and certain signaling pathways. These functional roles agree with the functions previously associated with disordered proteins.11,18,51-56 Moreover, these proteins are localized primarily in nucleus, cytosol and cytoplasm, which is in agreement with their putative functional roles.
Figure 5.
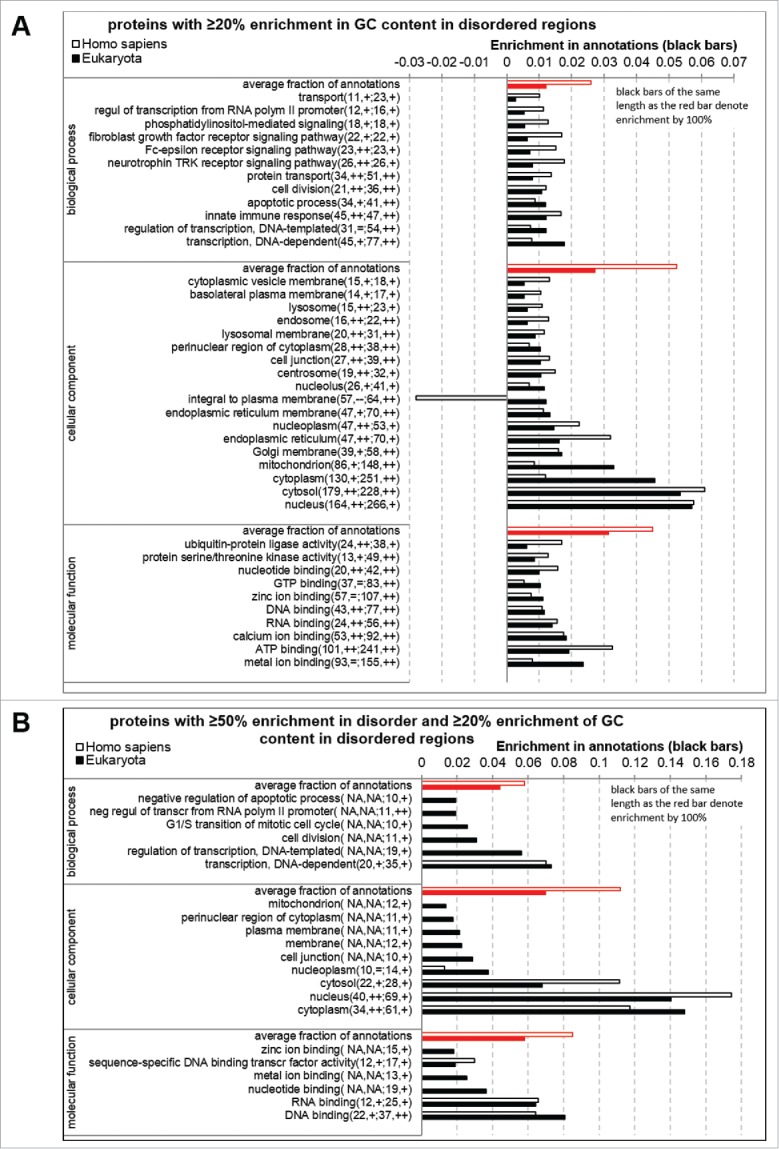
Biological processes, molecular function, and cellular components that are significantly enriched in proteins that (panel A) are enriched in GC content in disordered regions; (Panel B) that are enriched in GC content in disordered regions and have high amount of disorder. Proteins enriched in GC content are defined as chains that have at least 20% enrichment in GCs in the disordered regions when compare with the ordered regions. Proteins with substantial amount of disorder are defined as chains that have disorder content enriched by at least 50% compare with average disorder content in a given species. The enrichment in annotations is shown using horizontal bars: white bars for H. sapiens and black bars for all considered eukaryotes; red bars show a point of reference, which is the average fraction of annotations, to assess the magnitude of enrichment. The name of an annotation is followed by the number annotated proteins in human, significance of enrichment, the number annotated proteins in the eukaryotes, and the corresponding significance of enrichment. The significance is denoted with “+” and “++” that indicate that the P-value < 0.05 and < 0.001, respectively. “NA” denotes that less than 10 proteins were annotated and thus results were not computed.
Significantly enriched annotations for eukaryotic proteins that are enriched in GC content in disordered regions and that have substantial amount of disorder (> 50% more compare with average disorder content in a given species) are listed in Fig. 5B. These disordered proteins with GC-enriched disordered regions can be found in nucleus, cytosol and cytoplasm and are primarily involved in interactions with DNA, DNA, nucleotides, and metal and zinc ions. They are also enriched in transcription, cell division and apoptotic processes. Importantly, these protein functions and cellular localizations are a subset of the functions and locations that were previously associated with intrinsic disorder.2,11,18,51-56 Unfortunately the low number of the corresponding annotated proteins in human prevent us from providing a direct side-by-side comparison against the proteins from the considered eukaryotic organisms. However, Fig. 5B shows that the human proteins are enriched in the same of the same cellular components as the eukaryotic proteins, namely cytosol, nucleus and cytoplasm. They also share enrichment in several molecular functions including RNA and DNA binding.
Adding clues to understand evolution of protein intrinsic disorder
An interesting fact established in this study that the disordered regions of eukaryotic proteins are encoded by the GC-enriched gene segments adds an important twist to the understanding of the evolution of protein intrinsic disorder. This finding parallels the results of earlier computational studies on the abundance of intrinsic disorder at proteome level that systematically showed higher abundance of IDPs/IDPRs in eukaryotes relative to the less complex organisms8,9,11,57-61 Such compelling findings suggest that disorder, with its ability to be implemented in various signaling, recognition, and regulation pathways and networks, is important for the maintenance of life in eukaryotic and especially muticellular eukaryotic organisms.7,62-64 Based on these and other observations, one can assume that intrinsic disorder represents a relatively recent evolutionary invention.65 However, consideration of the early stages of evolution suggests that the chances for the first polypeptides which appeared in the primordial soup of the primitive Earth to possess well-developed and unique 3D structures are minimal. The Earth formed about 4.5 billion years ago. Scientists dated the first fossils to 3.85 billion years ago. There are debates and different theories about what happened in those years between the time the earth was cool enough to spawn life and the time the first fossils were formed. It has been hypothesized66,67 and letter experimentally shown.68,69 that some organic molecules can be spontaneously produced from the gases of the primitive Earth atmosphere assuming that this primitive atmosphere was reducing (as opposed to oxygen-rich), and there was an appropriate supply of energy, such as lightning or ultraviolet light. Although among organic compounds synthesized in such experiments from methane and the non-organic compounds believed to be the major components of the early Earth's atmosphere (water vapor, hydrogen, and ammonia) some amino acids were found, these Miller-Urey experiments yielded only about half of the modern amino acids,68,69 suggesting that the first proteins on Earth may have contained only a few amino acids.
These findings go in parallel with the biosynthetic theory of the genetic code evolution stating that the genetic code evolved from a simpler form that encoded fewer amino acids.70 It was also suggested that the subsequent evolution of the primary genetic code developed in the parallel with the invention of biosynthetic pathways for new and chemically more complex amino acids.71 Some support of the validity of this hypothesis can be found in the standard genetic code (that consists of 4 × 4 × 4 = 64 triplets of nucleotides, codons), which is known to be redundant (64 codons encodes for 20 amino acids). In fact, with only 2 exceptions, codons encoding one amino acid may differ in any of their 3 positions. However, only the third positions of some codons may be fourfold degenerate; i.e., any nucleotide at this position specifies the same amino acid and all nucleotide substitutions at this site are synonymous. Using these observations as a reflection of the evolutionary development, it was proposed that there was a period during code evolution where the third position was not needed at all and a doublet code preceded the triplet code, giving rise to 4 × 4 = 16 codons (encoding for 16 or fewer amino acids, if a termination codon is taken into account).72
Based on these and many other observations, hypotheses and models, evolutionarily old and new amino acids can be differentiated. Combination of the 40 different single-factor criteria into a consensus generated the following temporal order of appearance and subsequent addition of the amino acids: G/A, V/D, P, S, E/L, T, R, N, K, Q, I, C, H, F, M, Y, and W.73 Even superficial analysis of this sequence reveals that many of the early amino acids (such as G, D, E, P, and S) are disorder-promoting, as they are very abundant in modern intrinsically disordered proteins. On the other hand, it looks like the major order-promoting residues (C, W, Y, and F) were added to the genetic code late.65
Curiously, at the nucleic acid level, harsh conditions of the primitive Earth with its overall high temperatures would clearly support the GC-enriched nucleic acids since the nucleic acids with higher GC content are known to be more stable than the nucleic acids with lower GC content74 As we empirically demonstrate here, higher GC values in modern genes lead to the increased G, A, R, and P content in proteins encoded by these genes, whereas proteins encoded by genes with lower GC values are expected to be enriched in F, Y, M, I, N, and K.27,28 Therefore, these observations provide further support to the hypothesis that primitive GC-enriched genes with their limited set of early codons would code for mostly disordered proteins. This hypothesis is illustrated in Fig. 6 that shows modern genetic code in combination with information on the early and late codons (shown by light red and light blue colors respectively) and disorder- and order-promoting residues (shown by red and blue colors, respectively). This figure reveals that there is a relatively good agreement between the devised “age” of the residue, its disorder-promoting capacity and GC-enrichment of its codon, with early residues being mostly disorder-promoting, and with the majority of late residues being mostly order-promoting. This observation is visualized by the abundance of the matching colors (light red-red, light blue-blue and light pink-pink). There are only 2 noticeable exceptions from these rule, valine and leucine, which are early order-promoting residues.65
Figure 6.
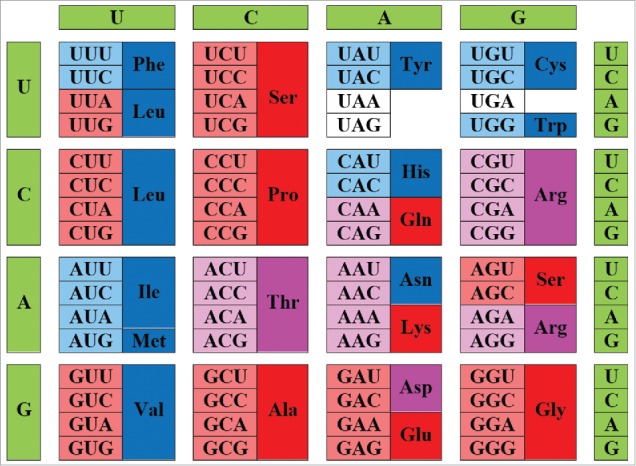
Peculiarities of disorder evolution. Modern genetic code with information on the early and late codons (shown by light red and light blue colors, respectively) and disorder- and order-promoting residues (shown by red and blue colors, respectively). Intermediate codons are shown by light pink color. Disorder-neutral residues are shown by pink color. Adapted from ref. 65.
Based on these data it was hypothesized that the primordial polypeptides were intrinsically disordered and did not possess catalytic activity.65,75 This hypothesis is in line with the RNA world theory suggesting that during the evolution of enzymatic activity, catalysis was transferred from RNA first to ribonucleoprotein (RNP) and only then to protein.76 Therefore, the first proteins in the primitive organisms are expected to be nonspecific RNA chaperones rather than highly elaborated and specialized catalysts.75,77 Obviously, carriers of such intrinsically disordered RNA chaperones possessed a significant selective advantage in the RNA world, where the misfolding-prone RNA78,79 was used for both information storage and catalysis.80 Since the variability of physico-chemical properties of amino acids greatly exceeds that of nucleotides and since protein structures are noticeably more stable than RNA structures, the transition from RNAs (ribozymes) to proteins as carriers of enzymatic activity was a logical evolutionary step.65 However, efficient catalysis relies on the proper spatial arrangement of catalytic residues which requires a stable structure.81 Therefore, grafting of the enzymatic activity to proteins generated strong evolutionary pressure favoring well-folded structures. In other words, the global evolution of intrinsic disorder is characterized by a specific pattern,65 where highly disordered primordial proteins with primarily RNA-chaperone activities were gradually substituted with the well-folded, highly ordered enzymes that evolved to catalyze the production of all the complex organic components vital for the independent existence of the first cellular organisms. At the later stages of evolution, due to its specific features crucial for the regulation of complex processes, protein intrinsic disorder was reinvented, leading to the eventual appearance of the highly elaborated eukaryotic cells.65
Conclusions
We show that GC content is clearly enriched in gene segments encoding the disordered regions of eukaryotic proteins when compare with the structured regions, irrespective of the overall amount of disorder in a given protein. We also show that in the disordered regions in eukaryotes, this GC enrichment results from the higher levels of amino acids encoded by the GC-rich codons, with individual amino acids possessing the very similar GC-content profiles across a diverse set of 12 eukaryotic organisms. Finally, we show that eukaryotic proteins characterized by IDPRs encoded by the GC-enriched gene regions carry out important molecular functions.
Our analysis also suggests a relationship between the devised “age” of amino acids, their propensity for intrinsic disorder and the GC content of their codons. We suggest that the early residues are biased toward being disorder-promoting and their codons are GC-rich. On the other hand, most of the late amino acids are mostly order-promoting. To paint a broader picture, we hypothesize that the evolution of intrinsic disorder is characterized by highly disordered primordial proteins that were gradually substituted with structured enzymes that are crucial for the first cellular organisms, with a more recent reinvention of the intrinsic disorder that lead to the development of elaborate eukaryotic cells. We believe that this work adds a significant piece of information needed to better understand the evolution of intrinsic disorder.
Disclosure of potential conflicts of interest
No potential conflicts of interest were disclosed.
Funding
This work was supported in part by the National Science Foundation (NSF) grant 1617369 to L.K., and the National Natural Science Foundation of China (Grant No. 11501407) and China National 863 High-Tech Program (2015AA020101) to Z.P.
References
- [1].Dunker AK, Lawson JD, Brown CJ, Williams RM, Romero P, Oh JS, Oldfield CJ, Campen AM, Ratliff CM, Hipps KW, et al.. Intrinsically disordered protein. J Mol Graph Model 2001; 19:26-59; PMID:11381529. [DOI] [PubMed] [Google Scholar]
- [2].Tompa P. Intrinsically unstructured proteins. Trends Biochem Sci 2002; 27:527-33; PMID:12368089. [DOI] [PubMed] [Google Scholar]
- [3].Daughdrill GW, Pielak GJ, Uversky VN, Cortese MS, Dunker AK. Natively disordered proteins. : Buchner J, Kiefhaber T, eds Handbook of Protein Folding. Weinheim, Germany: Wiley-VCH, Verlag GmbH & Co. KGaA, 2005:271-353. [Google Scholar]
- [4].Uversky VN. Introduction to intrinsically disordered proteins (IDPs). Chem Rev 2014; 114:6557-60; PMID:25004990. [DOI] [PubMed] [Google Scholar]
- [5].Dunker AK, Obradovic Z. The protein trinity–linking function and disorder. Nat Biotechnol 2001; 19:805-6; PMID:11533628. [DOI] [PubMed] [Google Scholar]
- [6].Uversky VN. Unusual biophysics of intrinsically disordered proteins. Biochim Biophys Acta 2013; 1834:932-51; PMID:23269364. [DOI] [PubMed] [Google Scholar]
- [7].Uversky VN, Dunker AK. Understanding protein non-folding. Biochim Biophys Acta 2010; 1804:1231-64; PMID:20117254. [DOI] [PMC free article] [PubMed] [Google Scholar]
- [8].Dunker AK, Obradovic Z, Romero P, Garner EC, Brown CJ. Intrinsic protein disorder in complete genomes. Genome Inform Ser Workshop Genome Inform 2000; 11:161-71; PMID:11700597. [PubMed] [Google Scholar]
- [9].Ward JJ, Sodhi JS, McGuffin LJ, Buxton BF, Jones DT. Prediction and functional analysis of native disorder in proteins from the three kingdoms of life. J Mol Biol 2004; 337:635-45; PMID:15019783. [DOI] [PubMed] [Google Scholar]
- [10].Xue B, Dunker AK, Uversky VN. Orderly order in protein intrinsic disorder distribution: disorder in 3500 proteomes from viruses and the three domains of life. J Biomol Struct Dyn 2012; 30:137-49; PMID:22702725. [DOI] [PubMed] [Google Scholar]
- [11].Peng Z, Yan J, Fan X, Mizianty MJ, Xue B, Wang K, Hu G, Uversky VN, Kurgan L. Exceptionally abundant exceptions: comprehensive characterization of intrinsic disorder in all domains of life. Cell Mol Life Sci 2015; 72:137-51; PMID:24939692. [DOI] [PMC free article] [PubMed] [Google Scholar]
- [12].Liu J, Perumal NB, Oldfield CJ, Su EW, Uversky VN, Dunker AK. Intrinsic disorder in transcription factors. Biochemistry 2006; 45:6873-88; PMID:16734424. [DOI] [PMC free article] [PubMed] [Google Scholar]
- [13].Minezaki Y, Homma K, Kinjo AR, Nishikawa K. Human transcription factors contain a high fraction of intrinsically disordered regions essential for transcriptional regulation. J Mol Biol 2006; 359:1137-49; PMID:16697407. [DOI] [PubMed] [Google Scholar]
- [14].Ito M, Tohsato Y, Sugisawa H, Kohara S, Fukuchi S, Nishikawa I, Nishikawa K. Intrinsically disordered proteins in human mitochondria. Genes to cells : devoted to molecular & cellular mechanisms 2012; 17:817-25. [DOI] [PubMed] [Google Scholar]
- [15].Peng Z, Oldfield CJ, Xue B, Mizianty MJ, Dunker AK, Kurgan L, Uversky VN. A creature with a hundred waggly tails: intrinsically disordered proteins in the ribosome. Cellular and molecular life sciences: CMLS 2013; 71:1477-1504; PMID:23942625; http://dx.doi.org/21866296 10.1007/s00018-013-1446-6 [DOI] [PMC free article] [PubMed] [Google Scholar]
- [16].Homma K, Fukuchi S, Nishikawa K, Sakamoto S, Sugawara H. Intrinsically disordered regions have specific functions in mitochondrial and nuclear proteins. Molecular bioSystems 2012; 8:247-55; PMID:21866296. [DOI] [PubMed] [Google Scholar]
- [17].Peng Z, Mizianty MJ, Xue B, Kurgan L, Uversky VN. More than just tails: intrinsic disorder in histone proteins. Mol Biosyst 2012; 8:1886-901; PMID:22543956. [DOI] [PubMed] [Google Scholar]
- [18].Radivojac P, Iakoucheva LM, Oldfield CJ, Obradovic Z, Uversky VN, Dunker AK. Intrinsic disorder and functional proteomics. Biophys J 2007; 92:1439-56; PMID:17158572. [DOI] [PMC free article] [PubMed] [Google Scholar]
- [19].Campen A, Williams RM, Brown CJ, Meng J, Uversky VN, Dunker AK. TOP-IDP-scale: a new amino acid scale measuring propensity for intrinsic disorder. Protein and peptide letters 2008; 15:956-63; PMID:18991772. [DOI] [PMC free article] [PubMed] [Google Scholar]
- [20].Ferron F, Longhi S, Canard B, Karlin D. A practical overview of protein disorder prediction methods. Proteins 2006; 65:1-14; PMID:16856179. [DOI] [PubMed] [Google Scholar]
- [21].Dosztanyi Z, Tompa P. Prediction of protein disorder. Methods in molecular biology 2008; 426:103-15; PMID:18542859. [DOI] [PubMed] [Google Scholar]
- [22].He B, Wang K, Liu Y, Xue B, Uversky VN, Dunker AK. Predicting intrinsic disorder in proteins: an overview. Cell Res 2009; 19:929-49; PMID:19597536. [DOI] [PubMed] [Google Scholar]
- [23].Peng ZL, Kurgan L. Comprehensive comparative assessment of in-silico predictors of disordered regions. Curr Protein Pept Sci 2012; 13:6-18; PMID:22044149. [DOI] [PubMed] [Google Scholar]
- [24].Monastyrskyy B, Kryshtafovych A, Moult J, Tramontano A, Fidelis K. Assessment of protein disorder region predictions in CASP10. Proteins 2014; 82 Suppl 2:127-37. [DOI] [PMC free article] [PubMed] [Google Scholar]
- [25].Deng X, Eickholt J, Cheng J. A comprehensive overview of computational protein disorder prediction methods. Mol Biosyst 2012; 8:114-21; PMID:21874190. [DOI] [PMC free article] [PubMed] [Google Scholar]
- [26].Pavlovic-Lazetic GM, Mitic NS, Kovacevic JJ, Obradovic Z, Malkov SN, Beljanski MV. Bioinformatics analysis of disordered proteins in prokaryotes. BMC bioinformatics 2011; 12:66; PMID:21366926. [DOI] [PMC free article] [PubMed] [Google Scholar]
- [27].Foerstner KU, von Mering C, Hooper SD, Bork P. Environments shape the nucleotide composition of genomes. EMBO reports 2005; 6:1208-13; PMID:16200051. [DOI] [PMC free article] [PubMed] [Google Scholar]
- [28].Singer GA, Hickey DA. Nucleotide bias causes a genomewide bias in the amino acid composition of proteins. Molecular biology and evolution 2000; 17:1581-8; PMID:11070046. [DOI] [PubMed] [Google Scholar]
- [29].Musto H, Naya H, Zavala A, Romero H, Alvarez-Valin F, Bernardi G. Correlations between genomic GC levels and optimal growth temperatures in prokaryotes. FEBS letters 2004; 573:73-7; PMID:15327978. [DOI] [PubMed] [Google Scholar]
- [30].Musto H, Naya H, Zavala A, Romero H, Alvarez-Valin F, Bernardi G. Genomic GC level, optimal growth temperature, and genome size in prokaryotes. Biochemical and biophysical research communications 2006; 347:1-3; PMID:16815305. [DOI] [PubMed] [Google Scholar]
- [31].Costantini S, Sharma A, Raucci R, Costantini M, Autiero I, Colonna G. Genealogy of an ancient protein family: the Sirtuins, a family of disordered members. BMC evolutionary biology 2013; 13:60; PMID:23497088. [DOI] [PMC free article] [PubMed] [Google Scholar]
- [32].Jorda J, Xue B, Uversky VN, Kajava AV. Protein tandem repeats - the more perfect, the less structured. FEBS J 2010; 277:2673-82; PMID:20553501. [DOI] [PMC free article] [PubMed] [Google Scholar]
- [33].Alba MM, Tompa P, Veitia RA. Amino acid repeats and the structure and evolution of proteins. Genome dynamics 2007; 3:119-30; PMID:18753788. [DOI] [PubMed] [Google Scholar]
- [34].Hegyi H, Tompa P. Increased structural disorder of proteins encoded on human sex chromosomes. Molecular bioSystems 2012; 8:229-36; PMID:22105808. [DOI] [PubMed] [Google Scholar]
- [35].Pruitt KD, Harrow J, Harte RA, Wallin C, Diekhans M, Maglott DR, Searle S, Farrell CM, Loveland JE, Ruef BJ, et al.. The consensus coding sequence (CCDS) project: Identifying a common protein-coding gene set for the human and mouse genomes. Genome Res 2009; 19:1316-23; PMID:19498102. [DOI] [PMC free article] [PubMed] [Google Scholar]
- [36].Consortium U. Reorganizing the protein space at the Universal Protein Resource (UniProt). Nucleic Acids Res 2012; 40:D71-D5; PMID:22102590. [DOI] [PMC free article] [PubMed] [Google Scholar]
- [37].Kanz C, Aldebert P, Althorpe N, Baker W, Baldwin A, Bates K, Browne P, van den Broek A, Castro M, Cochrane G, et al.. The EMBL Nucleotide Sequence Database. Nucleic Acids Res 2005; 33:D29-33; PMID:15608199. [DOI] [PMC free article] [PubMed] [Google Scholar]
- [38].Dosztanyi Z, Csizmok V, Tompa P, Simon I. The pairwise energy content estimated from amino acid composition discriminates between folded and intrinsically unstructured proteins. J Mol Biol 2005; 347:827-39; PMID:15769473. [DOI] [PubMed] [Google Scholar]
- [39].Walsh I, Martin AJ, Di Domenico T, Tosatto SC. ESpritz: accurate and fast prediction of protein disorder. Bioinformatics 2012; 28:503-9; PMID:22190692. [DOI] [PubMed] [Google Scholar]
- [40].Walsh I, Giollo M, Di Domenico T, Ferrari C, Zimmermann O, Tosatto SC. Comprehensive large-scale assessment of intrinsic protein disorder. Bioinformatics 2015; 31:201-8; PMID:25246432. [DOI] [PubMed] [Google Scholar]
- [41].Sickmeier M, Hamilton JA, LeGall T, Vacic V, Cortese MS, Tantos A, Szabo B, Tompa P, Chen J, Uversky VN, et al.. DisProt: the database of disordered proteins. Nucleic Acids Res 2007; 35:D786-93; PMID:17145717. [DOI] [PMC free article] [PubMed] [Google Scholar]
- [42].Peng Z, Kurgan L. On the complementarity of the consensus-based disorder prediction. Pac Symp Biocomput 2012;176-87; PMID:22174273. [PubMed] [Google Scholar]
- [43].Fan X, Kurgan L. Accurate prediction of disorder in protein chains with a comprehensive and empirically designed consensus. J Biomol Struct Dyn 2014; 32:448-64; PMID:23534882. [DOI] [PubMed] [Google Scholar]
- [44].Na I, Meng F, Kurgan L, Uversky VN. Autophagy-related intrinsically disordered proteins in intra-nuclear compartments. Mol Biosyst 2016; 12:2798-817; PMID:27377881. [DOI] [PubMed] [Google Scholar]
- [45].Meng F, Na I, Kurgan L, Uversky VN. Compartmentalization and Functionality of Nuclear Disorder: Intrinsic Disorder and Protein-Protein Interactions in Intra-Nuclear Compartments. Int J Mol Sci 2016; 17; E24; http://dx.doi.org/ 10.3390/ijms17010024 [DOI] [PMC free article] [PubMed] [Google Scholar]
- [46].Peng Z, Oldfield CJ, Xue B, Mizianty MJ, Dunker AK, Kurgan L, Uversky VN. A creature with a hundred waggly tails: intrinsically disordered proteins in the ribosome. Cell Mol Life Sci 2014; 71:1477-504; PMID:23942625. [DOI] [PMC free article] [PubMed] [Google Scholar]
- [47].Hu G, Wu Z, Wang K, Uversky VN, Kurgan L. Untapped potential of disordered proteins in current druggable human proteome. Current Drug Targets 2016; 17:1198-1205; PMID:2620148615738986 [DOI] [PubMed] [Google Scholar]
- [48].Noivirt-Brik O, Prilusky J, Sussman JL. Assessment of disorder predictions in CASP8. Proteins 2009; 77 Suppl 9:210-6. [DOI] [PubMed] [Google Scholar]
- [49].Monastyrskyy B, Fidelis K, Moult J, Tramontano A, Kryshtafovych A. Evaluation of disorder predictions in CASP9. Proteins 2011; 79 Suppl 10:107-18. [DOI] [PMC free article] [PubMed] [Google Scholar]
- [50].Ashburner M, Ball CA, Blake JA, Botstein D, Butler H, Cherry JM, Davis AP, Dolinski K, Dwight SS, Eppig JT, et al.. Gene ontology: tool for the unification of biology. The Gene Ontology Consortium. Nat Genet 2000; 25:25-9. [DOI] [PMC free article] [PubMed] [Google Scholar]
- [51].Dyson HJ, Wright PE. Intrinsically unstructured proteins and their functions. Nat Rev Mol Cell Biol 2005; 6:197-208; PMID:15738986. [DOI] [PubMed] [Google Scholar]
- [52].Wright PE, Dyson HJ. Intrinsically unstructured proteins: re-assessing the protein structure-function paradigm. J Mol Biol 1999; 293:321-31; PMID:10550212. [DOI] [PubMed] [Google Scholar]
- [53].Tompa P. The interplay between structure and function in intrinsically unstructured proteins. FEBS letters 2005; 579:3346-54; PMID:15943980. [DOI] [PubMed] [Google Scholar]
- [54].Vucetic S, Xie H, Iakoucheva LM, Oldfield CJ, Dunker AK, Obradovic Z, Uversky VN. Functional anthology of intrinsic disorder. 2. Cellular components, domains, technical terms, developmental processes, and coding sequence diversities correlated with long disordered regions. J Proteome Res 2007; 6:1899-916; PMID:17391015. [DOI] [PMC free article] [PubMed] [Google Scholar]
- [55].Xie H, Vucetic S, Iakoucheva LM, Oldfield CJ, Dunker AK, Obradovic Z, Uversky VN. Functional anthology of intrinsic disorder. 3. Ligands, post-translational modifications, and diseases associated with intrinsically disordered proteins. J Proteome Res 2007; 6:1917-32; PMID:17391016. [DOI] [PMC free article] [PubMed] [Google Scholar]
- [56].Xie H, Vucetic S, Iakoucheva LM, Oldfield CJ, Dunker AK, Uversky VN, Obradovic Z. Functional anthology of intrinsic disorder. 1. Biological processes and functions of proteins with long disordered regions. J Proteome Res 2007; 6:1882-98; PMID:17391014. [DOI] [PMC free article] [PubMed] [Google Scholar]
- [57].Feng ZP, Zhang X, Han P, Arora N, Anders RF, Norton RS. Abundance of intrinsically unstructured proteins in P. falciparum and other apicomplexan parasite proteomes. Mol Biochem Parasitol 2006; 150:256-67; PMID:17010454. [DOI] [PubMed] [Google Scholar]
- [58].Tompa P, Dosztanyi Z, Simon I. Prevalent structural disorder in E. coli and S. cerevisiae proteomes. J Proteome Res 2006; 5:1996-2000; PMID:16889422. [DOI] [PubMed] [Google Scholar]
- [59].Galea CA, High AA, Obenauer JC, Mishra A, Park CG, Punta M, Schlessinger A, Ma J, Rost B, Slaughter CA, et al.. Large-scale analysis of thermostable, mammalian proteins provides insights into the intrinsically disordered proteome. J Proteome Res 2009; 8:211-26; PMID:19067583. [DOI] [PMC free article] [PubMed] [Google Scholar]
- [60].Xue B, Williams RW, Oldfield CJ, Dunker AK, Uversky VN. Archaic chaos: intrinsically disordered proteins in Archaea. BMC Syst Biol 2010; 4 Suppl 1:S1. [DOI] [PMC free article] [PubMed] [Google Scholar]
- [61].Burra PV, Kalmar L, Tompa P. Reduction in structural disorder and functional complexity in the thermal adaptation of prokaryotes. PLoS One 2010; 5:e12069; PMID:20711457. [DOI] [PMC free article] [PubMed] [Google Scholar]
- [62].Dunker AK, Cortese MS, Romero P, Iakoucheva LM, Uversky VN. Flexible nets. The roles of intrinsic disorder in protein interaction networks. FEBS J 2005; 272:5129-48; PMID:16218947. [DOI] [PubMed] [Google Scholar]
- [63].Uversky VN, Oldfield CJ, Dunker AK. Showing your ID: intrinsic disorder as an ID for recognition, regulation and cell signaling. J Mol Recognit 2005; 18:343-84; PMID:16094605. [DOI] [PubMed] [Google Scholar]
- [64].Uversky VN. The mysterious unfoldome: structureless, underappreciated, yet vital part of any given proteome. J Biomed Biotechnol 2010; 2010:568068; PMID:20011072. [DOI] [PMC free article] [PubMed] [Google Scholar]
- [65].Uversky VN. A decade and a half of protein intrinsic disorder: biology still waits for physics. Protein Sci 2013; 22:693-724; PMID:23553817. [DOI] [PMC free article] [PubMed] [Google Scholar]
- [66].Oparin AI. The Origin of Life (in Russian). Moscow: Moscow Worker publisher, 1924. . [Google Scholar]
- [67].Haldane JBS. The origin of life. : Watts CA, ed. The Rationalist Annual for the Year 1929. London: Watts & Co, 1929:3-10. [Google Scholar]
- [68].Miller SL. A production of amino acids under possible primitive earth conditions. Science 1953; 117:528-9; PMID:13056598. [DOI] [PubMed] [Google Scholar]
- [69].Miller SL, Urey HC. Organic compound synthesis on the primitive earth. Science 1959; 130:245-51; PMID:13668555. [DOI] [PubMed] [Google Scholar]
- [70].Crick FH. The origin of the genetic code. J Mol Biol 1968; 38:367-79; PMID:4887876. [DOI] [PubMed] [Google Scholar]
- [71].Wong JT. A co-evolution theory of the genetic code. Proc Natl Acad Sci U S A 1975; 72:1909-12; PMID:1057181. [DOI] [PMC free article] [PubMed] [Google Scholar]
- [72].Jukes TH. Possibilities for the evolution of the genetic code from a preceding form. Nature 1973; 246:22-6; PMID:4585842. [DOI] [PubMed] [Google Scholar]
- [73].Trifonov EN. Consensus temporal order of amino acids and evolution of the triplet code. Gene 2000; 261:139-51; PMID:11164045. [DOI] [PubMed] [Google Scholar]
- [74].Yakovchuk P, Protozanova E, Frank-Kamenetskii MD. Base-stacking and base-pairing contributions into thermal stability of the DNA double helix. Nucleic Acids Res 2006; 34:564-74; PMID:16449200. [DOI] [PMC free article] [PubMed] [Google Scholar]
- [75].Poole AM, Jeffares DC, Penny D. The path from the RNA world. J Mol Evol 1998; 46:1-17; PMID:9419221. [DOI] [PubMed] [Google Scholar]
- [76].Jeffares DC, Poole AM, Penny D. Relics from the RNA world. J Mol Evol 1998; 46:18-36; PMID:9419222. [DOI] [PubMed] [Google Scholar]
- [77].Tompa P, Csermely P. The role of structural disorder in the function of RNA and protein chaperones. Faseb J 2004; 18:1169-75; PMID:15284216. [DOI] [PubMed] [Google Scholar]
- [78].Treiber DK, Williamson JR. Beyond kinetic traps in RNA folding. Curr Opin Struct Biol 2001; 11:309-14; PMID:11406379; http://dx.doi.org/ 10.1016/S0959-440X(00)00206-2 [DOI] [PubMed] [Google Scholar]
- [79].Cristofari G, Darlix JL. The ubiquitous nature of RNA chaperone proteins. Prog Nucleic Acid Res Mol Biol 2002; 72:223-68; PMID:12206453; http://dx.doi.org/ 10.1016/S0079-6603(02)72071-0 [DOI] [PubMed] [Google Scholar]
- [80].Gilbert W. Origin of life - the RNA world. Nature 1986; 319:618; http://dx.doi.org/ 10.1038/319618a0 [DOI] [Google Scholar]
- [81].Proteins Csermely P., RNAs and chaperones in enzyme evolution: A folding perspective. Trends Biochem Sci 1997; 22:147-9; PMID:9175467; http://dx.doi.org/ 10.1016/S0968-0004(97)01026-8 [DOI] [PubMed] [Google Scholar]