

Abstract
Falls from mobile equipment are reported at surface mine quarry operations each year in considerable numbers. Research shows that a preponderance of falls occur while getting on/off mobile equipment. Contributing factors to the risk of falls include the usage of ladders, exiting onto a slippery surface, and foot or hand slippage. Balance issues may also contribute to fall risks for mobile equipment operators who are exposed to whole-body vibration (WBV). For this reason, the National Institute for Occupational Safety and Health, Office of Mine Safety and Health Research conducted a study at four participating mine sites with seven haul truck operators. The purpose was to ascertain whether WBV and hand-arm vibration (HAV) exposures for quarry haul truck operators were linked to short-term decreases in performance in relation to postural stability, touch sensation threshold, and grip strength that are of crucial importance when getting on/off the trucks. WBV measures of frequency-weighted RMS accelerations (wRMS) and vibration dose value (VDV), when compared to the ISO/ANSI standards, were mostly below levels identified for the Health Guidance Caution Zone (HGCZ), although there were instances where the levels were within and above the specified Exposure Action Value. Comparably, all mean HAV levels, when compared to the ISO/ANSI standards, were below the HGCZ. For the existing conditions and equipment, no significant correlation could be identified between the WBV, HAV, postural stability, touch sensation threshold, and grip strength measures taken during this study.
Keywords: Mining, Haul trucks, Whole-body/hand-arm vibration, Ingress/egress, Postural stability, Grip strength
1. Introduction
A significant number of falls from mobile equipment are reported at surface mines each year. Mobile equipment operators may fall when performing a variety of activities including mounting and dismounting their equipment, routine or emergency maintenance and repair tasks, or cleaning tasks on their equipment (Moore et al., 2009; Shibuya et al., 2010). Research has shown the majority of falls to occur while egressing from mobile equipment (Moore et al., 2009; Lin and Cohen, 1997). Several factors have been identified which may contribute to this fall risk. The usage of ladders, exiting onto a slippery surface, and foot or hand slippage are likely contributors (Moore et al., 2009). Balance disturbances may also contribute to fall risks in mobile equipment operators, with exposures to whole-body vibration (WBV) contributing to these disturbances (Ahuja et al., 2005; Gauchard et al., 2001; Oullier et al., 2009; Santos et al., 2010).
Mobile equipment operators are typically exposed to WBV and HAV due to the movement of their vehicles over rough ground conditions. WBV is transmitted through the frame of the truck to the operator through the operator's seat. Operators are exposed to HAV through both the steering column and the gear shift lever which transmit vibration from the engine as well as from the movement of the equipment. Both types of vibration contribute to fatigue and can have detrimental effects on health and job performance (Goglia et al., 2003). The effects of WBV exposure on postural stability have been examined in laboratory studies, and results show inconsistent effects on balance (Cornelius et al., 1994; Mannin and Ekblom, 1984; Santos et al., 2008a). Cornelius et al. (1994) exposed six male participants to uniaxial (vertical) WBV levels which were simulated to represent values measured from an underground mining shuttle car. The researchers were unable to find any statistically significant changes in balance measures following vibration exposure and argued that the relationship between WBV and postural stability may depend on both frequency and duration. Mannin and Ekblom (1984) exposed ten male participants to noise, vibration, or a combination of both. Results showed an increase in body sway when exposed to noise alone, vibration alone, and a combination of noise and vibration. Santos et al. (2008a) exposed twelve male participants to 60 min of vertical random WBV or no vibration. No statistically significant changes were found in many of the 36 center of pressure (COP) movements examined following WBV exposure. One measure, the median frequency of the COP movement in the anterior-posterior direction, was shown to decrease following vibration exposure.
Limited research is available showing the detrimental effects of real-life vibration exposures on balance (Oullier et al., 2009; Ahuja et al., 2005; Martin et al., 1980). Oullier et al. (2009) studied a group of 12 apprentice bulldozer operators and 12 non-operator participants. Results showed no change in performance for the non-operator participants and a significant change for the operators. There was a destabilizing effect found after being exposed to bulldozer vibration which was evident during upright stance and when transferring from bipedal to unipedal stance. The sensorimotor treatment was found to be effective at re-stabilization. Ahuja et al. (2005) studied nine long haul freight drivers. Results showed a significant change in antero-posterior and medio-lateral sway in the “eyes open” condition after the 2.5-hour driving exposure. The authors concluded that postural stability may be impacted by WBV exposure similar to those experienced by long haul freight drivers. Martin et al. (1980) focused on quantifying the balance changes due to long-term helicopter vibration exposure and to determine the source of these changes. The researchers exposed ten participants to 30 min of seated vibration exposure. The authors reported vibration exposure to the body and legs to have a negative effect on postural control.
The effect of WBV exposure on postural stability has been variable across studies. Postural stability, however, is but one measure which likely contributes to fall risk when egressing from mobile mining equipment. Many of the ingress/egress systems on mobile equipment in mining feature vertical ladders. These ladders would require the use of the feet as well as the hands to safely egress from the equipment. The hands must constantly exert force to prevent falling from a ladder and these hand forces vary widely when descending a ladder (Armstrong et al., 2009; Young et al., 2011). As such, the ability to create and maintain hand forces are vital to safely ingressing and egressing from mobile mining equipment. Similarly to postural stability, the performance of the hands may also be affected by vibration exposure due to operating mobile mining equipment. Long-term exposure to HAV has been shown to result in vascular, neurological, and osteoarticular symptoms such as white fingers, cold intolerance, numbness, stiff fingers, decreased touch sensation, and decreased grip strength (Bernard et al., 1998; Bovenzi, 1998; Cenderlund et al., 2001; Ho and Yu, 1986; Widia and Md Dawal, 2010). Hand-Arm Vibration Syndrome (HAVS) is a name given to a host of vascular symptoms brought on by high-level exposure to HAV, typically from handheld vibrating tools. These symptoms include a vascular component typically evident by vibration-induced white finger, a neurological component typically evident by sensory impairment, and an osteoarticular component which includes bone and joint degeneration (Bovenzi, 1998).
Widia and Md Dawal (2010) measured muscle activation at the arm and shoulder as well as grip strength before and after seven participants used electric and bench drills to drill through wood for 5- and 15-minute periods. Results showed a decrease in grip strength for all trials, with greater reductions in grip strength associated with higher vibration levels and longer exposure durations. Ho and Yu (1986) examined the effect of HAV exposure on the median and ulnar nerves and found a significant dose/effect correlation between duration of exposure and nerve conduction velocity. Longer exposures times were associated with reduced nerve conduction velocities. A reduction in median or ulnar nerve conduction velocities would decrease a person's ability to detect touch, known as touch sensation threshold, and also decrease their grip strength (Metter et al., 1998).
Touch sensation threshold and grip strength show decreases with age and with the decline of motor nerve function (Metter et al., 1998). In the elderly, touch sensation thresholds are significantly reduced and thought to be caused by the decreased density and distribution of mechano-receptor fibers in the skin and an overall decrease in the number of nerve fibers (Thornbury and Mistretta, 1981; Bruce, 1980). Similar changes are also common to HAVS. Changes in finger touch sensation threshold are found among dentists and dental technicians who commonly use tools with vibration levels exceeding 1000 Hz (Lundström and Lindmark, 1982). The reduction in grip strength associated with HAV exposure has been well documented in short-term studies where participants use vibrating hand tools as well as from epidemiological studies of more long-term effects (Widia and Md Dawal, 2010; Widia and Md Dawal, 2011; Gaidhane and Patil, 2012; Nyantumbua et al., 2007). Vibration dose, the product of vibration level and exposure time, is a critical factor for developing HAVS and a strong relationship has been shown between the severity of HAVS and the exposure time (Bernard et al., 1998; Bovenzi, 1998). There is a clear association between HAV and the reduction of hand performance evident by decreased grip strength and reduced tactile sensitivity.
Previous research has examined the effects of whole-body vibration on balance and also the effects of hand-arm vibration on grip strength. No study has examined the short-term effects of whole-body and hand-arm vibration on haul truck operators over the course of their typical workday while measuring their vibration exposure. The aim of this research was to determine the acute, time-sensitive effects of surface mining haul truck vibration exposure on balance, grip strength, and touch sensation threshold of haul truck operators over the course of two workdays. HAV and WBV exposures were measured for the duration of the shift, and relevant balance, grip strength, and touch sensation threshold measurements were taken pre-, mid-, and post-shift.
2. Materials and methods
Four mine sites participated in this study resulting in seven male participants. The mine and participant demographics and shift durations are provided in Table 1. Data collection occurred over two days due to the need to conduct measurements soon after vibration exposure had ended. As such, grip strength and touch sensation threshold testing occurred on one day, while balance testing occurred on a different day. The order of these testing days was randomized. WBV and HAV exposures were measured each day. All subjects read and signed an informed consent form approved by the NIOSH Institutional Review Board.
Table 1.
Demographics of study participants and the haul trucks they operated during the study.
| Commodity | Haul truck (Make – model) |
Year of mfr. | Payload class (Tons) | No. of operating hrs. | Participant | Age (years) |
HT exp. (years) | Shift duration (hours) |
|---|---|---|---|---|---|---|---|---|
| Limestone | CAT–777D | 1996 | 100 | 51,476 | 1 | 56 | 0.25 | 10 |
| Sandstone | CAT–773D | 1997 | 50 | 18,821 | 2 | 57 | 4 | 8 |
| Limestone | CAT–773D | 1997 | 50 | 28,208 | 3 | 39 | 3.5 | 8 |
| Limestone | CAT–777D | 1997 | 100 | 52,676 | 4 | 25 | 0.25 | 10 |
| Limestone | CAT–777D | 2005 | 100 | 21,403 | 5 | 54 | 22 | 10 |
| Copper | Liebherr–T282B | 2010 | 400 | 4,969 | 6 | 56 | 17.5 | 8 |
| Copper | Liebherr–T282B | 2007 | 400 | 21,791 | 7 | 52 | 6.5 | 8 |
2.1. Touch sensation threshold and grip strength
Touch sensation threshold and grip strength were measured in the cab of the haul truck at pre-shift (before driving the truck from a parked position), at mid-shift (before leaving the truck for their lunch break after approximately half of the shift duration) and post-shift (before leaving the truck for the workday). Touch sensation threshold was measured first using the Touch-Test™ 20 Piece Full Kit (North Coast Medical, Inc., Gilroy, CA USA) sensory evaluators. The hand is innervated by the median and ulnar nerves which may be disproportionately affected by vibration exposure. The second (index finger) and fifth (pinky finger) distal phalanges of the dominant hand were selected as the areas of interest for touch sensation threshold to evaluate both the median and ulnar nerves, respectively. Drivers were given an overview of the test procedure and asked to wear a pair of blackout glasses which prevented them from seeing anything. They were then asked to sit with the forearm of their dominant hand on their leg and hold their hand in a supine position with their fingers extended instructed to inform the researchers as soon as they felt a fiber touching them and to indicate which finger was being touched. The order of finger testing was randomized a priori. The test administrator began by touching the smallest fiber (Evaluator size 1.65) to the finger at a 90° angle until the fiber bent and was held in place for one second, then removed. The Evaluator size was increased until the driver reported feeling the fiber on the correct finger. The test administrator then administered a different fiber which was three evaluator sizes higher than the correctly identified fiber. The fiber was then decreased in size by one evaluator thickness at a time until the driver no longer reported feeling the fiber. A touch sensation threshold value for each test was determined by averaging the first fiber identified and the last fiber identified. This was repeated three times for each finger.
Grip strength was measured immediately following the touch sensation threshold measurements. The dominant arm of the driver was first positioned such that the shoulders were adducted in neutral position, arms unsupported, elbows flexed at 90°, forearm rotation neutral, and wrist extended 0–30° with 0–15° ulnar deviation. Once in the correct test posture, the driver was provided a hand dynamometer and instructed to “squeeze the unit as hard as possible without hurting yourself or changing your body position for five seconds.” A researcher instructed the driver when to stop squeezing. A total of three trials were conducted and the driver was allowed to rest for one minute between trials. The average and maximum grip strengths were recorded for each trial.
2.2. Balance
As with touch sensation threshold and grip strength measures, balance measures were also taken pre-, mid-, and post-shift. Balance was measured by tracking the motion of the driver's center of pressure. Due to space limitations on the decks of the haul trucks, it was not possible to collect balance data while the driver was still on the truck. Instead, all drivers had to climb down a vertical ladder and walk less than 30 feet into a shop area for testing. Each driver was asked to step onto a force plate (Accusway Plus, AMTI, Watertown, MA, USA) such that the medial sides of his feet and his heels were touching a T-shaped separator (Fig. 1). This separator was used to ensure consistent placement of the feet across all trials (Santos et al., 2008b). The driver was then instructed to stand quietly with his arms at his side and eyes closed for sixty seconds. The separator was removed, and data collection was initiated. At the end of the trial, the driver was asked to step off of the force plate then back on. This protocol was repeated for a total of seven trials.
Fig. 1.
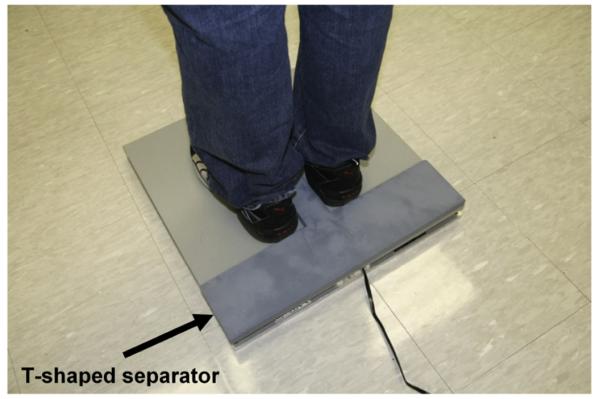
Force plate showing placement of the feet with the separator in place. Once the driver's feet were in the ideal location, the separator was removed and COP motion was recorded.
The COP data were exported from the data collection software into data analysis software (MATLAB®, Mathworks, Natick, MA, USA) for preparation and analysis. First, the data were filtered using a second-order zero-phase Butterworth low-pass filter with a cutoff frequency of 10 Hz. COP data were then analyzed using a custom-written code to calculate the balance measures of interest as identified by Prieto et al. (1996). Mean velocity has been found to be reliable and sensitive to changes in balance performance (Mani et al., 2010). As such, mean velocity in the medial/lateral and anterior/posterior directions were calculated along with sway area.
2.3. WBV and HAV
WBV was measured by two tri-axial accelerometers (models 356B18 and 356B40, PCB Piezoelectronics, Depew, NY USA) mounted on the floor of the driver's cab and the seat pan of the truck. HAV was measured by miniature tri-axial accelerometers (model 356A32, PCB Piezoelectronics, Depew, NY USA) installed on a spoke of the steering wheel near the hand location and the gearshift lever just below the hand position. Measurements of WBV were made and analyzed according to ISO 2631-1/ANSI S3.18 (ISO, 1997; ANSI, 2002) standards for the evaluation of human exposure to WBV for the orthogonal axes (x (fore-aft), y (side-to-side), and z (vertical)) directions using the metrics of frequency-weighted RMS accelerations (wRMS) and vibration dose values (VDV).
Similarly to the WBV measurements, HAV data were collected and analyzed in accordance with ISO 5349/ANSI S2.70 standards (ISO 5349-1 and -2:2001: ANSI S2.70:2006) for the measurement and evaluation of human exposure to vibration transmitted to the hand. HAV exposures were recorded for 3 directions but computed into the vector sum or wRMSTotal value as assessed for the first half of the day (pre-to mid-shift) and the second half of the day (mid-to post-shift).
HAV and WBV data were collected for the duration of the shift and acquired through a data recorder (SCADAS™ five-slot, 16-channel data recorder with, Lifecycle Management Software (LMS), Inc. a Siemens Business, Troy, MI, USA). Raw data were imported from the flash/memory card used in the SCADAS™ recorder into LMS Test Lab software (Lifecycle Management Software, Inc. a Siemens Business, Troy, MI, USA) where it was exported in the required format for further analysis using a custom-written script (MATLAB®, Mathworks, Natick, MA, USA). WBV data were transformed into levels of wRMS and VDVs for each orthogonal axis of the different haul trucks. HAV data were transformed into levels of wRMS for each orthogonal axis (x, y, z) from which the vector sum or wRMSTotal value was computed for the different haul trucks.
2.4. Statistical analysis
Repeated measures ANOVA was conducted to determine if there were statistically significant changes in balance, touch sensation threshold, and grip strength following WBV and HAV exposures due to operating a haul truck. Mauchly's test for sphericity was conducted for all analyses. When the assumption of sphericity was violated, a correction was applied. A Greenhouse-Geisser correction was used when the estimate of sphericity was less than 0.75. An alpha level of 0.05 was used for all analyses.
3. Results
Touch sensation threshold measurements at pre-, mid-, and post-shift are shown in Fig. 2 for both the index and pinky fingers. This figure includes clinical reference points for the threshold measurements indicating normal, diminished light touch, and diminished protective sensation ranges. Most participants started and remained in diminished light touch for all measurement times. One participant showed diminished protective sensation in both fingers and another participant only showed diminished protective sensation in his pinky finger post-vibration exposure. For the index finger, Mauchly's test for sphericity showed that the assumption of sphericity was not violated, χ2(2) = 5.128, p = 0.077. There was no significant effect of vibration exposure over time on the touch sensation threshold for the index finger, p = 0.106. Likewise, for the pinky finger, the assumption of sphericity was not violated (χ2(2) = 3.314, p = 0.191) and there was no significant effect of vibration exposure over time on the touch sensation threshold, p = 0.312. The average and maximum grip strengths at pre-, mid-, and post-shift are shown in Fig. 3. All participants showed average grip strengths that were less than what would have been expected for their age and gender (Massy-Westropp et al., 2011). Mauchly's test for sphericity showed that the assumption of sphericity was not violated for the maximum grip strength, χ2(2) = 2.977, p = 0.226. There was no significant effect of vibration exposure over time on the maximum grip strength, p = 0.768. Likewise, Mauchly's test also showed that the assumption of sphericity was not violated for the average grip strength, χ2(2) = 1.963, p = 0.375. Again, there was no significant effect of vibration exposure over time on the average grip strength, p = 0.718.
Fig. 2.

Touch sensation threshold from pre-shift (Pre), mid-shift (Mid), and post-shift (Post) measurements for all participants. Threshold regions associated with normal, diminished light touch, and diminished protective sensations are shown.
Fig. 3.

Average and maximum grip strengths from pre-shift (Pre), mid-shift (Mid), and post-shift (Post) measurements for each participant.
The mean WBV and HAV vibration exposures of the drivers were expressed as frequency-weighted RMS and VDV. These data are presented in Table 2 along with the changes in grip strength and touch sensation threshold between the measurement times. Mean wRMSTotal are given for the steering wheel and gearshift selector during the sampling intervals designated as pre-to-mid, mid-to-end, and pre-to-end. When normalized to an 8-hr shift or A(8), the HAV levels (not shown in the table) are slightly lower in magnitude than values appearing in Table 2 and all fall outside or below the HGCZ boundary levels of 2.5 m/s2 and 5.0 m/s2. Considering data for both the steering wheel and the gearshift selector, the mean A(8) levels from all seven subjects ranged from a low of 0.45 m/s2 to a high of 2.10 m/s2. Thus, all participants were exposed to hand-arm vibration levels that were in the safe range according to ISO/ANSI and European standards.
Table 2.
WBV and HAV exposures and associated changes in grip strength and touch sensation threshold. Periods with missing data are denoted with “NA” for not available.
| Subject | Period | WBV |
HAV |
Change in grip strength (N) |
Change in touch sensation threshold |
||||||||
|---|---|---|---|---|---|---|---|---|---|---|---|---|---|
| wRMSx (m/s2) |
wRMSy (m/s2) |
wRMSz (m/s2) |
Exposure time (min) |
VDVx (m/ s1.75) |
VDVy (m/ s1.75) |
VDVz (m/ s1.75) |
Steering wheel wRMStot (m/s2) |
Shifter wRMStot (m/s2) |
Index finger (g) |
Pinky finger (g) |
|||
| 1 | Pre to Mid |
0.40 | 0.35 | 0.53 | 110 | 7.6 | 7.2 | 10 | NA | NA | −5.4 | −0.09 | −0.09 |
| Mid to End |
NA | NA | NA | NA | NA | NA | NA | NA | NA | 26.0 | 0.09 | 0.09 | |
| Pre to End |
0.40 | 0.35 | 0.53 | 110 | 7.6 | 7.2 | 10 | NA | NA | 20.6 | 0 | 0 | |
| 2 | Pre to Mid |
0.30 | 0.31 | 0.65 | 199 | 3.8 | 3.8 | 7.3 | 2.11 | 1.79 | 5.7 | 0 | 0 |
| Mid to End |
0.22 | 0.26 | 0.43 | 169 | 3.3 | 3.7 | 6.2 | 1.96 | 2.35 | −1.5 | 0 | 0 | |
| Pre to End |
0.27 | 0.29 | 0.56 | 369 | 3.6 | 3.7 | 6.8 | 2.06 | 1.85 | 4.2 | 0 | 0 | |
| 3 | Pre to Mid |
0.19 | 0.17 | 0.39 | 250 | 2.2 | 2.1 | 4.2 | 1.50 | 1.32 | 111.5 | 0 | 0 |
| Mid to End |
0.21 | 0.20 | 0.42 | 106 | 2.5 | 2.3 | 4.7 | 1.52 | 1.41 | −18.5 | 0.24 | 0.24 | |
| Pre to End |
0.19 | 0.18 | 0.39 | 356 | 2.3 | 2.2 | 4.3 | 1.51 | 1.35 | 93.0 | 0 | 0.24 | |
| 4 | Pre to Mid |
0.23 | 0.20 | 0.52 | 240 | 5.1 | 4.9 | 14 | NA | 1.09 | −52.2 | −0.09 | −0.09 |
| Mid to End |
0.19 | 0.17 | 0.48 | 238 | 3.1 | 2.5 | 10 | 2.17 | 0.76 | 52.3 | 0 | 0 | |
| Pre to End |
0.21 | 0.19 | 0.50 | 478 | 4.1 | 3.7 | 12 | NA | 0.95 | 0.1 | −0.09 | −0.09 | |
| 5 | Pre to Mid |
4.75 | 0.25 | 0.40 | 258 | 18 | 5.0 | 7.8 | 1.96 | 1.20 | 9.8 | 0 | 0 |
| Mid to End |
3.76 | 0.19 | 0.32 | 231 | 60 | 3.2 | 5.6 | 1.77 | 1.14 | 16.0 | 0 | 0 | |
| Pre to End |
4.31 | 0.22 | 0.37 | 489 | 36 | 4.2 | 6.8 | 1.89 | 1.18 | 25.7 | 0 | 0 | |
| 6 | Pre to Mid |
0.21 | 0.16 | 0.36 | 166 | 4.2 | 5.1 | 1.1 | 1.18 | 0.54 | −16.7 | −0.2 | −0.2 |
| Mid to End |
0.19 | 0.15 | 0.32 | 203 | 3.8 | 4.5 | 1.1 | 1.10 | 0.48 | −32.5 | 0 | 0 | |
| Pre to End |
0.19 | 0.15 | 0.33 | 369 | 3.9 | 4.7 | 1.1 | 1.14 | 0.51 | −49.2 | −0.24 | −0.2 | |
| 7 | Pre to Mid |
0.15 | 0.14 | 0.28 | 180 | 2.0 | 1.7 | 3.4 | 1.01 | 0.53 | 3.5 | −0.03 | −0.03 |
| Mid to End |
0.17 | 0.15 | 0.33 | 178 | 2.4 | 2.0 | 4.2 | 1.00 | 0.52 | −8.0 | 0 | 0 | |
| Pre to End |
0.16 | 0.14 | 0.30 | 358 | 2.2 | 1.8 | 3.7 | 1.01 | 0.52 | −4.5 | 0 | −0.03 | |
Bold font is used to denote instances where the wRMS or VDV levels are within or above the HGCZ.
Likewise, mean WBV values (expressed as wRMS and VDV for the driver/seat interface) are shown for each of the orthogonal axes and pre-to-mid, mid-to-end, and pre-to-end sampling intervals. Here, the axis showing the highest level of vibration A(8) is compared to the aforementioned vibration standards. Most WBV levels appeared outside the health risk regions of the existing vibration standards. When normalized to an 8-hr shift or A(8), the WBV levels (not shown in the table) are slightly higher in magnitude for the X- and Y– axes and slightly lower for Z-axis for both wRMS and VDV when compared to values appearing in Table 2. Nevertheless, wRMS and VDV levels “within” and “above” the HGCZ of the standards occurred for participants at the two quarries that exhibited the roughest roadways—muddy at times, undulating with ruts and potholes. wRMS A(8) levels for Subjects 1, 2, and 4 showed values that were within the HGCZ of the standards (0.45 m/s2 to 0.90 m/s2 - ISO/ANSI; 0.50 m/s2 to 1.15 m/s2 - European) for RMS and (8.2 m/s1.75–16 m/s1.75 - ISO/ANSI; 9.1 m/s1.75–21 m/s1.75 - European) for VDV. These A(8) values ranged from 0.49 to 0.61 m/s2 (RMS) and 9–13 m/s1.75 (VDV). In these instances, the X-axis was dominant for Subject 1 whereas, the Z-axis was dominant for Subjects 2 and 4. Moreover, Subject 5 showed wRMS and VDV (X-axis) levels that exceeded the HGCZ exposure limits for the existing WBV standards by 4–7 times for wRMS and more than 5 times for VDV. A(8) RMS levels ranged from 4.92 to 6.22 m/s2 and the same for VDV from 78 to 84 m/s1.75. Although these data points appear to be outliers, it is possible, given the quarry roadway conditions, that such levels of WBV could be produced.
Figs. 4 and 5 show sway area and average velocities of the centers of pressure in the medial/lateral and anterior/posterior directions, respectively. Velocities of the centers of pressures in the anterior/posterior direction were greater than those in the medial/lateral direction. Mauchly's test for sphericity showed that the assumption of sphericity was violated for the average sway velocity in the medial/lateral direction, χ2(2) = 11.151, p = 0.004. The degrees of freedom were corrected using Greenhouse-Geisser estimates of sphericity (ε = 0.528). Results showed no significant effect of vibration exposure over time on the average sway velocity in the medial/lateral direction, F(1.057,11.151) = 0.150, p = 0.725. Mauchly's test also showed that the assumption of sphericity was violated for the average sway velocity in the anterior/posterior direction, χ2(2) = 6.366, p = 0.041. The degrees of freedom were corrected using Greenhouse-Geisser estimates of sphericity (ε = 0.581). Results showed no significant effect of vibration exposure over time on the average sway velocity in the anterior/posterior direction, F(1.163,6.366) = 1.197, p = 0.322. Mauchly's test for sphericity showed that the assumption of sphericity was not violated for the average sway area, χ2(2) = 1.636, p = 0.441. There was no significant effect of vibration exposure over time on the average sway area, p = 0.201.
Fig. 4.
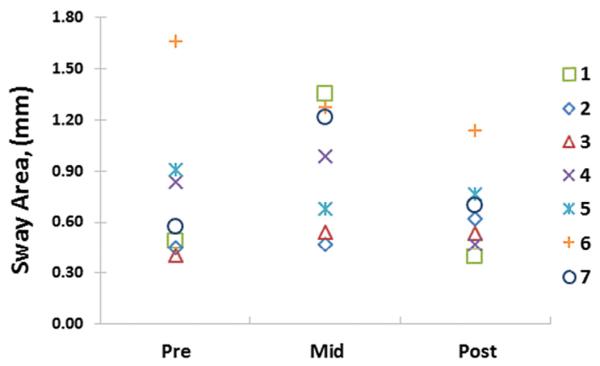
Average sway area from pre-shift (Pre), mid-shift (Mid), and post-shift (Post) measurements for all participants.
Fig. 5.

Average velocities of the centers of pressure in the medial/lateral and anterior/posterior directions from pre-shift (Pre), mid-shift (Mid), and post-shift (Post) measurements for all participants.
HAV levels were also recorded for a second day of data collection, although not directly related to balance measures these values are worth noting. The HAV for the steering wheel and gearshift selector were comparable to the values for the other day of testing, as shown in Table 2 and were below the HGCZ boundaries. Mean A(8) levels for all seven participants (not shown in Table 3) ranged from a low of 0.51 m/s2 to a high of 2.05 m/s2. Again, Table 3 shows the majority of WBV measures as below the HGCZ of the WBV standards. Instances of wRMS and VDV levels (within or above the HGCZ), as noted above, occurred for Subjects 1, 2, 4, and 5 who operated haul trucks at the same two quarries that exhibited the rough roadways described previously. Moreover, the consistently higher levels of exposure occurred for Subjects 1, 4, and 5 who worked at the same quarry. Mean A(8) values (within or above the HGCZ and not shown in Table 3) for Subjects 1, 2, 4, and 5 ranged from 0.46 to 1.21 m/s2 (wRMS) and 12–47 m/s1.75 (VDV). The dominant axes of vibration were the Z (vertical direction) and the Z and Y (side-to-side direction) for Subjects 1, and 2 through 5, respectively. Changes in the location of loading and dumping within the quarry throughout the day may have contributed to operators driving in rougher roadway conditions.
Table 3.
WBV and HAV exposures and associated changes in balance measures. Periods with missing data are denoted with “NA” for not available.
| Subject | Period | WBV |
HAV |
Change in balance measures |
|||||||||
|---|---|---|---|---|---|---|---|---|---|---|---|---|---|
| wRMSx (m/s2) |
wRMSy (m/s2) |
wRMSz (m/s2) |
Exposure time (Min) |
VDVx (m/ s1.75) |
VDVy (m/ s1.75) |
VDVz (m/ s1.75) |
Steering wheel wRMSTotal (m/s2) |
Shifter wRMSTotal (m/s2) |
Average sway area (mm) |
Mean velocity ML (mm/s) |
Mean velocity AP (mm/s) |
||
| 1 | Pre to Mid |
0.33 | 0.25 | 0.48 | 237 | 4.7 | 3.5 | 7.7 | 1.75 | 1.92 | 0.04 | 0.19 | 0.87 |
| Mid to End |
0.31 | 0.24 | 0.84 | 263 | 4.4 | 3.3 | 28 | NA | NA | −0.05 | −0.21 | −0.96 | |
| Pre to End |
0.32 | 0.25 | 0.68 | 501 | 4.6 | 3.4 | 19 | 1.75 | 1.92 | −0.01 | −0.03 | −0.09 | |
| 2 | Pre to Mid |
0.25 | 0.37 | 0.46 | 120 | 3.5 | 5.1 | 5.9 | 1.82 | 1.43 | −0.09 | −0.17 | 0.02 |
| Mid to End |
0.26 | 0.29 | 0.56 | 125 | 2.9 | 3.0 | 6.1 | 1.98 | 1.61 | 0.05 | 0.07 | 0.15 | |
| Pre to End |
0.26 | 0.32 | 0.52 | 245 | 3.1 | 3.8 | 6.0 | 1.89 | 1.59 | −0.04 | −0.09 | 0.17 | |
| 3 | Pre to Mid |
0.17 | 0.17 | 0.36 | 275 | 2.4 | 2.6 | 4.3 | 1.37 | 1.31 | 0.16 | 0.10 | 0.14 |
| Mid to End |
0.19 | 0.18 | 0.41 | 80 | 2.5 | 2.3 | 4.7 | 1.47 | 1.29 | −0.08 | −0.10 | −0.01 | |
| Pre to End |
0.18 | 0.17 | 0.38 | 355 | 2.4 | 2.5 | 4.4 | 1.42 | 1.30 | 0.08 | 0.00 | 0.13 | |
| 4 | Pre to Mid |
0.27 | 0.25 | 0.53 | 269 | 4.5 | 4.3 | 13 | 1.94 | 1.08 | −0.02 | −0.13 | 0.15 |
| Mid to End |
0.81 | 0.92 | 0.90 | 226 | 30 | 36 | 38 | NA | NA | −0.01 | −0.01 | −0.52 | |
| Pre to End |
0.51 | 0.55 | 0.69 | 495 | 16 | 18 | 24 | 1.94 | 1.08 | −0.03 | −0.14 | −0.37 | |
| 5 | Pre to Mid |
0.46 | 0.47 | 0.59 | 228 | 13 | 14 | 20 | 2.09 | 1.38 | −0.03 | −0.03 | −0.23 |
| Mid to End |
0.32 | 0.31 | 0.44 | 240 | NA | 3.1 | 5.8 | 2.19 | 1.35 | 0.01 | −0.03 | 0.09 | |
| Pre to End |
0.39 | 0.39 | 0.51 | 468 | NA | 8.3 | 13 | 2.14 | 1.36 | −0.01 | −0.06 | −0.14 | |
| 6 | Pre to Mid |
0.19 | 0.16 | 0.33 | 200 | 3.7 | 4.5 | 1.1 | 1.22 | 1.34 | −0.08 | −0.04 | −0.38 |
| Mid to End |
0.20 | 0.16 | 0.33 | 197 | 3.7 | 4.6 | 1.1 | 1.27 | 0.85 | 0.04 | −0.03 | −0.14 | |
| Pre to End |
0.20 | 0.16 | 0.33 | 397 | 3.7 | 4.6 | 1.1 | 1.24 | 1.10 | −0.04 | −0.07 | −0.52 | |
| 7 | Pre to Mid |
0.18 | 0.17 | 0.38 | 180 | 2.6 | 2.2 | 4.8 | 1.02 | 0.55 | 0.06 | 0.19 | 0.64 |
| Mid to End |
0.18 | 0.16 | 0.36 | 139 | 2.4 | 2.0 | 4.1 | 1.03 | 0.54 | −0.05 | −0.11 | −0.52 | |
| Pre to End |
0.18 | 0.16 | 0.37 | 319 | 2.5 | 2.1 | 4.4 | 1.02 | 0.55 | 0.01 | 0.08 | 0.12 | |
Bold font is used to denote instances where the wRMS or VDV levels are within or above the HGCZ.
4. Discussion
Touch sensation threshold and grip strength measurements were taken for drivers before, during, and after operating a haul truck and being exposed to whole-body and hand-arm vibration. The authors expected that the exposure to HAV would cause an increase in touch sensation threshold and a reduction in average and maximal grip strength. However, results showed no statistically significant changes in these measures over time. The vibration levels transmitted to the operators participating in this study were likely not high enough to elicit an acute effect but may still be of sufficient magnitude to cause long-term changes. Although all HAV levels were within the range considered safe by the ISO and European standards for the period studied, it is still possible that vibration exposure had already contributed to some long-term effects on the operators. Recent research has questioned whether the RMS method underestimates vibration effects on human health (Zhao and Schindler, 2014). Also, vibration exposures can change dramatically over the course of time due to environmental factors, ground conditions, vehicle maintenance, and work environment changes such as relocation of pits and dump sites (Langer et al., 2015; Smets et al., 2010). Two days of vibration measurements may not be characteristic of a “typical” day and it is still possible that drivers were overexposed to vibration at some point in their career. Almost all the operators were shown to have some form of diminished light touch sensation which could be an early symptom of Hand-Arm Vibration Syndrome (van Niekerk et al., 2000). Without having data from before the participants became haul truck operators, it is not possible to determine the exact source or cause of this reduced capacity to detect touch. However, prolonged exposure to hand-arm vibration due to operating a haul truck is a likely contributor, as previous research has predicted finger blanching in 10% of exposed drivers after less than two years of operating small four-wheel drive tractors (Goglia et al., 2003). The long-term effects of HAV can take over six years before the presentation of vascular or musculoskeletal symptoms (Bernard et al., 1998; Nyantumbua et al., 2007). As such, drivers may have a slow, steady decline in function due to prolonged vibration exposure which would not be evident in a short-term study such as this.
No short-term changes in balance measures were found in the drivers in this study. This was surprising as similar research has found an increase in postural sway after exposure to whole-body vibration. The methodology in the current study had several potential shortcomings which may have contributed to the lack of significant findings. First, when collecting balance measurements, it is essential to collect the data soon after the end of the treatment. It was not possible to collect balance data on the deck of the haul truck due to space limitations. As such, all drivers had to egress from the equipment to have their balance measured. This resulted in all participants climbing down a vertical ladder and walking a short distance, less than 30 feet, into the shop area of the mine site before standing on a force plate for balance measurements. These series of movements may have been sufficient to re-stabilize the participants which has been shown to occur in similarly short time periods for sensorimotor treatment techniques (Oullier et al., 2009). Additionally, testing in the “eyes closed” position as recommended by Santos et al. (2008a) may not have allowed the contribution of the vibration effects on the visual system to be revealed, as Ahuja et al. (2005) demonstrated that leaving the eyes open during balance testing resulted in increased postural sway as compared to the “eyes closed” position for balance measurements taken following vibration exposure. As such, it is expected that having participants complete balance testing with eyes open may have also resulted in different findings. In the future, balance testing of heavy mobile equipment operators should be performed on the deck of the equipment before the operator is able to egress from the equipment and with the operator's eyes open.
The current study did not find any statistically significant reductions in grip strength, increases in touch sensation threshold, or decreases in postural stability. As such, the causes or factors contributing to the increased falls from mobile equipment during egress following vibration exposure could not be identified from this study alone. Although WBV and HAV may play a role, their level of impact has yet to be determined and mitigation strategies are also largely unknown. There are some potential areas of interest which could be further investigated. The most severe slip and fall hazards for vertical ladder climbing are due to hand and foot forces (Bloswisk and Chaffin, 1990). The hands must constantly exert force to prevent falling from a ladder while the hips must perform most of the work to lift and lower the body (Armstrong et al., 2009).
Although this study examined the loss of sensory perception and reduced force production of the hands, there is another missing component to safely descending ladders—the feet. In many cases, the cause of the fall from mobile equipment is not due to environmental factors such as wet or icy conditions. For many, a foot slips from a ladder or step resulting in a fall or an injury due to a fall recovery (Moore et al., 2009). Further, while HAVS is traditionally regarded as affecting the upper extremities, it has been shown to also affect the lower extremities (Sakakibara et al., 1991; Schweigert, 2002). Circulatory disturbances of the feet are thought to be caused by repeated long-term vasoconstriction of the feet induced by HAV through the sympathetic nervous system. However, these disturbances may also result from foot-transmitted vibration exposures. Vibration induced-white feet has recently received attention and has been shown to result from standing on vibrating platforms or equipment. The condition results in toe blanching and tingling and numbness in the feet and toes, similar to the symptoms of vibration induced white finger (Eger et al., 2014). If the effects of foot-transmitted vibration on the vascular and nervous systems of the feet are of sufficient magnitude, a reduction in plantar-surface sensitivity would occur. This insensitivity may reduce a person's perception of a ladder or step beneath their feet, resulting in a slip or missed step. This is an area where future research is needed.
Visual disturbances associated with WBV exposure is also an area of consideration. WBV has been previously shown to negatively impact visual acuity alone and when combined with noise exposure (Griffin, 1976; Seidel et al., 1988). Linear vibration at frequencies as low as 7 Hz have been found to reduce visual acuity by causing angular eye movements. The role of these adverse eye movements may also play a role in a person's ability to safely utilize mobile equipment ingress/egress. This is also an area where future research is needed.
5. Conclusion
While it is well-known that mobile mining equipment operators get injured while egressing from their equipment, the causation of these injuries is still undetermined. This study was unable to determine any significant short-term effects of whole-body or hand-arm vibration on balance, grip strength, or touch sensation threshold. Further research is needed to explore additional, long-term and short-term factors that may have a greater contribution to this fall risk for mobile equipment operators. These additional factors may include the usage of ladders, exiting onto a slippery surface, foot or hand slippage, visual disturbance, or the long-term detriments to touch sensation threshold in the hands and feet.
Relevance to industry.
Whole-body and hand-arm vibration exposures were investigated for quarry haul trucks to determine their effects on short-term changes in postural stability, touch sensation threshold, and grip strength. No significant effects could be identified between the measures examined during this study.
Acknowledgements
The authors wish to thank Kristine Krajnak and Ren Dong from the NIOSH Health Effects Laboratory Division for their contributions to this research study. Kristine provided guidance on the instrumentation and methodology for grip strength and touch sensation threshold measurements and Ren provided guidance on vibration data collection and analysis methods.
Footnotes
Disclaimer
The findings and conclusions in this paper are those of the authors and do not necessarily represent the views of the National Institute for Occupational Safety and Health. Mention of any company or product does not constitute endorsement by NIOSH.
References
- Ahuja S, Davis J, Wade LR. Postural stability of commercial truck drivers: impact of extended durations on whole-body vibration. September 2005 Proc. Hum. Factors Ergonomics Soc. Annu. Meet..2005. pp. 1810–1814. [Google Scholar]
- American National Standards Institute (ANSI) ANSI: Guide for the Evaluation of Human Exposure to Whole-body Vibration. ANSI S3.18:2002. American National Standards Institute; New York: 2002. [Google Scholar]
- American National Standards Institute (ANSI) ANSI: Guide for the Measurement and Evaluation of Human Exposure to Vibration Transmitted to the Hand. ANSI S2.70:2006. American National Standards Institute; New York: 2006. [Google Scholar]
- Armstrong TJ, Young J, Woolley C, Ashton-Miller J, Kim H. Biomechanical aspects of fixed ladder climbing: style, ladder tilt and carrying. October 2009 Proc. Hum. Factors Ergonomics Soc. Annu. Meet..2009. pp. 935–939. [Google Scholar]
- Bernard B, Nelson N, Estill CF, Fine L. The NIOSH review of hand-arm vibration syndrome: vigilance is crucial. J. Occup. Environ. Med. 1998;40(9):780–785. doi: 10.1097/00043764-199809000-00006. [DOI] [PubMed] [Google Scholar]
- Bloswisk DS, Chaffin DB. An ergonomic analysis of the ladder climbing activity. Int. J. Industrial Ergonomics. 1990;6:17–27. [Google Scholar]
- Bovenzi M. Exposure-response relationship in the hand-arm vibration syndrome: an overview of current epidemiology research, 809-519 Int. Archives Occup. Environ. Health. 1998;71 doi: 10.1007/s004200050316. [DOI] [PubMed] [Google Scholar]
- Bruce MF. The relation of tactile thresholds to histology in the fingers of elderly people. J. Neurology, Neurosurg. Psychiatry. 1980;43:730–734. doi: 10.1136/jnnp.43.8.730. [DOI] [PMC free article] [PubMed] [Google Scholar]
- Cenderlund R, Nordenskiöld U, Lundborg G. Hand-arm vibration exposure influences performance of daily activities. Disabil. Rehabilitation. 2001;23(13):570–577. doi: 10.1080/09638280010036535. [DOI] [PubMed] [Google Scholar]
- Cornelius K, Redfern M, Steiner L. Postural stability after whole body vibration exposure. Int. J. Industrial Ergonomics. 1994;13(4):343–351. [Google Scholar]
- Eger T, Thompson A, Leduc M, Krajnak K, Goggins K, Godwin A, House R. Vibration induced white-feet: overview and field study of vibration exposure and reported symptoms in workers. Work. 2014;47:101–110. doi: 10.3233/WOR-131692. [DOI] [PMC free article] [PubMed] [Google Scholar]
- Gaidhane AH, Patil SG. Study of effects of vibration on grip strength. Int. J. Mod. Eng. Res. 2012;2(1):454–457. [Google Scholar]
- Gauchard G, Chau N, Mur JM, Perrin P. Falls and working individuals: role of extrinsic and intrinsic factors. Ergonomics. 2001;44(14):1330–1339. doi: 10.1080/00140130110084791. [DOI] [PubMed] [Google Scholar]
- Goglia V, Gospodarić Z, Košutić S, Filipović D. Hand-transmitted vibration from the steering wheel to drivers of a small four-wheel drive tractor. Appl. Ergon. 2003;34:45–49. doi: 10.1016/s0003-6870(02)00076-5. [DOI] [PubMed] [Google Scholar]
- Griffin MJ. Eye motion during whole-body vertical vibration. Hum. Factors. 1976;18(6):601–606. doi: 10.1177/001872087601800608. [DOI] [PubMed] [Google Scholar]
- Ho ST, Yu HS. A study of neurophysiological measurements and various function tests on workers occupationally exposed to vibration. J. Int. Archives Occup. Environ. Health. 1986;58(4):259–268. doi: 10.1007/BF00377883. [DOI] [PubMed] [Google Scholar]
- International Organization for Standardization (ISO) ISO 2631-1:1997. Mechanical Shock and Vibration: Evaluation of Human Exposure to Whole-body Vibration. Part 1. Author; Geneva: 1997. [Google Scholar]
- International Organization for Standardization (ISO) ISO 5349-1:2001. Mechanical Vibration Measurement and Evaluation of Human Exposure to Hand-transmitted Vibration. Part 1 and 2. Author; Geneva: 2001. [Google Scholar]
- Langer TH, Ebbesen MK, Kordestani A. Experimental analysis of occupational whole-body vibration exposure of agricultural tractor with large square baler. Int. J. Industrial Ergonomics. 2015;47:79–83. [Google Scholar]
- Lin L-J, Cohen HH. Accidents in the trucking industry. Int. J. Industrial Ergonomics. 1997;20(4):287–300. [Google Scholar]
- Lundström R, Lindmark A. Effects of local vibration on tactile perception in the hands of dentists. J. Low. Freq. Noise Vib. 1982;1:1–11. [Google Scholar]
- Mani R, Milosavljevic S, Sullivan SJ. The effect of occupational whole-body vibration on standing balance: a systematic review. Int. J. Industrial Ergonomics. 2010;40(6):698–709. [Google Scholar]
- Mannin O, Ekblom A. Single and joint actions of noise and sinusoidal whole body vibration on TTS2 values and low frequency upright posture sway in men. Int. Archives Occup. Environ. Health. 1984;54:1–17. doi: 10.1007/BF00378724. [DOI] [PubMed] [Google Scholar]
- Martin B, Gauthier GM, Roll JP, Hugon M, Harlay F. Effects of whole-body vibrations on standing posture in man. Aviat. Space, Environ. Med. 1980;51(8):778–787. [PubMed] [Google Scholar]
- Massy-Westropp NM, Gill TK, Taylor AW, Bohannon RW, Hill CL. Hand Grip Strength: age and gender stratified normative data in a population-based study. BMC Res. Notes. 2011;4:127. doi: 10.1186/1756-0500-4-127. [DOI] [PMC free article] [PubMed] [Google Scholar]
- Metter EJ, Conwit R, Metter B, Pacheco T, Tobin J. The relationship of peripheral motor nerve conduction velocity to age-associated loss of grip strength. Aging. 1998;10(6):471–478. doi: 10.1007/BF03340161. [DOI] [PubMed] [Google Scholar]
- Moore SM, Porter WL, Dempsey PG. Falls from equipment injuries in U.S. mining: identification of specific research areas for future investigation. J. Saf. Res. 2009;40(6):455–460. doi: 10.1016/j.jsr.2009.10.002. [DOI] [PubMed] [Google Scholar]
- Nyantumbua B, Barber CM, Ross M, Curran AD, Fishwick D, Dias B, Kgalamono S, Philips JI. Hand-arm vibration syndrome in South African gold miners. Occup. Med. 2007;57:25–29. doi: 10.1093/occmed/kql089. [DOI] [PubMed] [Google Scholar]
- Oullier O, Kavounoudias A, Duclo C, Albert F, Roll J-P, Roll R. Countering postural posteffects following prolonged exposure to whole-body vibration: a sensorimotor treatment. Eur. J. Appl. Physiology. 2009;105:235–245. doi: 10.1007/s00421-008-0894-4. [DOI] [PubMed] [Google Scholar]
- Prieto TE, Myklebust JB, Hoffman RG, Lovett EG, Myklebust BM. Measures of postural steadiness: differences between healthy young and elderly adults. IEEE Trans. Biomed. Eng. 1996;43:956–966. doi: 10.1109/10.532130. [DOI] [PubMed] [Google Scholar]
- Sakakibara H, Hashiguchi T, Furuta M, Kondo T, Miyao M, Yamada S. Circulatory disturbances of the foot in vibration syndrome. Int. Archives Occup. Environ. Health. 1991;63:145–148. doi: 10.1007/BF00379079. [DOI] [PubMed] [Google Scholar]
- Santos BR, Lariviere C, Delisle A, Plamondon A, Boileau P, Imbeau D. A laboratory study to quantify the biomechanical responses to whole-body vibration: the influence on balance, reflex response, muscular activity and fatigue. Int. J. Industrial Ergonomics. 2008a;28(7–8):626–639. [Google Scholar]
- Santos BR, Delisle A, Lariviere C, Plamondon A, Imbeau D. Reliability of centre of pressure summary measured of postural steadiness in healthy young adults. Gait Posture. 2008b;27:408–415. doi: 10.1016/j.gaitpost.2007.05.008. [DOI] [PubMed] [Google Scholar]
- Santos BR, Porter WL, Mayton AG. An analysis of injuries to haul truck operators in the U.S. Mining industry. Proceedings of the Human Factors and Ergonomics Society 54th Annual Meeting; September 27-October 1, 2010; San Francisco, California. Santa Monica, CA: Human Factors and Ergonomics Society; 2010. pp. 1870–1874. 2010 Sep. [Google Scholar]
- Schweigert M. The relationship between hand-arm vibration and lower extremity clinical manifestations: a review of the literature. Int. Archives Occup. Environ. Health. 2002;75:179–185. doi: 10.1007/s004200100269. [DOI] [PubMed] [Google Scholar]
- Seidel H, Harazin B, Pavlas K, Sroka C, Richter J, Blüthner R, Erdmann U, Grzesik J, Hinz B, Rothe R. Isolated and combined effects of prolonged exposures to noise and whole-body vibration on hearing, vision and strain. Int. Archives Occup. Environ. Health. 1988;61:95–106. doi: 10.1007/BF00381613. [DOI] [PubMed] [Google Scholar]
- Shibuya H, Cleal B, Kines P. Hazard scenarios of truck drivers' occupational accidents on and around trucks during loading and unloading. Accid. Analysis Prev. 2010;42:19–29. doi: 10.1016/j.aap.2009.06.026. [DOI] [PubMed] [Google Scholar]
- Smets M, Eger TR, Grenier SG. Whole-body vibration experienced by haulage truck operators in surface mining operations: a comparison of various analysis methods utilized in the prediction of health risks. Appl. Ergon. 2010;41(6):763–770. doi: 10.1016/j.apergo.2010.01.002. [DOI] [PubMed] [Google Scholar]
- Thornbury JM, Mistretta CM. Tactile sensitivity as a function of age. J. Gerontology. 1981;36(1):34–39. doi: 10.1093/geronj/36.1.34. [DOI] [PubMed] [Google Scholar]
- van Niekerk JL, Heyns PS, Heyns M. Human vibration levels in the South African mining industry. J. South Afr. Inst. Min. Metallurgy. 2000 Jul-Aug;:235–242. [Google Scholar]
- Widia M, Md Dawal SZ. Investigation of upperlimb muscle activity and grip strength during drilling task. IMECS 2010, March 17-19, 2010. Hong Kong Proc. Int. Multiconference Eng. Comput. Sci. III. 2010 [Google Scholar]
- Widia M, Md Dawal SZ. The effect of hand-held vibrating tools on muscle activity and grip strength. Aust. J. Basic Appl. Sci. 2011;5(11):198–211. [Google Scholar]
- Young J, Armstrong T, Woolley C, Ashton-Miller J. Effect of using rungs or rails on hand forces while ascending and descending fixed ladders. Proceedings of the 2010 International Conference on Fall Prevention and Protection; 2011. pp. 2012–2103. DHHS (NIOSH) Publication No. [Google Scholar]
- Zhao X, Schindler C. Evaluation of whole-body vibration exposure experienced by operators of a compact wheel loader according to ISO 2631-1:1997 and ISO 2631-5:2004. Int. J. Industrial Ergonomics. 2014;44:840–850. [Google Scholar]