

Abstract
Background
Parkinson’s disease (PD) is marked pathologically by dopamine neuron loss and iron overload in the substantia nigra pars compacta. Midbrain iron content is reported to be increased in PD based on magnetic resonance imaging (MRI) R2* changes. Because quantitative susceptibility mapping is a novel MRI approach to measure iron content, we compared it with R2* for assessing midbrain changes in PD.
Methods
Quantitative susceptibility mapping and R2* maps were obtained from 47 PD patients and 47 healthy controls. Midbrain susceptibility and R2* values were analyzed by using both voxel-based and region-of-interest approaches in normalized space, and analyzed along with clinical data, including disease duration, Unified Parkinson’s Disease Rating Scale (UPDRS) I, II, and III sub-scores, and levodopa-equivalent daily dosage. All studies were done while PD patients were “on drug.”
Results
Compared with controls, PD patients showed significantly increased susceptibility values in both right (cluster size = 106 mm3) and left (164 mm3) midbrain, located ventrolateral to the red nucleus that corresponded to the substantia nigra pars compacta. Susceptibility values in this region were correlated significantly with disease duration, UPDRS II, and levodopa-equivalent daily dosage. Conversely, R2* was increased significantly only in a much smaller region (62 mm3) of the left lateral substantia nigra pars compacta and was not significantly correlated with clinical parameters.
Conclusion
The use of quantitative susceptibility mapping demonstrated marked nigral changes that correlated with clinical PD status more sensitively than R2*. These data suggest that quantitative susceptibility mapping may be a superior imaging biomarker to R2* for estimating brain iron levels in PD.
Keywords: Parkinson’s disease, magnetic resonance imaging, quantitative susceptibility mapping, substantia nigra, iron
Parkinson’s disease (PD) is marked pathologically by the loss of dopaminergic neurons in the substantia nigra (SN) pars compacta (SNpc) of the basal ganglia.1–3 Interestingly, post-mortem pathological studies also found increased iron content in this region.4–9 Although the exact role of iron in the patho-etiology of PD remains unclear, molecular studies have suggested links between increased iron or abnormal iron homoeostasis and multiple neurodegenerative diseases.7,10 Thus, in vivo imaging of brain iron content may be a potential biomarker for PD diagnosis and also may provide important information about the role of iron in PD etiology or progression.
To this end, during the last decade, magnetic resonance imaging (MRI) relaxation rates (e.g., R2* or R2′) have been used to estimate iron content of the SN in vivo. The data are consistent with increased iron in PD.6,8,11 Two longitudinal studies have reported contradictory results about whether R2* can mark PD progression.12,13 The R2* contrast reflects the variance of the magnetic field that is generated not only by local tissue magnetic susceptibility but also by surrounding tissue susceptibility. Consequently, the R2* value in each voxel is a weighted summation of magnetic properties from both local and surrounding tissue. These known deficiencies in R2* have led to the development of a novel MRI modality, quantitative susceptibility mapping (QSM). Quantitative susceptibility mapping is superior in quantifying tissue iron content because it removes the effects of susceptibility of the surrounding tissue through deconvolution, thus providing a more direct measure of local tissue magnetic properties.14,15 Consistent with this hypothesis, a study in multiple sclerosis patients demonstrated that QSM was more sensitive to disease-related tissue changes and provided more direct information regarding disease progression.14,16
Because of the link between iron and PD, QSM may be a very useful tool for clinical studies. Two previous studies have provided preliminary support for this hypothesis.17,18 The current study compared QSM and R2* in a relatively large sample of PD patients with a broad spectrum of disease duration and severity, using a voxel-based analysis (VBA) approach with the goal of further evaluating the strengths and limitations of QSM for studying PD midbrain changes and their clinical correlations.
Materials and Methods
Subjects
Forty-seven PD patients were recruited from a tertiary movement disorder clinic. Parkinson’s disease diagnosis was confirmed by a movement disorder specialist according to the UK brain bank clinical diagnosis criteria.19 No patient had a history of neurological or psychiatric disease other than PD. Disease duration was calculated from the date of physician-confirmed PD diagnosis to the date of the study visit. All patients were optimized medically and on antiparkinsonian medication for PD under the management of a movement disorder specialist at the time of the study. The levodopa-equivalent daily dose (LEDD) was calculated for each patient.20 Disease severity was evaluated using the Unified PD Rating Scale (UPDRS) part I (nonmotor experience of daily living), part II (motor experience of daily living), and part III (motor examination) while on their PD medication. Forty-seven healthy control subjects closely matched to PD patients for age, sex, and education also were recruited. All controls were free of any neurological or psychiatric disease. The Montreal Cognitive Assessment (MoCA) was used to assess cognitive function in all subjects. All participants gave written informed consent that was reviewed and approved by the Penn State Hershey Institutional Review Board and was consistent with the Declaration of Helsinki (see Table 1 for detailed demographic and clinical data).
TABLE 1.
Demographic and clinical information
| Control (n = 47) | PD (n = 47) | P-value | |
|---|---|---|---|
| Female/male, n | 24/23 | 25/22 | 1.000 |
| Age, y, mean (SD) | 62.2 (8.8) | 65.8 (10.1) | 0.074 |
| Education, y, mean (SD) | 15.4 (3.7) | 14.4 (3.8) | 0.193 |
| MoCA | 25.8 (2.6) | 24.8 (3.9) | 0.139 |
| Disease duration, y, mean (SD) | — | 5.5 (4.8) | — |
| UPDRS I, mean (SD) | — | 9.1 (6.5) | — |
| UPDRS II, mean (SD) | — | 8.8 (7.5) | — |
| UPDRS III, mean (SD) | — | 21.8 (15.2) | — |
| Total UPDRS, mean (SD) | — | 39.6 (24.8) | — |
| LEDD, mean (SD) | — | 679 (487) | — |
Data represent the mean (SD), except for sex.
Disease duration was calculated as years since diagnosis; MoCA, Montreal Cognitive Assessment; UPDRS I, non-motor experience of daily living; UPDRS II, motor experience of daily living; UPDRS III, motor examination; LEDD, levodopa equivalent daily dosage; Total UPDRS, UPDRS I + UPDRS II + UPDRS III.
MRI Acquisition Protocol and Data Reconstruction
All subjects were scanned on a 3 T MRI system (Trio; Siemens Magnetom; Erlangen, Germany) with an eight-channel phased-array head coil. T1- and T2- weighted sequences were obtained for structural information. T1-weighted images were acquired using a magnetization-prepared rapid gradient echo sequence with TR/ TE = 1540/2.34, Field of View (FOV) = 256 mm, matrix = 256 × 256, slice thickness = 1 mm, slice number = 176, voxel size = 1 × 1 × 1 mm3, whereas T2-weighted images were acquired using a fast-spin-echo sequence with TR/TE = 2,500/316 and the same resolution settings as T1-weighted images. T2*-weighted images (for QSM and R2*) were acquired by using a multi-gradient-echo sequence with eight echoes (TE ranging from 6.2 to 49.6 ms and an equal interval of 6.2 ms), TR = 55 ms, flip angle = 15 °, FOV = 240 mm, matrix=256 × 256, slice thickness = 2 mm, slice number = 64, voxel size = 0.9 × 0.9 × 2 mm3. Quantitative susceptibility mapping maps were generated by using the morphology-enabled dipole inversion (MEDI) with nonlinear formulation method.15,21 A head position fixation device installed in the head coil was used to reduce potential head motion. Image quality was evaluated by an MRI technologist during the scan and deemed to be free of severe motion artifacts. R2* images were estimated by nonlinear curve fitting of the complex mono-exponential equation (S(TE)=S0e−R2*TEe−i2ωTE), using the Gauss-Newton algorithm. The precision of the estimated R2* in the midbrain was assessed by Cramer-Rao lower bound analysis, using an analytical formula provided in Raya et al.22 The Cramer-Rao lower bound of the mean R2* was 0.72 ± 0.67, indicating high-precision estimation.
Image Postprocessing
Image processing was performed using ANTS 1.9 (http://picsl.upenn.edu/software/ants) and 3D Slicer (version 6.3.1, http://www.slicer.org/). First, T1-weighted images were skull stripped, using an automatic tissue classification algorithm in 3D Slicer.23 Then, QSM and R2* images were skull stripped and normalized to the Montreal Neurological Institute template. The normalization procedure was done in two steps: (1) all QSM and R2* images first were co-registered to individual T1-weighted images using an affine registration algorithm with normalized mutual information as the similarity metric and magnitude images at first echo time (6.2 ms) as the moving images; at this stage brain masks also were applied to obtain skull-stripped R2* images (QSM had been skull stripped in the susceptibility estimation step, using MEDI); (2) individual T1-weighted images were co-registered to the Montreal Neurological Institute template, using a nonrigid registration algorithm with a cross-correlation similarity metric.24 The QSM and R2* images were brought directly to the template space by applying a concatenated transformation saved during the registration steps, using a b-spline interpolation to reduce low-pass filtering effects attributable to multiple resampling. The normalized QSM and R2* images were used to perform both voxel-based analysis (VBA) and region-of-interest (ROI) analysis.
Voxel-Based Analysis
Voxel-based analysis was conducted using SPM12 running under Matlab R2014b (MathWorks, Sher-born, MA, USA). Normalized images were filtered using a 4-mm full-width-at-half maximum Gaussian filter before comparison. General linear models with group as the main effect, age and sex as covariates, and QSM or R2* values as the dependent variable were fit at each voxel to generate statistical parameter maps. A stringent Bonferroni correction was used for familywise error rate correction within a 40 × 30 × 15 mm3 midbrain region containing the SN. To further protect against type I error at the cluster level, the minimum cluster size was set to 50 voxels.25,26
Region-of-Interest Analysis
Region of interest analyses were conducted to elucidate the overall effects of iron changes in the SNpc. To avoid interrater reliability issues and increase generalizability of the study, the ROI was defined in normalized space instead of individual subject space. The mean T2-weighted image from controls in normalized space was used as the reference image for the SNpc definition. The rationale for choosing the mean T2-weighted image for the SNpc definition was to avoid bias toward either QSM or R2*. The SNpc was defined in six slices from superior to inferior, starting from the middle of the red nucleus. A 4 × 10-mm kidney-shaped region between the red nucleus and the hypointensity band (in T2-weighted images, between the red nucleus and the boundary of the cerebellar peduncle) was identified as the SNpc (as in Fig. 1).8,27 Mean QSM and R2* values of the SNpc from both left and right sides were calculated for individual subjects from unfiltered normalized QSM and R2* images.
FIG. 1.
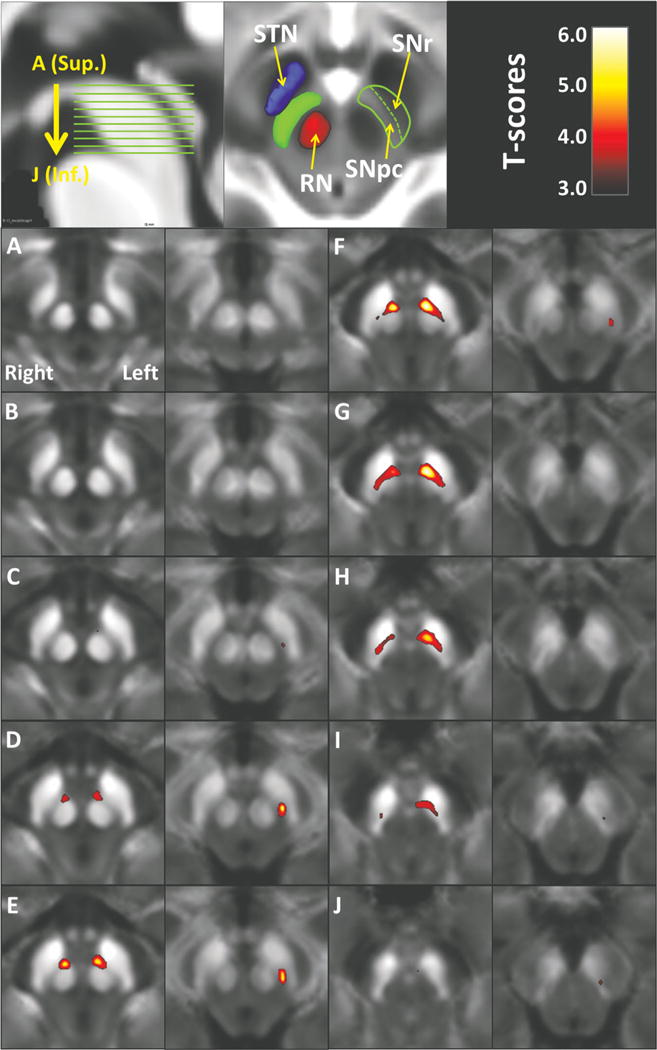
Voxel-based t-maps thresholded at P < 0.05 (after voxelwise Bonferroni correction) show increased iron content in both QSM (columns 1 and 3) and R2* (columns 2 and 4). (A–J) Axial sections through the midbrain in descending order as indicated on the sagittal section (top left). The significant maps from QSM mimic the location of the substantia nigra pars compacta (SNpc), namely, ventrolateral to the red nucleus and dorsomedial to subtantia nigra pars reticulata (SNr). The SNr is defined by the hypointensity band (in T2-weighted image) between the red nucleus and cerebral peduncle. The anatomical relationship between the SNpc and neighboring structures are illustrated at a normalized mean T2-weighted image from control subjects (top middle). Abbreviations: RN, red nucleus; SNpc, substantia nigra pars compacta; SNr, substantia nigra pars reticulata; STN, subthalamus nucleus; Inf., inferior; Sup., superior.
Statistical Analysis
Demographic data was compared between groups by using Fisher’s exact test for sex and two-tailed t tests for age, education, and MoCA scores. Regional QSM and R2* values were compared between patients and controls, using analysis of covariance with adjustment for age and sex. Correlations between MRI measures (ROI-based QSM and R2* values) and clinical data (including disease duration, LEDD, and UPDRS I, II, and III) were assessed by using partial Spearman correlation coefficients adjusted by age and sex. The correlation between imaging measures and age also was assessed by using Spearman correlation analysis. The correlation between the two imaging measures was assessed by using Pearson correlation analysis and coefficient of variance (CV). Logistic regressions and receiver operating characteristic curves were used for assessing the ability of QSM and R2* to discriminate PD from controls. Where error values are given, they are standard deviations. An α = 0.05 was considered to be statistically significant. All statistical analyses were performed by using SAS 9.3 (SAS Institute Inc., Cary, NC) except when conducting VBA.
Results
Demographic Data
Demographic and clinical data are summarized in Table 1. No statistically significant differences were seen between PD and controls regarding age, sex, education years, or cognitive function (using MoCA), although a trend was seen for PD subjects to be slightly older than controls. In both group comparisons and correlation analyses, age did not significantly affect the results.
VBA Analysis
Using midbrain-focused VBA, PD subjects displayed significantly higher QSM and R2* values in the SN (Fig. 1). The total volume (cluster size) of significant QSM change was 270 mm3, distributed in both the right (106 mm3) and left (164 mm3) midbrain. The location of the significant area was ventrolateral to the red nucleus and dorsomedial to the SN pars reticulata (the hypointensity band between the red nucleus and cerebral peduncle), a region consistent with the location of the SNpc. The total volume of significant R2* change was 62 mm3, distributed only in the left lateral region of the SNpc.
ROI Analysis
Previous reports indicate that R2* values are higher in PD patients than in controls, and consistent with this (Fig. 2), the R2* values in PD patients were higher by 15% (SNpc 32.8 ± 5.0 s−1 for controls vs 37.8 ± 4.3 s−1 for PD patients; [F = 24.35, P < 0.0001]). The SNpc QSM values for the PD patients, however, were 37% higher than in controls (108 ± 33 ppb for controls vs 148 ± 44 ppb for PD patients [F = 37.21, P < 0.0001]).
FIG. 2.
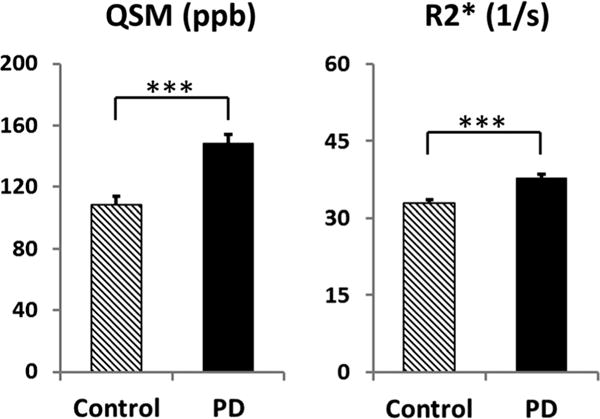
Comparison of the SNpc QSM and R2* values between PD and controls. The units for QSM are parts per billion (ppb). Error bars are standard errors of the mean.
Clinical Correlates of QSM and R2* Values
As shown in Table 2 and Figure 3, no significant correlations were found between R2* and any of the clinical measurements, although R2* in the SNpc showed a weak trend with disease duration (P = 0.093). Conversely, QSM values in the SNpc were highly correlated with disease duration (P = 0.003), LEDD (P = 0.004), and UPDRS II (P = 0.018), but not with age, UPDRS I or III, or total UPDRS scores.
TABLE 2.
Correlations between MRI and clinical measures
| Age | Duration | UPDRS I | UPDRS II | UPDRS III | Total UPDRS | LEDD | ||
|---|---|---|---|---|---|---|---|---|
| QSM | r | 0.073 | 0.423 | 0.123 | 0.345 | −0.020 | 0.177 | 0.415 |
| P-value | (0.626) | (0.003) | (0.409) | (0.018) | (0.892) | (0.234) | (0.004) | |
| R2* | r | 0.213 | 0.248 | 0.053 | 0.202 | 0.093 | 0.163 | 0.123 |
| P-value | (0.150) | (0.093) | (0.723) | (0.174) | (0.532) | (0.275) | (0.409) | |
Correlations between MRI and clinical measures were assessed using partial Spearman correlation with adjustments of age and sex. Table shows the r and associated P values (in parentheses). Bold italic indicates statistically significant correlations.
MRI, magnetic resonance imaging; UPDRS, Unified Parkinson’s Disease Rating Scale; LEDD, levodopa-equivalent daily dose; QSM, quantitative susceptibility mapping.
FIG. 3.
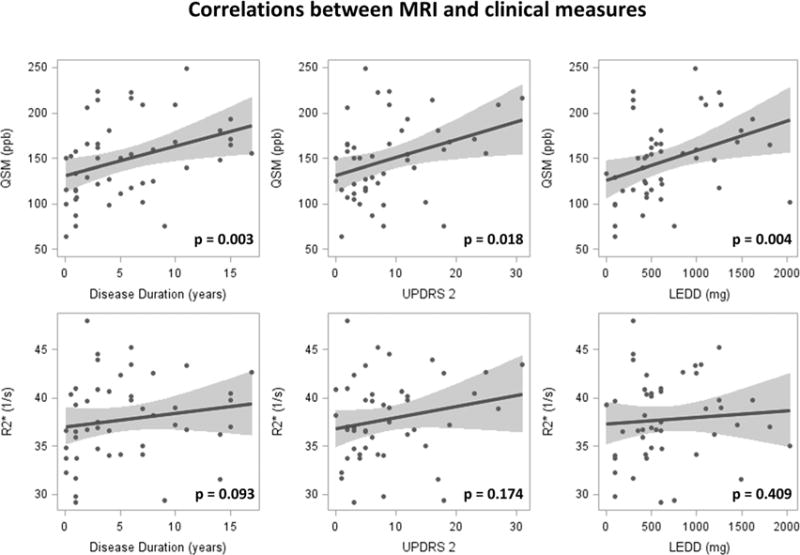
Correlations between MRI and clinical measures. QSM is correlated significantly with disease duration, UPDRS II, and levodopa equivalent daily dosage (LEDD).
Correlation between QSM and R2*
Because both QSM and R2* measure iron content in brain tissue, they are strongly correlated (r = 0.81, P < 0.001). Quantitative susceptibility mapping, however, presents a much larger dynamic range (50–250, CV = 0.34) compared with R2* (25–50, CV = 0.15) (Supplemental Data Fig. S1).
Predictive Analysis
Logistic regression analysis showed that both QSM and R2* are significant predictors for separating PD from controls. The area-under-the-curve statistics were 0.823 for QSM and 0.788 for R2* (see Supplemental Data Fig. S2 for receiver operating characteristic curves).
Discussion
The Role of Iron and In Vivo Iron-Imaging in PD
Iron plays a pivotal role in cellular functions ranging from DNA synthesis, intracellular and intercellular signal transduction, to oxygen transport and mitochondrial respiration.7,10,28 Excessive iron accumulation has been postulated as a causative factor in PD through iron-induced oxidative stress and neuronal vulnerability.7,10 Magnetic resonance imaging iron imaging techniques, such as R2* and QSM, provide a potential tool to study iron pathology in vivo in PD and understand its role in patients as the disease unfolds. The MRI signal, however, only reflects bulk magnetic properties of local and surrounding tissue. Although a particular MRI measurement may be correlated with iron, it can be confounded by other factors such as calcium, lipid, or myelin content.14,29,30
Magnetic resonance imaging transverse relaxation-based techniques (R2, R2*, and R2′) have been used to estimate regional brain iron changes in PD, and consistent reports exist of increased SN values in PD patients.6,8,12,13,31,32 Our current R2* results are similar, and the finding of more prominent R2* changes in the lateral SN also is consonant with prior reports.8,13 We were not able to demonstrate, however, correlations between R2* and disease severity measures, although a trend was seen for correlation between R2* and disease duration. These differing results could be attributable to two factors: First, different patient disease stages were found in two studies; the disease duration of PD subjects in the study by Martin and colleagues8 was 3.2 ± 1.7 years, compared with 5.5 ± 4.8 years in the current study. Second, UPDRS III scores obtained in the “on” drug state were used in our study, whereas the drug state of UPDRS III scores was not specified in the prior work.8
QSM and Its Clinical Implication in PD
Quantitative susceptibility mapping (QSM) is a potentially superior method of measuring iron in vivo because it reflects quantitative susceptibility of local tissues instead of the combined transverse relaxation and local field inhomogeneity indicated by R2*. This new contrast provides the possibility of detecting new information about iron and its role in PD pathology. Despite the promise QSM holds for measuring the dynamic processes of iron in vivo,14 it has not been applied widely to measure PD-related iron deposition and progression. Using a 7T MRI scanner, Lotfipour et al.17 reported increased susceptibility in the SNpc of a small group of nine early-stage PD patients (average disease duration, 2 years). Barbosa et al.18 reported consistently increased susceptibility in the SNpc in PD (n = 20) compared with controls (n = 30), also using a 3T scanner. The latter study, however, provided little information regarding clinical correlations with QSM measurements. In addition, Barbosa et al18 used the first three echoes of a four-echo sequence to estimate R2*, and a truncated k-space division approach for QSM reconstruction. Conversely, we used an eight-echo sequence for estimating R2* (this provides higher SNR than 3 echoes), and also used the MEDI approach that is known to be more accurate than truncated k-space division for QSM.14 This may explain why the current image quality is superior to that of Barbosa et al,18 and why the current areas under the curve for discriminating PD from controls by R2* (0.788) and QSM (0.823) are also superior to Barbosa et al18 (0.65 and 0.77, respectively). Why the reported R2* value for controls in the SNpc (47.7 s−1) by Barbosa et al18 was much higher than ours (32.8 s−1) or previous R2* work is unclear.8,12 Despite many technical differences, however, the results of our study are consistent with those of Barbosa et al18 in both group mean differences and discriminant power to distinguish PD from controls using QSM measurements; this strongly suggests that QSM is superior to R2*.
Our study applied QSM to study nigral iron-related changes in PD patients, using both voxel-based and ROI analyses in normalized space, and compared these results with those made using R2* measurements. Voxel-based analysis of the midbrain revealed significant QSM changes in PD located in the dorsomedial area of the whole SN close to the red nucleus, a region that corresponds to the SNpc defined in pathological work.1,27,33 R2*, however, showed significant changes only in a much smaller region of the left lateral SNpc. In addition, QSM showed much stronger correlations with clinical measurements than R2*. Together, these data suggest that QSM sensitively measures nigral change in PD, has stronger correlations with clinical measures than R2*, and holds the potential to be a better progression marker for PD.
Like recent work,18 we compared the results of QSM with that of R2* and confirmed that QSM provides similar results to R2*, but with a greater signal. The current study extended the prior QSM studies of PD in three ways: First, the use of the VBA method allowed us to reveal the exact spatial location of PD QSM changes in the midbrain. Using VBA and ROIs defined in normalized space, our study avoids the intrinsic inter- and intra-rater reliability problems in traditional ROI-based approaches. Second, the broader distribution of disease durations in a relatively large PD patient group included in our study (ranging from 1 to 18 years) enabled us to capture the associations between QSM changes and disease severity measures. Third, we correlated the imaging measures with clinical measures that led to clinical implications for QSM. Unlike R2* in the SNpc, we demonstrated that SNpc QSM was correlated with UPDRS II scores, the activities of daily life related to motor performance, but not with UPDRS I (nonmotor activities of daily life) or UPDRS III (clinician-scored motor performance) scores. This is particularly relevant because UPDRS III measures motor performance at the time of the examination and is influenced by patient’s drug treatment status.34 The UPDRS I is focused more on nonmotor function that generally is assumed to be associated with extranigral pathology. The UPDRS II, however, evaluates motor performance in daily life over the past week based on questionnaire, and it is thought to be a more sensitive measure for disease motor progression.34,35 We also observed a significant correlation between LEDD and QSM. Because LEDD typically increases with disease duration, it may reflect the correlation between disease duration instead of drug dosage. In addition, because both the MRI and clinical evaluation of patients were performed in the “on-medication” state in the current study, QSM/R2* and their correlations with clinical measures in the “off-mediation” state in PD patients need further investigation to compare with that in the “on-medication” state. Theoretically, iron content in brain tissue may not be affected by acute levodopa administration; however, no data are available to test this hypothesis, and further study is warranted.
Technical Advances and Limitations
Most previous efforts focused on imaging iron content in the SN using MRI were done using ROI approaches,6,8,11,12,32,36 although a few studies have used a voxel-based approach to analyze R2* images.31,37 The traditional region-based approach has the advantage of precisely defining the anatomical structure for each individual subject. It is limited, however, by the time-consuming labeling process and inconsistent definition of anatomy across studies. In the current study, all image analyses were carried out in normalized brain space without any human rater involvement, similar to the approach adopted in Ofori et al.38 This avoids the possibility of introducing bias that may arise from human engagement. Quantitative susceptibility mapping, compared with the R2* contrast, is a more direct parameter for quantifying local iron content by deconvolving the tissue susceptibility field and reducing the nonspecific susceptibility due to surrounding tissue.14 In our study, QSM showed a much larger dynamic range compared with R2*. This may explain why the QSM signal provides higher sensitivity in terms of both detecting SNpc changes in PD and correlating with disease severity measures compared with R2* in the current study.
The current study, however, has several limitations. First, despite the technical advantage of using QSM to quantify iron in vivo, the QSM signal also may be affected by a number of other factors such as calcium, lipid, or myelin content.14 Moreover, the exact type of iron reflected by QSM is unclear. For example, QSM does not separate the exact iron types (heme or non-heme iron) or report on ferritin- versus non–ferritin-bound iron. We also cannot address the cellular compartmentalization (neurons or microglia) of the iron in the SNpc, a critical factor if the imaging is to be related to cellular or molecular mechanisms. Further studies are needed to investigate the exact relationship between QSM and its histopathological correlates. Second, although this is by far the largest of the QSM studies in PD, our study is cross-sectional in nature. Future studies with larger sample sizes and longitudinal follow-up will be essential to capture the dynamic changes of QSM during PD progression.
Summary
QSM had higher sensitivity for delineating PD-related changes in the SNpc and correlates far better with clinical parameters than R2*. This suggests that QSM might hold promise as a new biomarker for studying iron-related pathology in PD and for monitoring disease progression. Further longitudinal studies, along with histopathological correlates, are needed and may provide insight into the role of iron in the pathophysiology of PD.
Supplementary Material
Acknowledgments
We thank all of the participants who volunteered for this study. We acknowledge the MRI technical support of Mr. Jeffery Vesek, and the assistance of study coordinators Ms. Melissa Santos, Ms. Raghda Clayiff, and Ms. Grace Shyu. Dr. Huang had full access to all of the data in the study and takes responsibility for the integrity of the data and the accuracy of the data analysis.
Funding agencies: This work was supported in part by the National Institute Neurological Disorders and Stroke (NS060722 and NS082151 to XH), the Hershey Medical Center GCRC (National Center for Research Resources, Grant UL1 RR033184 that is now at the National Center for Advancing Translational Sciences, Grant UL1 TR000127), the Pennsylvania Department of Health Tobacco CURE. All analyses, interpretations and conclusions are those of the authors and not the research sponsors.
Footnotes
Additional Supporting Information may be found in the online version of this article at the publisher’s web-site.
Relevant conflicts of interest/financial disclosures: Nothing to report.
Full financial disclosures and author roles may be found in the online version of this article.
References
- 1.Fearnley JM, Lees AJ. Ageing and Parkinson’s disease: substantia nigra regional selectivity. Brain. 1991;114:2283–2301. doi: 10.1093/brain/114.5.2283. [DOI] [PubMed] [Google Scholar]
- 2.Kordower JH, Olanow CW, Dodiya HB, et al. Disease duration and the integrity of the nigrostriatal system in Parkinson’s disease. Brain. 2013;136:2419–2431. doi: 10.1093/brain/awt192. [DOI] [PMC free article] [PubMed] [Google Scholar]
- 3.Damier P, Hirsch EC, Agid Y, et al. The substantia nigra of the human brain. II. Patterns of loss of dopamine-containing neurons in Parkinson’s disease. Brain. 1999;122:1437–1448. doi: 10.1093/brain/122.8.1437. [DOI] [PubMed] [Google Scholar]
- 4.Dexter DT, Wells FR, Lees AJ, et al. Increased nigral iron content and alterations in other metal ions occurring in brain in Parkinson’s disease. J Neurochem. 1989;52:1830–1836. doi: 10.1111/j.1471-4159.1989.tb07264.x. [DOI] [PubMed] [Google Scholar]
- 5.Dexter DT, Carayon A, Javoy-Agid F, et al. Alterations in the levels of iron, ferritin and other trace metals in Parkinson’s disease and other neurodegenerative diseases affecting the basal ganglia. Brain. 1991;114:1953–1975. doi: 10.1093/brain/114.4.1953. [DOI] [PubMed] [Google Scholar]
- 6.Graham JM, Paley MN, Grunewald RA, et al. Brain iron deposition in Parkinson’s disease imaged using the PRIME magnetic resonance sequence. Brain. 2000;123:2423–2431. doi: 10.1093/brain/123.12.2423. [DOI] [PubMed] [Google Scholar]
- 7.Zecca L, Youdim MB, Riederer P, et al. Iron, brain ageing and neurodegenerative disorders. Nat Rev Neurosci. 2004;5:863–873. doi: 10.1038/nrn1537. [DOI] [PubMed] [Google Scholar]
- 8.Martin WR, Wieler M, Gee M. Midbrain iron content in early Parkinson disease: a potential biomarker of disease status. Neurology. 2008;70:1411–1417. doi: 10.1212/01.wnl.0000286384.31050.b5. [DOI] [PubMed] [Google Scholar]
- 9.Oakley AE, Collingwood JF, Dobson J, et al. Individual dopaminergic neurons show raised iron levels in Parkinson disease. Neurology. 2007;68:1820–1825. doi: 10.1212/01.wnl.0000262033.01945.9a. [DOI] [PubMed] [Google Scholar]
- 10.Ward RJ, Zucca FA, Duyn JH, et al. The role of iron in brain ageing and neurodegenerative disorders. Lancet Neurol. 2014;13:1045–1060. doi: 10.1016/S1474-4422(14)70117-6. [DOI] [PMC free article] [PubMed] [Google Scholar]
- 11.Gorell JM, Ordidge RJ, Brown GG, et al. Increased iron-related MRI contrast in the substantia nigra in Parkinson’s disease. Neurology. 1995;45:1138–1143. doi: 10.1212/wnl.45.6.1138. [DOI] [PubMed] [Google Scholar]
- 12.Ulla M, Bonny JM, Ouchchane L, et al. Is R2* a new MRI biomarker for the progression of Parkinson’s disease? A longitudinal follow-up. PLoS One. 2013;8:e57904. doi: 10.1371/journal.pone.0057904. [DOI] [PMC free article] [PubMed] [Google Scholar]
- 13.Wieler M, Gee M, Martin WR. Longitudinal midbrain changes in early Parkinson’s disease: Iron content estimated from R*/MRI. Parkinsonism Relat Disord. 2015;21:179–183. doi: 10.1016/j.parkreldis.2014.11.017. [DOI] [PubMed] [Google Scholar]
- 14.Wang Y, Liu T. Quantitative susceptibility mapping (QSM): Decoding MRI data for a tissue magnetic biomarker. Magn Reson Med. 2014 doi: 10.1002/mrm.25358. [DOI] [PMC free article] [PubMed] [Google Scholar]
- 15.Liu T, Xu W, Spincemaille P, et al. Accuracy of the morphology enabled dipole inversion (MEDI) algorithm for quantitative susceptibility mapping in MRI. IEEE Trans Med Imaging. 2012;31:816–824. doi: 10.1109/TMI.2011.2182523. [DOI] [PMC free article] [PubMed] [Google Scholar]
- 16.Langkammer C, Liu T, Khalil M, et al. Quantitative susceptibility mapping in multiple sclerosis. Radiology. 2013;267:551–559. doi: 10.1148/radiol.12120707. [DOI] [PMC free article] [PubMed] [Google Scholar]
- 17.Lotfipour AK, Wharton S, Schwarz ST, et al. High resolution magnetic susceptibility mapping of the substantia nigra in Parkinson’s disease. J Magn Reson Imaging. 2012;35:48–55. doi: 10.1002/jmri.22752. [DOI] [PubMed] [Google Scholar]
- 18.Barbosa JH, Santos AC, Tumas V, et al. Quantifying brain iron deposition in patients with Parkinson’s disease using quantitative susceptibility mapping, R2 and R2*. Magn Reson Imaging. 2015;33:559–565. doi: 10.1016/j.mri.2015.02.021. [DOI] [PubMed] [Google Scholar]
- 19.Hughes AJ, Daniel SE, Kilford L, et al. Accuracy of clinical diagnosis of idiopathic Parkinson’s disease: a clinico-pathological study of 100 cases. J Neurol Neurosurg Psychiatry. 1992;55:181–184. doi: 10.1136/jnnp.55.3.181. [DOI] [PMC free article] [PubMed] [Google Scholar]
- 20.Tomlinson CL, Stowe R, Patel S, et al. Systematic review of levodopa dose equivalency reporting in Parkinson’s disease. Mov Disord. 2010;25:2649–2653. doi: 10.1002/mds.23429. [DOI] [PubMed] [Google Scholar]
- 21.Liu T, Wisnieff C, Lou M, et al. Nonlinear formulation of the magnetic field to source relationship for robust quantitative susceptibility mapping. Magn Reson Med. 2013;69:467–476. doi: 10.1002/mrm.24272. [DOI] [PubMed] [Google Scholar]
- 22.Raya JG, Dietrich O, Horng A, et al. T2 measurement in articular cartilage: impact of the fitting method on accuracy and precision at low SNR. Magn Reson Med. 2010;63:181–193. doi: 10.1002/mrm.22178. [DOI] [PubMed] [Google Scholar]
- 23.Van LK, Maes F, Vandermeulen D, et al. Automated model-based bias field correction of MR images of the brain. IEEE Trans Med Imaging. 1999;18:885–896. doi: 10.1109/42.811268. [DOI] [PubMed] [Google Scholar]
- 24.Avants BB, Epstein CL, Grossman M, et al. Symmetric diffeomorphic image registration with cross-correlation: evaluating automated labeling of elderly and neurodegenerative brain. Med Image Anal. 2008;12:26–41. doi: 10.1016/j.media.2007.06.004. [DOI] [PMC free article] [PubMed] [Google Scholar]
- 25.Friston KJ, Worsley KJ, Frackowiak RS, et al. Assessing the significance of focal activations using their spatial extent. Hum Brain Mapp. 1994;1:210–220. doi: 10.1002/hbm.460010306. [DOI] [PubMed] [Google Scholar]
- 26.Friston KJ, Holmes A, Poline JB, et al. Detecting activations in PET and fMRI: levels of inference and power. Neuroimage. 1996;4:223–235. doi: 10.1006/nimg.1996.0074. [DOI] [PubMed] [Google Scholar]
- 27.Massey LA, Yousry TA. Anatomy of the substantia nigra and subthalamic nucleus on MR imaging. Neuroimaging Clin North Am. 2010;20:7–27. doi: 10.1016/j.nic.2009.10.001. [DOI] [PubMed] [Google Scholar]
- 28.Crichton RR, Dexter DT, Ward RJ. Brain iron metabolism and its perturbation in neurological diseases. J Neural Transm. 2011;118:301–314. doi: 10.1007/s00702-010-0470-z. [DOI] [PubMed] [Google Scholar]
- 29.He X, Yablonskiy DA. Biophysical mechanisms of phase contrast in gradient echo MRI. Proc Natl Acad Sci U S A. 2009;106:13558–13563. doi: 10.1073/pnas.0904899106. [DOI] [PMC free article] [PubMed] [Google Scholar]
- 30.Haacke EM, Cheng NY, House MJ, et al. Imaging iron stores in the brain using magnetic resonance imaging. Magn Reson Imaging. 2005;23:1–25. doi: 10.1016/j.mri.2004.10.001. [DOI] [PubMed] [Google Scholar]
- 31.Peran P, Cherubini A, Assogna F, et al. Magnetic resonance imaging markers of Parkinson’s disease nigrostriatal signature. Brain. 2010;133:3423–3433. doi: 10.1093/brain/awq212. [DOI] [PubMed] [Google Scholar]
- 32.Du G, Lewis MM, Sen S, et al. Imaging nigral pathology and clinical progression in Parkinson’s disease. Mov Disord. 2012;27:1636–1643. doi: 10.1002/mds.25182. [DOI] [PMC free article] [PubMed] [Google Scholar]
- 33.Damier P, Hirsch EC, Agid Y, et al. The substantia nigra of the human brain. I. Nigrosomes and the nigral matrix, a compartmental organization based on calbindin D(28K) immunohistochemistry. Brain. 1999;122(Pt 8):1421–1436. doi: 10.1093/brain/122.8.1421. [DOI] [PubMed] [Google Scholar]
- 34.Harrison MB, Wylie SA, Frysinger RC, et al. UPDRS activity of daily living score as a marker of Parkinson’s disease progression. Mov Disord. 2009;24:224–230. doi: 10.1002/mds.22335. [DOI] [PMC free article] [PubMed] [Google Scholar]
- 35.Parashos SA, Luo S, Biglan KM, et al. Measuring disease progression in early Parkinson disease: the National Institutes of Health Exploratory Trials in Parkinson Disease (NET-PD) experience. JAMA Neurol. 2014;71:710–716. doi: 10.1001/jamaneurol.2014.391. [DOI] [PMC free article] [PubMed] [Google Scholar]
- 36.Gelman N, Gorell JM, Barker PB, et al. MR imaging of human brain at 3.0 T: preliminary report on transverse relaxation rates and relation to estimated iron content. Radiology. 1999;210:759–767. doi: 10.1148/radiology.210.3.r99fe41759. [DOI] [PubMed] [Google Scholar]
- 37.Baudrexel S, Nurnberger L, Rub U, et al. Quantitative mapping of T1 and T2* discloses nigral and brainstem pathology in early Parkinson’s disease. Neuroimage. 2010;51:512–520. doi: 10.1016/j.neuroimage.2010.03.005. [DOI] [PubMed] [Google Scholar]
- 38.Ofori E, Pasternak O, Planetta PJ, et al. Increased free water in the substantia nigra of Parkinson’s disease: a single-site and multi-site study. Neurobiol Aging. 2015;36:1097–1104. doi: 10.1016/j.neurobiolaging.2014.10.029. [DOI] [PMC free article] [PubMed] [Google Scholar]
Associated Data
This section collects any data citations, data availability statements, or supplementary materials included in this article.