Abstract
Objective
Pulmonary vascular dysfunction is associated with adverse prognosis in patients with the acute respiratory distress syndrome (ARDS), however the prognostic impact of pulmonary arterial compliance (CPA) in ARDS is not established.
Design, Setting, Patients
We performed a retrospective analysis of 363 subjects with ARDS who had complete baseline right heart catheterization data from the Fluid and Catheter Treatment Trial (FACTT) to test whether CPA at baseline and over the course of treatment predicted mortality.
Main Results
Baseline CPA (HR 1.18 per interquartile range [IQR] of 1/ CPA, 95% CI 1.02-1.37; p=0.03) as well as pulmonary vascular resistance (PVR) (HR 1.28 per IQR, 95% CI 1.07-1.53; p=0.006) both modestly predicted 60-day mortality. Baseline CPA remained predictive of mortality when PVR was in the normal range (p=0.02). Between day 0 and day 3, CPA increased in ARDS survivors and remained unchanged in non-survivors, while PVR did not change in either group. The resistance-compliance product (RC time) increased in survivors compared to non-survivors, suggesting improvements in RV load.
Conclusion
Baseline measures of CPA and PVR predict mortality in ARDS, and CPA remains predictive even when PVR is normal. CPA and RV load improve over time in ARDS survivors. Future studies should assess the impact of RV protective ARDS treatment on RV afterload and outcome.
Keywords: ARDS, pulmonary arterial compliance, pulmonary vascular resistance, pulmonary vascular disease
Background
The acute respiratory distress syndrome (ARDS) is associated with substantial morbidity and mortality (1-3), and refined risk stratification of ARDS patients is needed. ARDS-associated right heart failure has been associated with poor outcome in some (4, 5) but not all (6) studies. Markers of static right ventricular (RV) afterload such as pulmonary vascular resistance (PVR) may predict adverse outcome (7) but do not account for the pulsatile nature of blood flow and wave reflections that contribute to RV afterload. Pulmonary arterial compliance (CPA) is a major component of RV pulsatile load, which is related both to PVR and left heart filling pressures (8, 9) and may also better characterize RV load when PVR is in the normal range (8, 10). Lower CPA has been associated with mortality in both pulmonary arterial hypertension and left heart failure (9-12), but has not been studied in ARDS. Given a possible important role of fluid balance and cardiac filling pressure in mitigating outcome in ARDS (13-16), we hypothesized that CPA would predict mortality in patients with ARDS. We also sought to characterize the relationship of CPA and PVR in ARDS and to determine clinical factors associated with both CPA and PVR.
Methods
Patient population
The Fluid and Catheter Treatment Trial (FACTT) was conducted by the ARDS Network. The trial randomized 1000 subjects with ARDS in a 2x2 factorial design to placement of either central venous catheter or pulmonary artery catheter and to either a conservative or liberal fluid management strategy (15, 17). Patients were receiving low tidal volume mechanical ventilation and had a PaO2/FIO2 ratio less than 300 and bilateral infiltrates not referable to hydrostatic edema, which was assessed clinically (15, 17). Patients with myocardial infarction within the prior 30 days and severe chronic lung disease were excluded from trial enrollment.
We obtained the trial dataset via the NIH BioLINCC data repository (18). Five hundred thirteen patients were randomized to pulmonary artery catheter placement. Of these, 146 subjects were excluded due to lack of complete hemodynamic or clinical data (baseline systolic pulmonary artery pressure [SPAP], diastolic pulmonary artery pressure [DPAP], pulmonary artery wedge pressure [PAWP], cardiac index [CI], heart rate, height, and weight were required). In addition, 4 subjects were excluded because recorded hemodynamics generated a negative value for PVR. Therefore, 363 subjects with complete day 0 right heart catheterization data were included in this study. Cardiac filling pressures were measured with subjects supine at end-expiration based on ventilator pressure waveforms by study investigators (17). Cardiac output was measured by thermodilution (17). The study was approved by institutional review boards (IRB) at participating centers. The Johns Hopkins IRB approved this analysis for exempt status given that all datasets were anonymized at time of receipt.
Markers of pulmonary vascular function
PVR was calculated with the standard formula: (mean PA pressure [mPAP] - PAWP)/cardiac output (CO). CPA was calculated as stroke volume (SV) divided by PA pulse pressure (8). The RC time is the product of CPA and PVR. In survival analyses, compliance was represented as the inverse of compliance (1/CPA) so that the effect was directionally comparable to that of PVR.
Statistics
Baseline characteristics and hemodynamics were compared using Chi-square, Student's T test or Wilcoxon rank-sum as appropriate. Non-linear regression was performed to identify the best-fit hyperbolic curve for CPA as a function of PVR (the RC curve). Separate RC curves were constructed for those subjects with PAWP < 12 mmHg (lowest quartile of PAWP) and > 19 mmHg (highest quartile of PAWP). These curves were compared after log-log transformation with analysis of covariance (ANCOVA). The association of 1/CPA and PVR with death was investigated with Cox Proportional Hazard models. The proportional hazards assumption was met in all cases. Adjusted Cox models were then performed forcing in APACHE III score as a covariate. Receiver operator curves were constructed to compare the area under the curve for the association of PVR and 1/CPA with death and to determine the optimal cut-point for both PVR and 1/CPA using the method of Youden. Survival analysis was then performed using methods of Kaplan-Meier for 1/CPA and PVR at the identified optimal cut-point. Single linear regression was performed to determine associations of clinical variables with CPA and PVR. A two-tailed P value of less than 0.05 was considered statistically significant. All analyses were performed using StataSE version 14.
Results
Demographic, clinical and physiologic data are shown in Table 1. Compared with survivors, those who died were older, less likely to be Caucasian, had lower BSA, were more likely to be on vasopressors, and had higher APACHE III scores. Those who died had worse hemodynamic profiles including lower systemic blood pressures, higher heart rate and elevated markers of RV afterload (Table 2).
Table 1. Demographic, clinical and physiologic data, stratified by survival.
| Clinical factor | Overall (N=363) | Survived (N=261) | Died (N=102) | P |
|---|---|---|---|---|
| Age (years) | 48 (38-61) | 46 (37-58) | 52 (41-67) | 0.002 |
| Male gender | 190 (52%) | 133 (51%) | 57 (56%) | 0.4 |
| Caucasian race | 238 (66%) | 182 (70%) | 56 (55%) | 0.008 |
| Body-surface area (m2) | 1.9 (1.8-2.2) | 2.0 (1.8-2.2) | 1.9 (1.7-2.0) | 0.003 |
| Vasopressor use (%) | 118 (33%) | 73 (28%) | 45 (44%) | 0.003 |
| Cause of ARDS (primary) | ||||
| trauma | 27 (7%) | 21 (8%) | 6 (6%) | 0.5 |
| sepsis | 78 (21%) | 52 (20%) | 26 (25%) | 0.2 |
| aspiration | 52 (14%) | 41 (16%) | 11 (11%) | 0.2 |
| pneumonia | 182 (50%) | 129 (49%) | 53 (52%) | 0.7 |
| other (ie, pancreatitis, fat embolism syndrome, near drowning, idiopathic) | 21 (6%) | 16 (6%) | 5 (5%) | 0.7 |
| APACHE III score | 93 (70-115) | 86 (64-106) | 109 (91-131) | 0.00001 |
| Tidal volume (mL) | 450 (400-520) | 450 (390-514) | 450 (400-544) | 0.4 |
| PEEP (cm H2O) | 10 (5-12) | 10 (5-12) | 8 (5-12) | 0.9 |
| Plateau pressure (cm H2O) | 26 (22-30) | 26 (22-30) | 27 (22-31) | 0.4 |
| Driving pressure (cmH2O) | 16 (13-20) | 16 (13-20) | 17 (13-23) | 0.3 |
| Peak pressure (cm H2O) | 32 (27-38) | 32 (26-37) | 33 (27-39) | 0.3 |
| Fraction of inspired oxygen | 0.6 (0.5-0.8) | 0.6 (0.5-0.8) | 0.6 (0.5-0.8) | 0.3 |
| Arterial pH | 7.37 (7.3-7.43) | 7.37 (7.31-7.43) | 7.37 (7.28-7.42) | 0.3 |
| Arterial pCO2 | 39 (34-45) | 40 (34-45) | 39 (33-44) | 0.4 |
| A-a gradient | 287 (200-411) | 281 (191-406) | 319 (210-434) | 0.2 |
| PaO2/fIO2 ratio | 146 (100-200) | 148 (102-200) | 138 (88-202) | 0.3 |
| Arterial pO2 | 82 (68-103) | 82 (68-103) | 78 (66-104) | 0.4 |
Data shown as median (IQR) or N(%). ARDS: acute respiratory distress syndrome; APACHE: acute physiology and chronic health evaluation; PEEP: positive end-expiratory pressure; A-a: alveolar-arterial
Table 2. Hemodynamic data, stratified by survival.
| Clinical factor | Overall (N=363) | Survived (N=261) | Died (N=102) | P |
|---|---|---|---|---|
| Systolic blood pressure (mmHg) | 111 (97-129) | 112 (100-130) | 104 (94-117) | 0.001 |
| Diastolic blood pressure (mmHg) | 59 (51-69) | 60 (52-69) | 55 (48-64) | 0.002 |
| Mean arterial pressure (mmHg) | 76 (67-87) | 79 (68-89) | 71 (64-82) | 0.0002 |
| Heart rate (beats per minute) | 100 (85-117) | 98 (84-115) | 106 (92-121) | 0.02 |
| Cardiac index (L/min/m2) | 4.0 (3.2-5.1) | 4.0 (3.3-5.1) | 4.0 (3.0-5.0) | 0.6 |
| Stroke volume (mL) | 80 (60-102) | 83 (65-105) | 72 (54-100) | 0.007 |
| Right atrial pressure (mmHg) | 13 (9-16) | 13 (10-17) | 12 (8-14) | 0.0007 |
| PA systolic pressure (mmHg) | 42 (36-50) | 42 (36-49) | 44 (36-51) | 0.4 |
| PA diastolic pressure (mmHg) | 22 (18-27) | 22 (18-27) | 22 (18-27) | 0.5 |
| PA mean pressure (mmHg) | 29 (24-35) | 29 (24-35) | 29 (24-35) | 0.9 |
| Pulmonary artery wedge pressure (mmHg) | 16 (12-19) | 16 (12-20) | 15 (11-18) | 0.02 |
| Pulmonary vascular resistance (WU) | 1.6 (1.1-2.5) | 1.5 (1.0-2.4) | 1.8 (1.1-3.0) | 0.02 |
| Pulmonary arterial compliance (mL/mmHg) | 4.0 (3.0-5.6) | 4.2 (3.2-6.0) | 3.5 (2.6-5.3) | 0.002 |
| RC time (s) | 0.41 (0.29-0.53) | 0.41 (0.30-0.52) | 0.40 (0.28-0.54) | 0.8 |
| Fluid balance (24 hours prior, mL) | 196 (-16-498) | 149 (-45-383) | 296 (65-628) | 0.0007 |
| Temperature | 37.5 (36.8-38.2) | 37.6 (36.9-38.2) | 37.4 (36.4-38.1) | 0.05 |
Data shown as median (IQR) or N(%). PA: pulmonary artery; RC: resistance-compliance
Demographic and clinical factors associated with CPA and PVR are summarized in Supplemental E-table 1. Clinical factors associated with both CPA and PVR included age, heart rate, BSA, and A-a gradient (p<0.05 for all). Lower body temperature (β -0.13, SE 0.06, p=0.01) and higher ventilator driving pressure (β 0.14, SE 0.01, p=0.02) were associated with higher PVR but neither factor was associated with CPA. Lower arterial pH (β 0.11, SE 0.14, p=0.04) was associated with lower CPA but not associated with PVR. Positive fluid balance (β -0.13, SE 0.0009, p=0.01) was associated with lower CPA but not associated with PVR.
As expected, PVR and CPA were related in an inverse hyperbolic manner (Figure 1, panel A). Elevated left heart filling pressure resulted in a downward shift of the RC curve consistent with lower CPA at a given PVR, as shown in Figure 1, panel B (P < 0.0001 for comparison of curves after log-log transformation). Although higher PAWP lowered CPA at a given PVR, higher PAWP on day 0 was associated with a reduced risk of death (HR 0.96 per mmHg: 95% CI 0.93-1.0; P = 0.03).
Figure 1.
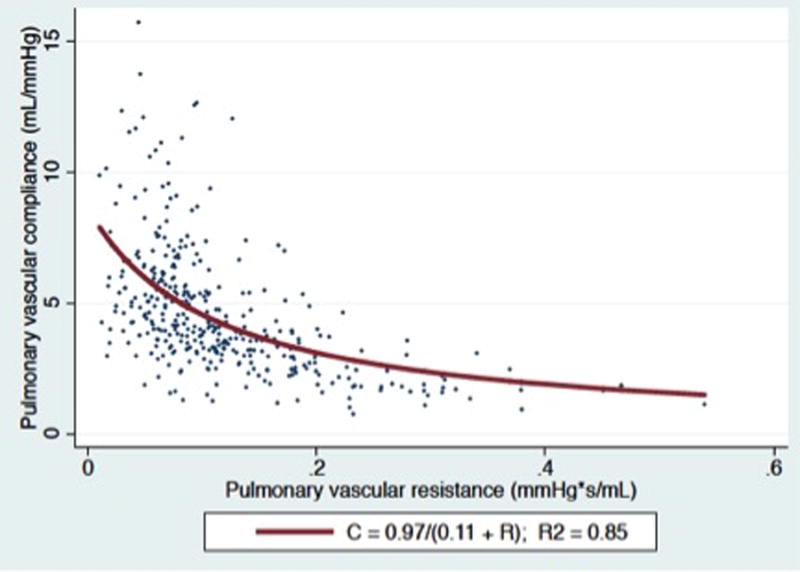
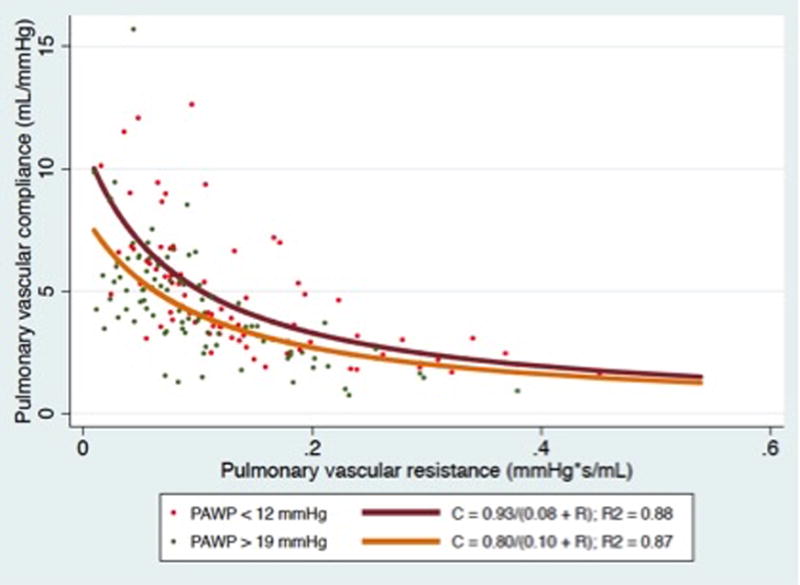
Panel A) CPA plotted as a function of PVR for the entire cohort. Panel B): CPA as a function of PVR stratified by PAWP. (P < 0.0001 for comparison of curves after log-log transformation).
Baseline CPA and PVR were modestly associated with death in univariate models (HR 2.84 [95% CI 1.12-7.17 per unit] and 1.18 [95% CI 1.02-1.37 per IQR increase] for CPA, p = 0.03; HR 1.20 [95%CI 1.06-1.36 per unit] and 1.28 [95% CI 1.07-1.53 IQR increase] for PVR, p =0.006). After adjusting for APACHE III score, PVR remained a significant predictor of mortality (HR 1.26, 95% CI 1.05-1.5, p=0.01) while only a trend remained for CPA (HR 1.15, 95% CI 0.99-1.34, p=0.07). These findings were not mediated solely by cardiac output nor stroke volume- in univariate analyses, neither cardiac output (HR 0.91 per IQR increase, 95% CI 0.70-1.18, p=0.5) nor stroke volume (HR 0.78 per increase in IQR, 95% CI 0.60-1.02, p=0.07) was associated with mortality. The borderline association of mortality with stroke volume attenuated when adjusting for APACHE score (HR 0.88 per increase in IQR, 95% CI 0.68-1.14, p=0.3).
The area under the ROC curve for 1/CPA to predict 60-day death was 0.60 compared to 0.58 for PVR (P =0.4). The optimal cut-point to predict death for 1/CPA was 0.30 mmHg/mL (3.33 mmHg/mL for CPA), which was 47% sensitive and 73% specific. The optimal cut-point to predict death for PVR was 1.91 WU, which was 46% sensitive and 68% specific. Figure 2 demonstrates Kaplan-Meier curves for PVR and 1/CPA dichotomized at these cut-points. In an analysis of the subset of the cohort with baseline PVR less than 3 WU (N=301 of 363), 1/CPA greater than the predetermined optimal cut point remained associated with mortality (P = 0.02; e-Figure), although PVR did not (P = 0.2). In the PVR <3 WU cohort, subjects with lower CPA had lower stroke volume and lower cardiac index but similar PAWP (supplemental e-table 2) than those with higher CPA.
Figure 2.
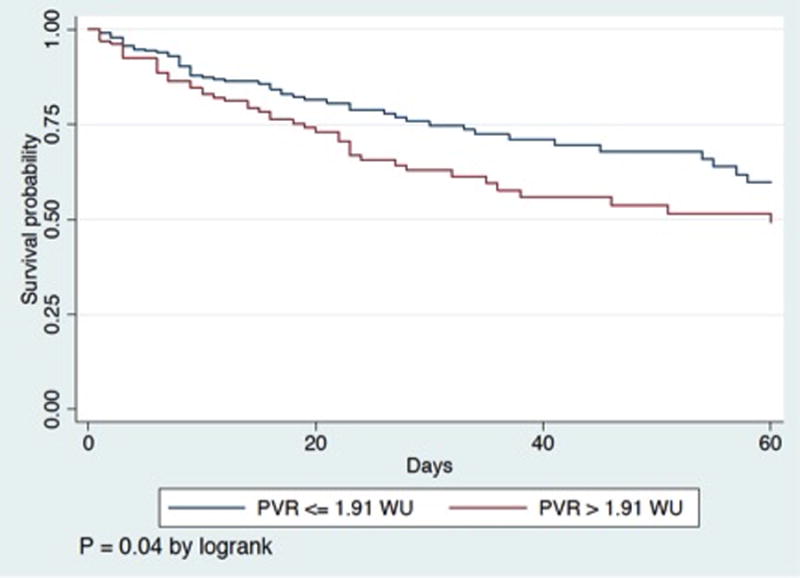
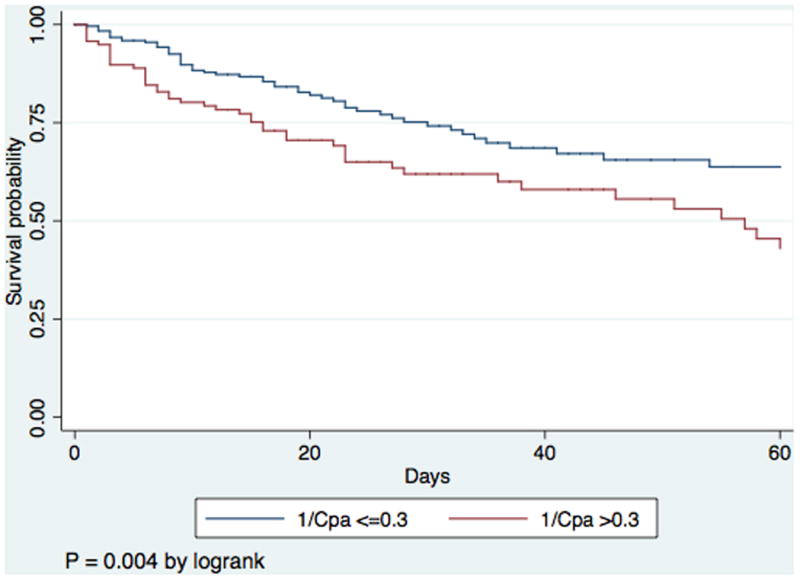
Panel A) Kaplan-Meier survival curve for initial pulmonary vascular resistance (PVR) dichotomized by optimal cutpoint. Panel B) Kaplan-Meier survival curve for initial 1/CPA dichotomized by optimal cutpoint
Figure 3 panels A and B display the trends in mean PVR and CPA over the first 4 complete trial days (days 0, 1, 2, and 3) for subjects with available data. At trial enrollment, subjects who ultimately died had lower baseline CPA, and CPA did not change over the first 4 trial days (P = 0.9). Subjects who ultimately lived had higher baseline CPA and CPA increased over the first 4 trial days (P = 0.02), and an increasing CPA was therefore associated with a lower likelihood of death (HR 0.58, 95% CI 0.37-0.91; P = 0.02) Subjects who ultimately died had higher baseline PVR, which did not change over the first 4 trial days (P=0.6). Consequently, the RC time increased in survivors (P=0.02) yet remained unchanged in non-survivors, suggesting that survivors had less RV pulsatile load for a given PVR. Survivors also demonstrated decreasing heart rate, increasing stroke volume, and lower right atrial pressure, pulmonary artery pressure, and PAWP between day 0 and day 3 (supplemental E Table 3). The median cumulative fluid balance in survivors was positive 1.2 L (IQR -2.4 – +5.7 L) versus positive 5.6 L (IQR +1.8 - + 11.6 L) in non-survivors (P = 0.0001). There were no differences in assignment to a conservative fluid management strategy between the survivors and non-survivors (48% v. 43%, P = 0.5).
Figure 3.
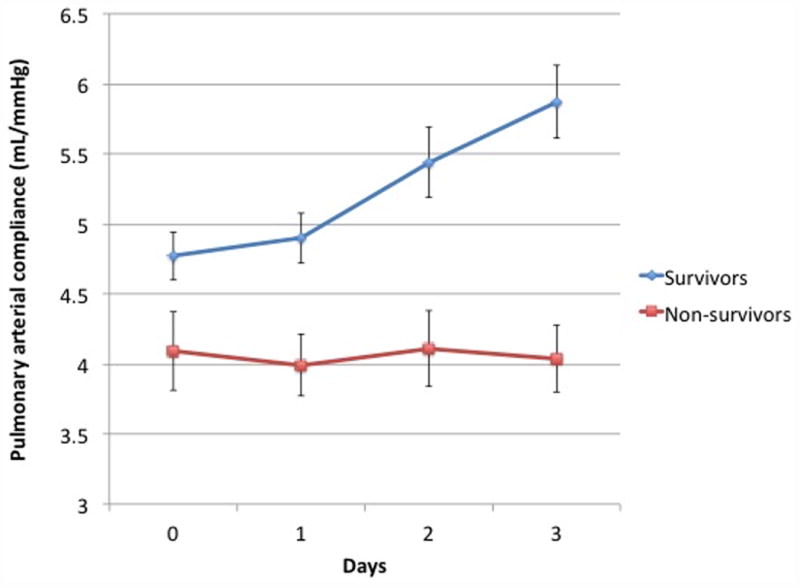
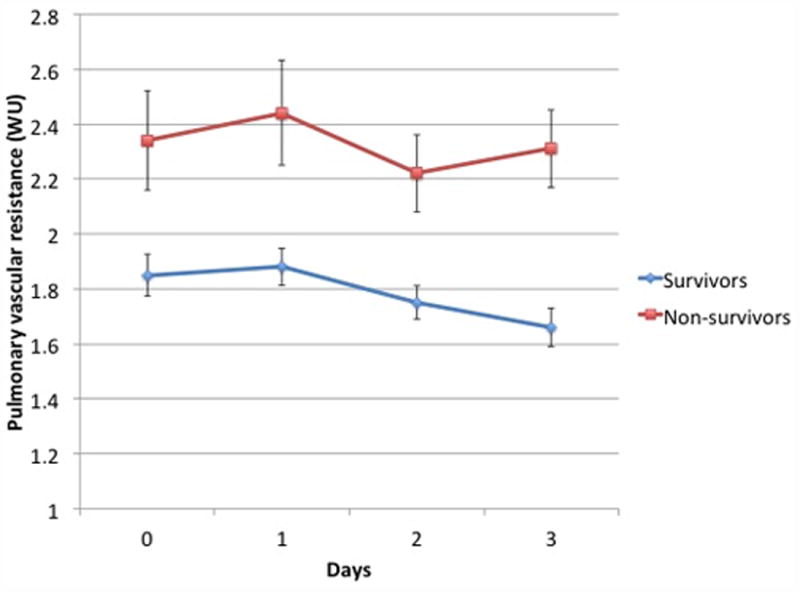
Panel A) Mean CPA on each of the first 4 trial days for subjects with available data at all 4 points who survived (N=209) versus those who died (N=71). CPA did not change over time for non-survivors (P = 0.9 for trend) whereas it increased over time in survivors (P = 0.02 for trend).Panel B) Mean PVR on each of the first 4 trial days for subjects with available data at all 4 points who survived (N=194) versus those who died (N=68). PVR did not change in survivors (P = 0.1 for trend) or non-survivors (P = 0.6 for trend).
Discussion
Major Findings
In this analysis of a modern ARDS cohort from FACTT, CPA- a marker of pulsatile RV afterload- and PVR- a marker of static RV afterload- are both modestly associated with 60-day all-cause mortality, and CPA remains predictive even when PVR is in the normal range. CPA and PVR are related in an inverse hyperbolic fashion, consistent with other disease states. The pulmonary vascular RC curve in ARDS is sensitive to left heart filling pressure, and elevated PAWP lowers compliance independent of resistance which is anticipated and consistent with observations in other disease states. Finally, we demonstrate that CPA increases over time in patients who survive their ARDS while remaining constant in non-survivors.
RC relationship in ARDS
We demonstrate for the first time in mechanically ventilated ARDS patients, that CPA and PVR follow an inverse hyperbolic relationship. Pulmonary hypertension associated with respiratory failure was first described by Zapol and Snider (19), and since then the dependence of CPA on PVR has been suggested in a number of studies including those with normal subjects (20), known or suspected pulmonary hypertension (8, 20, 21), and interstitial lung disease (8). This concept was perhaps best illustrated by Newman and colleagues who administered inhaled nitric oxide to subjects with vasoreactive PAH (22), demonstrating with falling PVR, CPA increased in a predictable fashion, with little impact on the RC time. A consequence of this RC relationship is that in order to reduce pulsatile RV load, PVR must be lowered to the steep portion of the RC curve (e.g. 1-3 WU). Small changes in PVR could dramatically impact CPA, potentially making CPA a better discriminator of RV load and survival in this range of PVR.
CPA in ARDS
Baseline CPA was associated with 60-day mortality in ARDS although it was not a clearly superior prognostic marker compared to PVR. PVR has been previously shown to predict mortality in the FACTT cohort by Bull and colleagues using different methodology (7). The association of CPA with mortality attenuated when adjusted for APACHE score, whereas the association of PVR did not. Our finding that CPA was associated not only with fluid balance, but also with acidosis, hypoxia, and tachycardia (variables included in APACHE) suggests that either CPA is more affected by variables associated with illness severity than PVR or that lower compliance itself impacts illness severity. Higher PAWP predictably decreased CPA at a given resistance. In this cohort, lower day 0 PAWP was associated with mortality. This “protective” association of higher PAWP could be a marker of more severe systemic vasodilatation, third spacing and hence more severe hemodynamic compromise among those with low PAWP. This relationship contrasts with left heart failure where elevation in PAWP (and lower compliance) is pathogenic. This could explain why baseline CPA was not clearly superior to PVR in predicting mortality as factors other than RV load impacted outcome.
Compliance was predictive of mortality in subjects with PVR < 3WU whereas PVR was not. Pellegrini also found CPA remained associated with mortality even when PVR was in the normal range in a cohort of left heart failure patients (10). Our results also follow from studies that have demonstrated the prognostic utility of estimated pulmonary arterial compliance in other disease states such as heart failure and primary pulmonary hypertension (9, 11, 12, 23). There were no differences in baseline PAWP between survivors and non-survivors in the PVR < 3WU cohort despite differences in CPA. Because left heart pressures impacted baseline compliance less in our cohort, these findings may speak more to the impact of small changes in PVR on compliance and total RV load (i.e. steepness of the RC curve).
We also found an increase in CPA during the study time course was associated with survival although PVR did not change dramatically in this group. The change in CPA was mediated at least in part by reduction in PAWP and less positive fluid balance. In a recent analysis from the FACTT data set, it was noted that among patients with lower filling pressures at baseline, a fluid conservative strategy was associated with benefit (13). Other studies in ARDS and critical illness have supported these findings as well (13, 24, 25). Avoiding positive fluid balance, when possible, should result in higher CPAdyn and reduce pulsatile RV afterload.
Therapeutic implications
Our findings represent associations of PVR and CPA with outcome, and it cannot be presumed that pulmonary vascular dysfunction causes increased mortality directly in this setting. Nonetheless, these associations should contribute to hypotheses regarding therapeutic implications of targeting pulmonary vascular dysfunction in ARDS. Although total RV load in the setting of a normal PVR likely remains modest, even when CPA is depressed, recent work has demonstrated that even borderline elevations in load may impact mortality (26). Modifying RV load therapeutically in ARDS has not been well studied. Trials assessing inhaled nitric oxide (iNO) in ARDS have shown no improvement in outcome (27, 28) at a median dose across trials of 10 ppm. However, there is heterogeneity in both the oxygenation response and the hemodynamic response to iNO in ARDS, both between patients and over time within the same patient (29), and patients who respond to iNO have lower treatment-related PVR than non-responders (30). The impact of pulmonary vasodilators on right heart hemodynamics and the subsequent impact on outcome needs additional study.
An “RV protective” approach to mechanical ventilation in ARDS has been proposed (31-34) which incorporates limiting plateau pressure, avoiding respiratory acidosis, and titrating ventilator parameters to an endpoint of adequate RV function assessed with echocardiography. While the clinical effect of this approach on RV afterload has not been demonstrated prospectively, our results confirm that these components of RV protection- including ventilator driving pressure and acidosis- are indeed associated with PVR and CPA, and that fluid balance also plays an important role. Our results suggest that optimization of heart rate in patients with arrhythmia, avoidance of hypothermia (suggested by our study and others to increase pulmonary vascular resistance (35)), and avoiding positive fluid balance should be assessed in future studies of RV protection in ARDS. Our findings could contribute to the design of an RV protective approach to mechanical ventilation that should be evaluated prospectively. Although right heart catheterization use in ARDS is declining (36), hemodynamics including CPA can be estimated by echocardiography (37) and echo-estimated CPA is prognostic in PAH (11). Longitudinal tracking of CPA with echocardiography is an attractive strategy in ARDS, and should be investigated in prospective trials.
Limitations
This is a retrospective, observational study, and, thus, our findings are hypothesis generating and represent associations only. As such, causality cannot be inferred from relationships reported in this study. For example, it is not possible to determine if changes in CPA promote worsening hemodynamics, RV function and survival, or is simply a marker of illness severity. The specific cause of death was not available for this cohort, and, therefore, it was not possible to determine if patients died of RV failure or other causes. Few patients in our cohort were treated with prone positioning which has been demonstrated to have beneficial hemodynamic effects (38) This analysis is a hemodynamic analysis, whereas much of the literature defining the relationship between ARDS, outcome, and cor pulmonale relies on echocardiography findings (5, 31, 33, 34). Future studies should assess the echocardiographic correlates of CPA and PVR in ARDS enabling non-invasive assessment in ARDS. An additional limitation is that SV/PP represents a lumped simplification for compliance and some of this theory has recently been debated (39). Other parameters such as pulmonary artery elastance are also important lumped parameters of RV afterload, although they too have limitations and how to best estimate pulmonary artery elastance remains controversial (40). Hemodynamic measurements were made by study investigators at the bedside after formal hemodynamic assessment training. Although interpretation of hemodynamics may be variable among examiners even with training, we believe this likely represents a best case scenario for clinical practice. Even with variability, the changes in compliance and association with outcome were statistically significant, and measurement error likely would bias toward the null. Finally, we necessarily restricted our analysis to only those FACTT subjects with a complete hemodynamic data set at trial enrollment and prior to protocol mandated fluid management. Although it would be prudent to validate these findings in future cohorts, with declining use of the pulmonary artery catheter in ARDS, this will be challenging (36).
In conclusion, we demonstrate an inverse hyperbolic relationship between CPA and PVR in a cohort of patients with ARDS, which is modified by left heart filling pressure. Baseline CPA and PVR both predict mortality, and CPA predicts mortality even when PVR is normal. Improvement in CPA over time is associated with survival. Patient factors including age and heart rate and disease specific clinical factors such as fluid balance and ventilator driving pressure are associated with aspects of right ventricular afterload. Future studies should assess the value of non-invasive assessment of CPA in ARDS as well as the impact of RV protective ARDS treatment on RV afterload and outcome.
Supplementary Material
Acknowledgments
Copyright form disclosures: Dr. Metkus received funding from the NHLBI, T32 salary support. He received support for article research from the National Institutes of Health (NIH). Dr. Mathai disclosed: he has served as a consultant for Actelion, Bayer, and Gilead Sciences. Dr. Maron received funding from Gilead Sciences Inc. He received support for article research from the NIH, the American Heart Association, and the Cardiovascular Medical Research and Education Foundation. Dr. Hassoun received funding from Gilead (part of the Scientific Advisory Board, unrelated to the current work). Dr. Tedford received support for article research from the NIH. The remaining authors have disclosed that they do not have any potential conflicts of interest.
Dr. Maron received grant funding from Gilead Sciences. Dr. Mathai received consulting fees from Actelion, Bayer Healthcare and Gilead. Dr. Hassoun serves on the Scientific Advisory Board of Gilead. Dr. Metkus received unrestricted research funds from Abbott Diagnostics to support an investigator-initiated study, received consulting fees from BestDoctors, Inc and Oakstone-EBIX CME unrelated to the current work and is eligible for publishing royalties from McGraw-Hill publishing, unrelated to the current work.
Funding Sources: This study was supported by the NIH - NHLBI (1K08HL11207-01A1, L30 HL110304, T32-HL007227-40), the American Heart Association (AHA 15GRNT25080016), Pulmonary Hypertension Association, Cardiovascular Medical Research and Education Fund (CMREF), and Klarman Foundation at Brigham and Women's Hospital.
Footnotes
Author contributions: TM and RJT had full access to all of the data in the study and take responsibility for the integrity of the data and the accuracy of the data analysis. ET, CM, BAH, TMK, SCM, RD, PMH, BAM and RGB contributed substantially to the study design, data analysis and interpretation, and the writing of the manuscript including critical revision.
References
- 1.Ware LB, Matthay MA. The acute respiratory distress syndrome. The New England journal of medicine. 2000;342(18):1334–1349. doi: 10.1056/NEJM200005043421806. [DOI] [PubMed] [Google Scholar]
- 2.Maybauer MO, Maybauer DM, Herndon DN. Incidence and outcomes of acute lung injury. The New England journal of medicine. 2006;354(4):416–417. author reply 416-417. [PubMed] [Google Scholar]
- 3.Sweatt AJ, Levitt JE. Evolving epidemiology and definitions of the acute respiratory distress syndrome and early acute lung injury. Clinics in chest medicine. 2014;35(4):609–624. doi: 10.1016/j.ccm.2014.08.002. [DOI] [PubMed] [Google Scholar]
- 4.Boissier F, Katsahian S, Razazi K, et al. Prevalence and prognosis of cor pulmonale during protective ventilation for acute respiratory distress syndrome. Intensive care medicine. 2013;39(10):1725–1733. doi: 10.1007/s00134-013-2941-9. [DOI] [PubMed] [Google Scholar]
- 5.Mekontso Dessap A, Boissier F, Charron C, et al. Acute cor pulmonale during protective ventilation for acute respiratory distress syndrome: prevalence, predictors, and clinical impact. Intensive care medicine. 2015 doi: 10.1007/s00134-015-4141-2. [DOI] [PubMed] [Google Scholar]
- 6.Ryan D, Frohlich S, McLoughlin P. Pulmonary vascular dysfunction in ARDS. Annals of intensive care. 2014;4:28. doi: 10.1186/s13613-014-0028-6. [DOI] [PMC free article] [PubMed] [Google Scholar]
- 7.Bull TM, Clark B, McFann K, et al. Pulmonary vascular dysfunction is associated with poor outcomes in patients with acute lung injury. American journal of respiratory and critical care medicine. 2010;182(9):1123–1128. doi: 10.1164/rccm.201002-0250OC. [DOI] [PMC free article] [PubMed] [Google Scholar]
- 8.Tedford RJ, Hassoun PM, Mathai SC, et al. Pulmonary capillary wedge pressure augments right ventricular pulsatile loading. Circulation. 2012;125(2):289–297. doi: 10.1161/CIRCULATIONAHA.111.051540. [DOI] [PMC free article] [PubMed] [Google Scholar]
- 9.Dupont M, Mullens W, Skouri HN, et al. Prognostic role of pulmonary arterial capacitance in advanced heart failure. Circulation Heart failure. 2012;5(6):778–785. doi: 10.1161/CIRCHEARTFAILURE.112.968511. [DOI] [PMC free article] [PubMed] [Google Scholar]
- 10.Pellegrini P, Rossi A, Pasotti M, et al. Prognostic relevance of pulmonary arterial compliance in patients with chronic heart failure. Chest. 2014;145(5):1064–1070. doi: 10.1378/chest.13-1510. [DOI] [PubMed] [Google Scholar]
- 11.Mahapatra S, Nishimura RA, Oh JK, et al. The prognostic value of pulmonary vascular capacitance determined by Doppler echocardiography in patients with pulmonary arterial hypertension. Journal of the American Society of Echocardiography : official publication of the American Society of Echocardiography. 2006;19(8):1045–1050. doi: 10.1016/j.echo.2006.03.008. [DOI] [PubMed] [Google Scholar]
- 12.Al-Naamani N, Preston IR, Paulus JK, et al. Pulmonary Arterial Capacitance Is an Important Predictor of Mortality in Heart Failure With a Preserved Ejection Fraction. JACC Heart failure. 2015;3(6):467–474. doi: 10.1016/j.jchf.2015.01.013. [DOI] [PMC free article] [PubMed] [Google Scholar]
- 13.Semler MW, Wheeler AP, Thompson BT, et al. Impact of Initial Central Venous Pressure on Outcomes of Conservative Versus Liberal Fluid Management in Acute Respiratory Distress Syndrome. Critical care medicine. 2016 doi: 10.1097/CCM.0000000000001555. [DOI] [PMC free article] [PubMed] [Google Scholar]
- 14.Neamu RF, Martin GS. Fluid management in acute respiratory distress syndrome. Current opinion in critical care. 2013;19(1):24–30. doi: 10.1097/MCC.0b013e32835c285b. [DOI] [PubMed] [Google Scholar]
- 15.National Heart L, Blood Institute Acute Respiratory Distress Syndrome Clinical Trials, N. Wiedemann HP, et al. Comparison of two fluid-management strategies in acute lung injury. The New England journal of medicine. 2006;354(24):2564–2575. doi: 10.1056/NEJMoa062200. [DOI] [PubMed] [Google Scholar]
- 16.Sakr Y, Vincent JL, Reinhart K, et al. High tidal volume and positive fluid balance are associated with worse outcome in acute lung injury. Chest. 2005;128(5):3098–3108. doi: 10.1378/chest.128.5.3098. [DOI] [PubMed] [Google Scholar]
- 17.National Heart L, Blood Institute Acute Respiratory Distress Syndrome Clinical Trials N. Wheeler AP, et al. Pulmonary-artery versus central venous catheter to guide treatment of acute lung injury. The New England journal of medicine. 2006;354(21):2213–2224. doi: 10.1056/NEJMoa061895. [DOI] [PubMed] [Google Scholar]
- 18.Giffen CA, Carroll LE, Adams JT, et al. Providing Contemporary Access to Historical Biospecimen Collections: Development of the NHLBI Biologic Specimen and Data Repository Information Coordinating Center (BioLINCC) Biopreservation and biobanking. 2015;13(4):271–279. doi: 10.1089/bio.2014.0050. [DOI] [PMC free article] [PubMed] [Google Scholar]
- 19.Zapol WM, Snider MT. Pulmonary hypertension in severe acute respiratory failure. The New England journal of medicine. 1977;296(9):476–480. doi: 10.1056/NEJM197703032960903. [DOI] [PubMed] [Google Scholar]
- 20.Hadinnapola C, Li Q, Su L, et al. The resistance-compliance product of the pulmonary circulation varies in health and pulmonary vascular disease. Physiological reports. 2015;3(4) doi: 10.14814/phy2.12363. [DOI] [PMC free article] [PubMed] [Google Scholar]
- 21.Tedford RJ, Mudd JO, Girgis RE, et al. Right ventricular dysfunction in systemic sclerosis-associated pulmonary arterial hypertension. Circulation Heart failure. 2013;6(5):953–963. doi: 10.1161/CIRCHEARTFAILURE.112.000008. [DOI] [PMC free article] [PubMed] [Google Scholar]
- 22.Newman JH, Brittain EL, Robbins IM, et al. Effect of acute arteriolar vasodilation on capacitance and resistance in pulmonary arterial hypertension. Chest. 2015;147(4):1080–1085. doi: 10.1378/chest.14-1461. [DOI] [PMC free article] [PubMed] [Google Scholar]
- 23.Mahapatra S, Nishimura RA, Sorajja P, et al. Relationship of pulmonary arterial capacitance and mortality in idiopathic pulmonary arterial hypertension. J Am Coll Cardiol. 2006;47(4):799–803. doi: 10.1016/j.jacc.2005.09.054. [DOI] [PubMed] [Google Scholar]
- 24.Rosenberg AL, Dechert RE, Park PK, et al. Review of a large clinical series: association of cumulative fluid balance on outcome in acute lung injury: a retrospective review of the ARDSnet tidal volume study cohort. Journal of intensive care medicine. 2009;24(1):35–46. doi: 10.1177/0885066608329850. [DOI] [PubMed] [Google Scholar]
- 25.Malbrain ML, Marik PE, Witters I, et al. Fluid overload, de-resuscitation, and outcomes in critically ill or injured patients: a systematic review with suggestions for clinical practice. Anaesthesiology intensive therapy. 2014;46(5):361–380. doi: 10.5603/AIT.2014.0060. [DOI] [PubMed] [Google Scholar]
- 26.Maron BA, Hess E, Maddox TM, et al. Association of Borderline Pulmonary Hypertension With Mortality and Hospitalization in a Large Patient Cohort: Insights From the Veterans Affairs Clinical Assessment, Reporting, and Tracking Program. Circulation. 2016;133(13):1240–1248. doi: 10.1161/CIRCULATIONAHA.115.020207. [DOI] [PMC free article] [PubMed] [Google Scholar]
- 27.Adhikari NK, Burns KE, Friedrich JO, et al. Effect of nitric oxide on oxygenation and mortality in acute lung injury: systematic review and meta-analysis. Bmj. 2007;334(7597):779. doi: 10.1136/bmj.39139.716794.55. [DOI] [PMC free article] [PubMed] [Google Scholar]
- 28.Afshari A, Brok J, Moller AM, et al. Inhaled nitric oxide for acute respiratory distress syndrome (ARDS) and acute lung injury in children and adults. The Cochrane database of systematic reviews. 2010;(7):CD002787. doi: 10.1002/14651858.CD002787.pub2. [DOI] [PubMed] [Google Scholar]
- 29.Gerlach H, Keh D, Semmerow A, et al. Dose-response characteristics during long-term inhalation of nitric oxide in patients with severe acute respiratory distress syndrome: a prospective, randomized, controlled study. American journal of respiratory and critical care medicine. 2003;167(7):1008–1015. doi: 10.1164/rccm.2108121. [DOI] [PubMed] [Google Scholar]
- 30.Benzing A, Mols G, Guttmann J, et al. Effect of different doses of inhaled nitric oxide on pulmonary capillary pressure and on longitudinal distribution of pulmonary vascular resistance in ARDS. British journal of anaesthesia. 1998;80(4):440–446. doi: 10.1093/bja/80.4.440. [DOI] [PubMed] [Google Scholar]
- 31.Repesse X, Charron C, Vieillard-Baron A. Acute cor pulmonale in ARDS: rationale for protecting the right ventricle. Chest. 2015;147(1):259–265. doi: 10.1378/chest.14-0877. [DOI] [PubMed] [Google Scholar]
- 32.Repesse X, Charron C, Vieillard-Baron A. Acute respiratory distress syndrome: the heart side of the moon. Current opinion in critical care. 2015 doi: 10.1097/MCC.0000000000000267. [DOI] [PubMed] [Google Scholar]
- 33.Vieillard-Baron A, Price LC, Matthay MA. Acute cor pulmonale in ARDS. Intensive care medicine. 2013;39(10):1836–1838. doi: 10.1007/s00134-013-3045-2. [DOI] [PMC free article] [PubMed] [Google Scholar]
- 34.Vieillard-Baron A, Matthay M, Teboul JL, et al. Experts' opinion on management of hemodynamics in ARDS patients: focus on the effects of mechanical ventilation. Intensive care medicine. 2016 doi: 10.1007/s00134-016-4326-3. [DOI] [PubMed] [Google Scholar]
- 35.Bro-Jeppesen J, Hassager C, Wanscher M, et al. Targeted temperature management at 33 degrees C versus 36 degrees C and impact on systemic vascular resistance and myocardial function after out-of-hospital cardiac arrest: a sub-study of the Target Temperature Management Trial. Circulation Cardiovascular interventions. 2014;7(5):663–672. doi: 10.1161/CIRCINTERVENTIONS.114.001556. [DOI] [PubMed] [Google Scholar]
- 36.Wiener RS, Welch HG. Trends in the use of the pulmonary artery catheter in the United States, 1993-2004. Jama. 2007;298(4):423–429. doi: 10.1001/jama.298.4.423. [DOI] [PubMed] [Google Scholar]
- 37.Friedberg MK, Feinstein JA, Rosenthal DN. Noninvasive assessment of pulmonary arterial capacitance by echocardiography. Journal of the American Society of Echocardiography : official publication of the American Society of Echocardiography. 2007;20(2):186–190. doi: 10.1016/j.echo.2006.08.009. [DOI] [PubMed] [Google Scholar]
- 38.Jozwiak M, Teboul JL, Anguel N, et al. Beneficial hemodynamic effects of prone positioning in patients with acute respiratory distress syndrome. American journal of respiratory and critical care medicine. 2013;188(12):1428–1433. doi: 10.1164/rccm.201303-0593OC. [DOI] [PubMed] [Google Scholar]
- 39.Chemla D, Lau EM, Papelier Y, et al. Pulmonary vascular resistance and compliance relationship in pulmonary hypertension. The European respiratory journal. 2015 doi: 10.1183/13993003.00741-2015. [DOI] [PubMed] [Google Scholar]
- 40.Tedford RJ. Determinants of right ventricular afterload (2013 Grover Conference series) Pulmonary circulation. 2014;4(2):211–219. doi: 10.1086/676020. [DOI] [PMC free article] [PubMed] [Google Scholar]
Associated Data
This section collects any data citations, data availability statements, or supplementary materials included in this article.


