Abstract
Ultrasound imaging is widely used to probe the mechanical structure of tissues and visualize blood flow. However, the ability of ultrasound to observe specific molecular and cellular signals is limited. Recently, a unique class of gas-filled protein nanostructures called gas vesicles (GVs) was introduced as nanoscale (∼250 nm) contrast agents for ultrasound, accompanied by the possibilities of genetic engineering, imaging of targets outside the vasculature and monitoring of cellular signals such as gene expression. These possibilities would be aided by methods to discriminate GV-generated ultrasound signals from anatomical background. Here, we show that the nonlinear response of engineered GVs to acoustic pressure enables selective imaging of these nanostructures using a tailored amplitude modulation strategy. Finite element modeling predicted a strongly nonlinear mechanical deformation and acoustic response to ultrasound in engineered GVs. This response was confirmed with ultrasound measurements in the range of 10 to 25 MHz. An amplitude modulation pulse sequence based on this nonlinear response allows engineered GVs to be distinguished from linear scatterers and other GV types with a contrast ratio greater than 11.5 dB. We demonstrate the effectiveness of this nonlinear imaging strategy in vitro, in cellulo, and in vivo.
Ultrasound is a widely used biomedical imaging modality1 that enables the assessment of organ anatomy and function with high spatial and temporal resolution (typically <500 μm and 10 ms).2 However, the role of ultrasound in molecular and cellular imaging remains limited due to a lack of contrast agents and reporter genes able to target specific tissues or visualize cellular processes such as gene expression. We recently introduced a unique class of ultrasound reporters based on gas vesicles (GVs), genetically encoded gas-filled protein nanostructures with dimensions in the order of 250 nm (Fig. 1(a)), which are derived from buoyant microorganisms.3 Unlike conventional microbubble contrast agents,4 which trap gas and are therefore unstable at the nanoscale, GVs stably exclude water but allow gases to freely partition in and out of their hollow interior.5 GVs produce contrast across medical ultrasound frequencies,3 and are amenable to genetic engineering of their physical properties and surface functionality for use as targeted reporters.6 Certain wild-type and engineered GVs have been shown to produce harmonic ultrasound signals.3,6 However, imaging approaches taking advantage of this nonlinear behavior have not been developed.
FIG. 1.
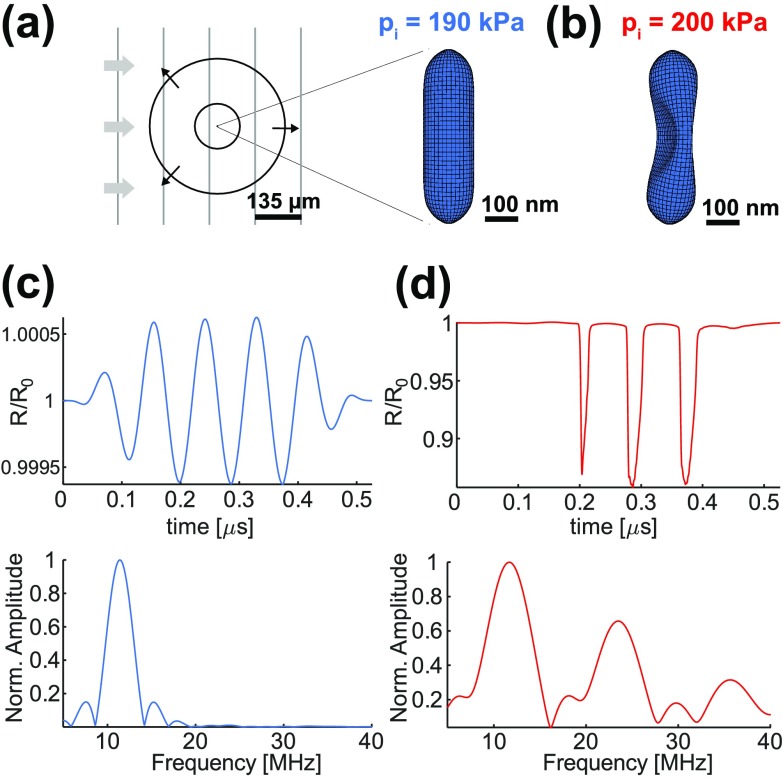
Simulation of the hGV shell response to incoming ultrasound imaging pulses. (a) Diagram and finite element simulation of hGV shell deformation at 190 kPa and (b) at 200 kPa peak positive incident pressures (pi). Gray lines represent an incident excitation wave, while black circles represent scattered wave. (c) Simulated radial excursion at 190 kPa normalized to the resting radius R0 (top) and corresponding Fourier transform (bottom). (d) Simulated radial excursion at 200 kPa normalized to the resting radius R0 and corresponding Fourier transform.
We hypothesized that engineered GVs derived from the cyanobacterium Anabaena flos-aquae6 would exhibit pressure-dependent nonlinear deformations under ultrasound, resulting in nonlinear acoustic signals, and that an amplitude modulation (AM) imaging strategy could be used to identify GV-specific signals based on this behavior. We set out to investigate these hypotheses through a combination of finite element mechanical modeling and experiments conducted in in vitro phantoms, cultured cells, and live mice.
To facilitate the design of our imaging strategy, we first simulated the mechanical behavior of GVs under ultrasound using a finite element analysis (Abaqus/Explicit, Dassault Systèmes Simulia, France). We modeled a GV from A. flos-aquae, which comprises a cylindrical nanostructure with 150 nm diameter and hemispherical ends, totaling 500 nm in length, comprising a 2 nm-thick shell made of the primary GV protein, GvpA (Fig. 1(a)). The crystalline structure of the gas vesicle wall exhibits periodic ribs oriented at 90° to the long axis of the GV. In wild-type GVs (wtGVs), a second protein called GvpC binds to, and hardens the GV shell and prevents the nanostructure from producing harmonic ultrasound signals at the examined pressures.6 We recently showed that removing GvpC from the GV surface results in GVs with second harmonic signals.6 We refer to these harmonic GVs as hGVs.
For modeling purposes, the GV shell density was assumed to be 1320 kg/m3 (Ref. 5). The Young's moduli of hGVs were set to 2.8 GPa and 11.2 GPa across and along the principal axis, respectively.5 This elastic anisotropy takes into account the rib structure of the gas vesicle wall. The Poisson's ratio in both cases was set to 0.499 to produce an incompressible behavior typical of protein-based biomaterials.7 Although these material parameters have not been measured directly, they represent reasonable assumptions based on literature values for proteins, and enable us approximately to model the mechanical behavior of GVs. The inner gas, initially at atmospheric pressure (100 kPa), was treated as trapped inside the shell for the purposes of ultrasound simulation, since its efflux time is considerably longer than an ultrasound cycle at the frequencies used in this study.8 Gas compression/expansion was assumed to be isothermal, as the thermal diffusion length in air at 11.4 MHz is ∼10 times larger than the GV equivalent spherical radius.9 To simulate the acoustic excitation, we applied an oscillatory overpressure in the form of a 6-cycle, 11.4 MHz tapered sine-burst, identical to the ultrasound imaging pulses used experimentally.
Our simulations showed buckling of the hGV structure in response to impinging acoustic pressures above a threshold of 200 kPa (Figs. 1(b) and 1(d)), whereas the structure showed minimal, linear, deformation at 190 kPa (Figs. 1(a) and 1(c)). The frequency spectrum of the simulated scattered pressure of a single hGV revealed harmonic generation in the presence of buckling, whereas shell vibrations below buckling only generated signals at the applied frequency. A 200 kPa buckling threshold for hGVs is in accord with their hydrostatic collapse pressure of 210 kPa.6 Under hydrostatic conditions, the gas inside a GV is able to exit as its volume contracts, so that a buckled GV is not propped up by gas compression, resulting in the structure's rapid collapse.
To examine the pressure-dependent onset of GV buckling and nonlinear scattering experimentally, we measured the acoustic output of these nanostructures in response to 11.4 MHz ultrasound, which is in the frequency range commonly used for preclinical imaging. Samples of hGVs, wtGVs, and 5 μm diameter polystyrene (PS) beads were embedded in agarose phantoms. The GVs were at optical densities of 2.2, corresponding to a molar concentration of 0.25 nM, which is similar to doses used in previous in vivo studies3,6 and represents a gas volume fraction of ∼0.1%. The PS concentration was set to 0.4% w/v to obtain a similar linear echogenicity for all three samples. We imaged the samples with a high frequency linear array (18 MHz center frequency, 67% −6 dB bandwidth) connected to a programmable ultrasound scanner (Verasonics, USA). To enable the observation of second harmonics, we transmitted 6-cycle, 11.4 MHz, tapered sine-bursts (30% Tukey window) of peak positive pressures ranging from 165 kPa to 437 kPa. We digitized the received ultrasound signals at 62.5 MHz.
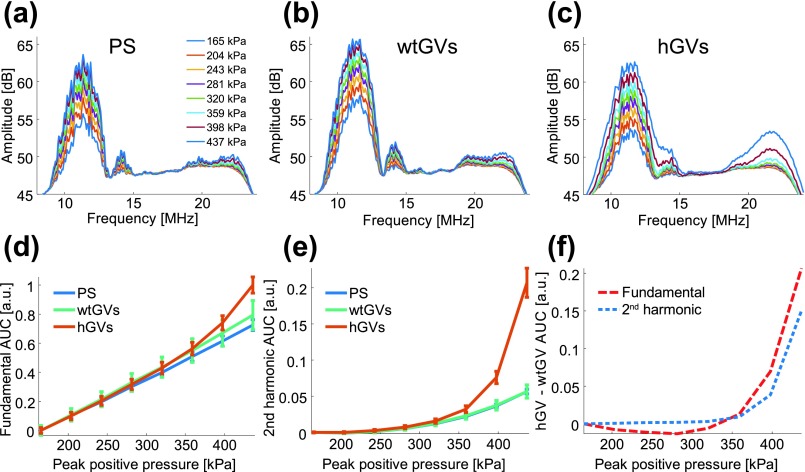
Frequency spectra of the backscattered signals from PS and wtGVs showed no major harmonic content across the pressures tested (165 to 437 kPa), whereas hGVs produced second harmonics at pressures above 320 kPa (Figs. 2(a)–2(c)). In addition, the fundamental frequency component of hGV backscattered signals increased non-linearly above this apparent threshold. This is readily seen by analyzing the area under the curve (AUC) as a function of pressure in the fundamental (9.5 MHz to 13 MHz) and second harmonic (19 MHz to 26 MHz) bands (Figs. 1(d)–1(e)). In both cases, the backscattered signal in hGVs deviates from linear-scattering wtGVs starting around 320 kPa (Fig. 2(f)). We note that for wtGVs and PS beads, the slight increase in 2nd harmonic amplitude with pressure (up to +1.7 dB at 400 kPa for wtGVs) is most likely due to nonlinear propagation in the medium,10 since PS beads are linear scatterers.
FIG. 2.
Experimental spectra of backscattered signals from PS, wt GVs, and hGVs. (a) PS spectra, (b) wtGVs spectra and (c) hGVs spectra in response to varying peak positive incident pressures. (d) Fundamental area under the curve (AUC) integrated from 9.5 MHz to 13 MHz as a function of pressure (N = 5 samples; error bars represent standard error of the mean). (e) Second harmonic AUC integrated from 19 MHz to 26 MHz as a function of pressure (N = 5 samples; error bars represent standard error of the mean). (f) Differential AUC response between hGVs and wtGVs at the fundamental (dashed red line) and second harmonic frequency (dashed blue line).
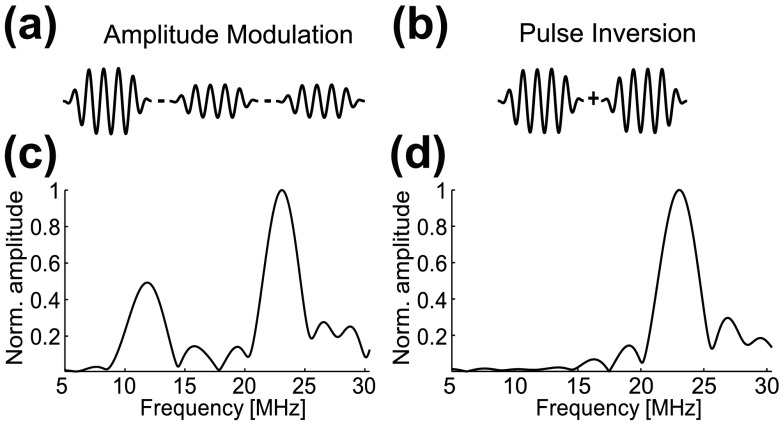
Having established the pressure-dependent nonlinear response of hGVs to ultrasound, we assessed the ability of these nanostructures to be imaged selectively with nonlinear pulse sequences originally developed for microbubble contrast agents: amplitude modulation (AM)11,12 and pulse inversion (PI).13 AM detects differential backscattering generated by two consecutive transmissions of different amplitudes (Fig. 3(a)), while PI summates the backscattered signal from two 180° phase-shifted transmissions, resulting in cancellation of fundamental signals but retention of harmonics10 (Fig. 3(b)). To illustrate these concepts in the context of GVs, we calculated the scattered pressure arising from the radius changes14 observed in the simulations of Fig. 1 (at applied pressures of 190 kPa and 380 kPa), and subtracting or summating signals as depicted in Figs. 3(a) and 3(b). As expected, the simulated AM sequence resulted in a signal at both fundamental and harmonic frequencies (Fig. 3(c)), while the simulated PI sequence retained only the second harmonic (Fig. 3(d)).
FIG. 3.
Simulation of the scattered frequency spectrum of a single hGV in response to an amplitude modulation and pulse inversion sequence. (a) Simulated spectrum from an amplitude modulation pulse sequence comprising one full-amplitude (380 kPa peak positive) and two subtracted half-amplitude (190 kPa peak positive) 6-cycle sine-bursts at 11.4 MHz. (b) Simulated spectrum form a pulse inversion sequence comprising the sum of two phase-inverted 6-cycle sine-bursts at 380 kPa peak positive amplitude and 11.4 MHz. The frequency spectra are normalized Fourier transforms of the scattered pressure computed from changes in the simulated effective radius of the GVs.
To implement the AM sequence experimentally, we transmitted three consecutive sine-bursts of relative amplitudes 1, ½, and ½. The half-amplitude transmissions were achieved by silencing the odd or even elements of the transducer array, while the full-amplitude transmission utilized all the elements; this gave us a convenient way to modulate the amplitude consistently across frequencies and voltages. Summation of signals from two half-amplitude pulses also results in lower noise than multiplying the signal from a single such pulse. AM images were generated by subtracting the sum of the signals backscattered from the two half-amplitude pulses from the signal arising from the full-amplitude pulse. To ensure the largest differential response, the full amplitude pulse was set to drive hGVs into their nonlinear regime (>320 kPa) while the half-amplitude pulses triggered their linear response. The PI sequence consisted of two consecutive phase-inverted transmissions, coded by assigning a +1 or −1 amplitude to each element of the array. Final PI images were generated by adding the radiofrequency data backscattered by the two phase-inverted transmissions. To enable comparison, all three pulse sequences were implemented at 11.4 MHz so that the second harmonic frequency content could be detected by our imaging probe (18 MHz center frequency, 67% −6 dB bandwidth).
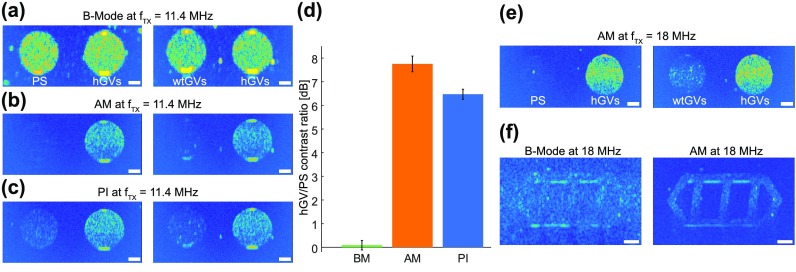
We acquired the cross-sectional two-dimensional images of phantoms containing our three different samples and characterized the images in terms of their contrast-to-noise (CNR) and contrast-to-artifact ratios (CTA). CNRs were calculated as the average power in the hGV region of interest (ROI) relative to the average power in an empty agarose sample. All ROIs were squares of the same size entirely contained within the corresponding circular samples. The samples were located at the same depth (8 mm) to control for ultrasound attenuation. Contrast-to-artifact ratios (CTA) were computed by calculating the average power in the hGV ROI to the average power in the PS or wtGV ROIs. In conventional B-Mode images, hGVs, wtGVs, and PS samples appeared with a similar intensity (Fig. 4(a)). In contrast, AM images showed almost exclusively hGVs, while cancelling essentially all signals from wtGVs and PS (Fig. 4(b)). PI also enhanced the hGV signal relative to the other specimens, but contained a residual signal from PS and wtGVs, consistent with a nonlinear propagation artifact10 (Fig. 4(c)). Although the CNR values for these two methods were similar (Table I), AM produced greater hGV contrast specificity, with a CTA ratio relative to PS of 7.8 dB compared to 6.5 dB for PI (Fig. 4(d)). The same trend was observed comparing the signal from hGVs and wtGVs (Table I).
FIG. 4.
In vitro nonlinear imaging of hGVs versus PS and wtGVs. (a) Conventional ultrasound B-Mode imaging acquired using 11.4 MHz 6-cycle sine-bursts. Left, phantom image comparing PS to hGVs. Right, phantom image comparing wtGVs to hGVs. (b) Amplitude modulation pulse sequence consisting of the sequential transmission of one full amplitude and two half-amplitude 11.4 MHz 6-cycle sine bursts. Left, phantom image comparing PS to hGVs. Right, phantom image comparing wtGVs to hGVs. (c) Pulse inversion sequence consisting of the sequential transmission of two phase inverted 11.4 MHz 6-cycle sine bursts. Left, phantom image comparing PS to hGVs. Right, phantom image comparing wtGVs to hGVs. (d) Ratios of hGV to PS contrast at 11.4 MHz for B-Mode, amplitude modulation and pulse inversion imaging (N = 5 samples; error bars represent standard error of the mean). (e) Amplitude modulation images at 18 MHz. Left, PS versus hGVs. Right, wtGVs to hGVs. (f) Selective amplitude modulation imaging of hGVs embedded within a phantom filled with PS. Scale bars represent 1 mm. PS and wtGV inclusions were imaged at a depth of 8 mm.
TABLE I.
Contrast-to-noise (CNR) and contrast-to-artifact (CTA) ratios for in vitro imaging.
| PI (11.4 MHz) | AM (11.4 MHz) | AM (18 MHz) | |
|---|---|---|---|
| hGVs vs. PS (N = 5) | |||
| CNR | 9.0 dB | 8.7 dB | 15.6 dB |
| Std | 0.6 dB | 0.8 dB | 0.6 dB |
| CTA | 6.5 dB | 7.8 dB | 14.1 dB |
| Std | 0.5 dB | 0.7 dB | 0.7 dB |
| hGVs vs. wtGVs (N = 5) | |||
| CNR | 8.7 dB | 7.9 dB | 15.1 dB |
| Std | 1.0 dB | 0.5 dB | 0.7 dB |
| CTA | 6.4 dB | 6.7 dB | 11.7 dB |
| Std | 0.7 dB | 0.4 dB | 0.2 dB |
With AM established as the more specific pulse sequence for detecting hGVs, we optimized it by imaging samples at the probe center frequency of 18 MHz, at which the transducer array is most sensitive in reception. Since in AM differential nonlinear responses show up at the fundamental frequency, operating at the center frequency of the transducer provides the highest sensitivity in reception. Indeed, AM imaging at 18 MHz resulted in a robust detection of hGVs over linear scatterers (Fig. 4(e)), with CNR above 15 dB and CTA of 14.1 dB relative to the PS beads (Table I).
To illustrate the ability of threshold-dependent AM imaging to pick out hGV signals from background, we arranged hGVs in a gas vesicle pattern within a phantom otherwise filled with PS. Under B-Mode imaging, this pattern is hardly discernable (Fig. 4(f), left). However, with AM, the gas vesicle pattern becomes clearly visible (Fig. 4(f), right).
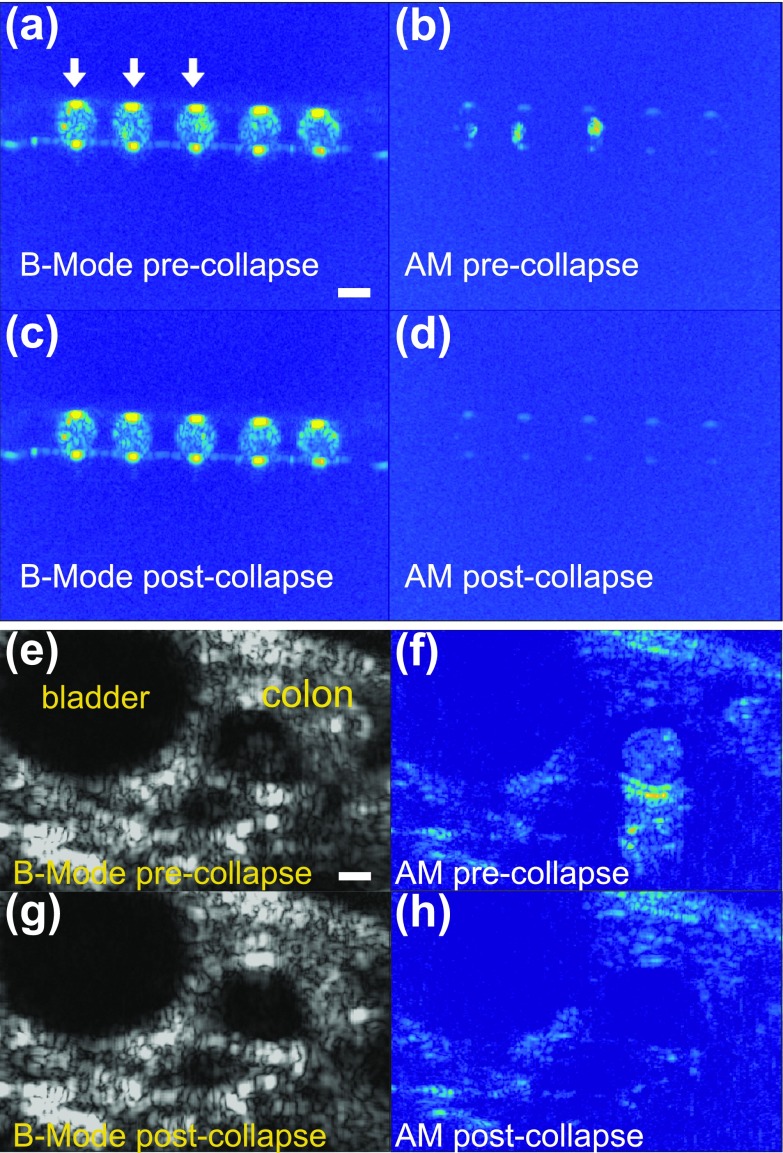
To demonstrate the utility of this nonlinear imaging approach in applications of GVs as targeted or genetically encoded cellular imaging agents, we nanoinjected hGVs into individual oocytes of the frog Xenopus laevis (50 nl per cell at 1.8 nM). We arranged GV-labeled cells and unlabeled controls on the surface of an agarose phantom, and scanned them with B-Mode and AM mode ultrasound. While in B-Mode it was challenging to distinguish labeled oocytes based on their echogenicity (Fig. 5(a)), the AM sequence readily identified oocytes that contained the imaging agent (Fig. 5(b)), suggesting that nonlinear imaging will enhance the visualization of GVs in the cellular context. Ultrasound pulses at peak positive pressures of 3.6 MPa, above the critical collapse pressure of hGVs (600 kPa peak positive pressure),6 were used to collapse these nanostructures, thereby eliminating their ability to scatter sound waves: confirming that they were the source of observed image contrast (Figs. 5(c) and 5(d)).
FIG. 5.
In cellulo and in vivo nonlinear imaging of hGVs at 18 MHz. (a)–(d) In cellulo images of hGVs in Xenopus laevis oocytes. (a) B-Mode imaging of 5 oocytes. The first three oocytes, labelled with white arrows, were injected with hGVs (50 nl, 1.8 nM). (b) Corresponding amplitude modulation image. (c) and (d) Images of the same sample after collapsing hGVs. (e)–(h) In vivo imaging of a wild-type mouse after hGVs were introduced into its colon. Left, B-Mode images before (top) and after (bottom) collapse. Right, AM images before (top) and after (bottom) collapse. Scale bars represent 1 mm. Oocytes and hGVs were imaged at a depth of 8 mm.
Finally, to show that threshold-based AM can enhance the detection of GVs in vivo, we injected hGVs into the colon of anesthetized C57BL/6 mice (0.25 nM in 0.5% agarose; animal procedure approved by the Caltech Institutional Animal Care and Use Committee). The mice were then imaged using 18 MHz ultrasound with B-Mode and AM pulse sequences, as described above. Strikingly, while the GV signal in the colon is weak and difficult to discern under B-Mode imaging relative to tissue (Fig. 5(e)), it becomes readily apparent using AM (Fig. 5(f)), with corresponding contrast-to-tissue ratios (CTR) of −9.4 dB and 9.1 dB, respectively. After collapsing the GVs with 3.6 MPa peak positive pressure ultrasound pulses, hGV signals disappeared from both the B-Mode (Fig. 5(g)) and the AM image (Fig. 5(h)). Interestingly, tissue positioned below the GVs also appeared enhanced in AM, suggesting sound waves traversing the GV-containing region gain nonlinearity as reported in carotid pseudo-enhancement artifacts.15
In conclusion, this study establishes amplitude modulation as a highly effective strategy for the selective imaging of harmonic GV nanostructures. Through the combination of finite element mechanical modeling and experiments, we found that hGVs exhibit a nonlinear ultrasound backscattering behavior as a function of pressure at both their fundamental and second harmonic frequencies when exposed to ultrasound above experimental pressures of 320 kPa. Direct observation of GV shell dynamics under ultrasound exposure is out of reach of our current methods, but our simulations indicate that the nonlinear scattering of GVs originates from shell buckling. An amplitude modulation pulse sequence taking advantage of this behavior, with full- and half-amplitude pulses above and below threshold, respectively, was highly effective at distinguishing hGVs from linear GVs or PS beads at frequencies of 11.4 MHz and 18 MHz. The measured CNR, CTA, and CTR levels were of the order reported in high-frequency applications using conventional micron-scale contrast agents,16,17 supporting the possibility of developing GVs as targeted injectable reporters. In addition, we anticipate that AM ultrasound imaging will facilitate the use of GVs as targeted or genetically encoded intracellular reporters, as demonstrated here by selectively imaging harmonic GVs inside living cells and the mouse gastrointestinal tract. While previous studies have shown GVs to be capable of producing harmonic signals, this study establishes a nonlinear relationship between applied pressure and ultrasound backscattering at both fundamental and second harmonic frequencies, and shows that this relationship can be used with AM and PI pulse sequences to obtain GV-specific images. Future work is needed to examine the nonlinear behavior of GVs across a broader range of frequencies; this behavior is expected to be similar at frequencies above ∼1 MHz, at which limited amounts of gas are able to pass through GV shells during the compression phase of ultrasound pulses. In addition, pulse sequence improvements are needed to eliminate the pseudo-enhancement artifacts15 appearing below hGV-rich regions. Finally, it will be interesting to apply AM to a broader range of GVs being engineered at the genetic level with unique mechanical properties, potentially including signature thresholds for nonlinearity.
Acknowledgments
The authors thank Dan Piraner for assistance with the GV phantom mold design, and Stuart Foster and Emmanuel Chérin for helpful discussions. This research was supported by the National Institutes of Health (R01-EB018975). D.M. is supported by the Human Frontiers Science Program Cross-Disciplinary Postdoctoral Fellowship (Award No. LT000637/2016). A.L. is supported by the NSF graduate research fellowship (Award No. 1144469). Y-L.N. is supported by the Taipei Veterans General Hospital / National Yang-Ming University Excellent Physician Scientists Cultivation Program, No. 103-Y-A-003. Research in the Shapiro laboratory is also supported by the Heritage Medical Research Institute, Burroughs Wellcome Career Award at the Scientific Interface, the Pew Scholarship in the Biomedical Sciences, and the Packard Fellowship for Science and Engineering.
References
- 1. Liang H.-D., Alison Noble J., and Wells P. N. T., Interface Focus (4), 475 (2011). 10.1098/rsfs.2011.0042 [DOI] [Google Scholar]
- 2. Montaldo G., Tanter M., Bercoff J., Benech N., and Fink M., IEEE Trans. Ultrason., Ferroelectr., Freq. Control (3), 489 (2009). 10.1109/TUFFC.2009.1067 [DOI] [PubMed] [Google Scholar]
- 3. Shapiro M. G., Goodwill P. W., Neogy A., Yin M., Foster F. S., Schaffer D. V., and Conolly S. M., Nat. Nanotechnol. (4), 311 (2014). 10.1038/nnano.2014.32 [DOI] [PMC free article] [PubMed] [Google Scholar]
- 4. Bouakaz A. and de Jong N., Ultrasound Med. Biol. (2), 187 (2007). 10.1016/j.ultrasmedbio.2006.07.008 [DOI] [PubMed] [Google Scholar]
- 5. Walsby A. E., Microbiol. Rev. (1), 94 (1994). [DOI] [PMC free article] [PubMed] [Google Scholar]
- 6. Lakshmanan A., Farhadi A., Nety S. P., Lee-Gosselin A., Bourdeau R. W., Maresca D., and Shapiro M. G., ACS Nano (8), 7314 (2016). 10.1021/acsnano.6b03364 [DOI] [PMC free article] [PubMed] [Google Scholar]
- 7. Ratner B. D., Hoffman A. S., Schoen F. J., and Lemons J. E., Biomaterials Science: An Introduction to Materials in Medicine ( Academic Press, 2004). [Google Scholar]
- 8. Walsby A. E., Revsbech N. P., and Griffel D. H., Microbiology (4), 837 (1992). 10.1099/00221287-138-4-837 [DOI] [Google Scholar]
- 9. Prosperetti A., Mechanics and Physics of Bubbles in Liquids ( Springer, 1982), p. 145. [Google Scholar]
- 10. Pasovic M., Danilouchkine M., Faez T., van Neer P. L., Cachard C., van der Steen A. F., Basset O., and de Jong N., Phys. Med. Biol. (11), 3163 (2011). 10.1088/0031-9155/56/11/001 [DOI] [PubMed] [Google Scholar]
- 11. Brock-Fisher G. A., Poland M. D., and Rafter P. G., U.S. patent 5,577,505 (26 November 1996).
- 12. Mor-Avi V., Caiani E. G., Collins K. A., Korcarz C. E., Bednarz J. E., and Lang R. M., Circulation (3), 352 (2001). 10.1161/01.CIR.104.3.352 [DOI] [PubMed] [Google Scholar]
- 13. Simpson D. H., Chin C. T., and Burns P. N., IEEE Trans. Ultrason., Ferroelectr., Freq. Control (2), 372 (1999). 10.1109/58.753026 [DOI] [PubMed] [Google Scholar]
- 14. Hoff L., Acoustic Characterization of Contrast Agents for Medical Ultrasound Imaging ( Springer Science & Business Media, 2001). [Google Scholar]
- 15. ten Kate G. L., Renaud G. G., Akkus Z., van den Oord S. C., ten Cate F. J., Shamdasani V., Entrekin R. R., Sijbrands E. J., de Jong N., Bosch J. G., Schinkel A. F., and van der Steen A. F., Ultrasound Med. Biol. (4), 593 (2012). 10.1016/j.ultrasmedbio.2011.12.019 [DOI] [PubMed] [Google Scholar]
- 16. Maresca D., Jansen K., Renaud G., van Soest G., Li X., Zhou Q., de Jong N., Shung K. K., and van der Steen A. F. W., Appl. Phys. Lett. (4), 043703 (2012). 10.1063/1.3679375 [DOI] [Google Scholar]
- 17. Maresca D., Skachkov I., Renaud G., Jansen K., van Soest G., de Jong N., and van der Steen A. F., Ultrasound Med. Biol. (6), 1318 (2014). 10.1016/j.ultrasmedbio.2013.12.029 [DOI] [PubMed] [Google Scholar]


