

Abstract
Background
Melasma is a chronic acquired focal hypermelanosis affecting photoexposed areas, especially for women during fertile age. Several factors contribute to its development: sun exposure, sex steroids, medicines, and family history. Melanic pigmentation pathway discloses several SNPs in different populations. Here, we evaluated the association between genetic ancestry and facial melasma.
Methods
A cross-sectional study involving women with melasma and an age-matched control group from outpatients at FMB-Unesp, Botucatu-SP, Brazil was performed. DNA was extracted from oral mucosa swabs and ancestry determined by studying 61 INDELs. The genetic ancestry components were adjusted by other known risk factors by multiple logistic regression.
Results
We evaluated 119 women with facial melasma and 119 controls. Mean age was 39 ± 9 years. Mean age at beginning of disease was 27 ± 8 years. Pregnancy (40%), sun exposure (37%), and hormonal oral contraception (22%) were the most frequently reported melasma triggers. All subjects presented admixed ancestry, African and European genetic contributions were significantly different between cases and controls (respectively 10% vs 6%; 77% vs 82%; p < 0.05). African ancestry (OR = 1.04; 95% CI 1.01 to 1.07), first generation family history (OR = 3.04; 95% CI 1.56 to 5.94), low education level (OR = 4.04; 95% CI 1.56 to 5.94), and use of antidepressants by individuals with affected family members (OR = 6.15; 95% CI 1.13 to 33.37) were associated with melasma, independently of other known risk factors.
Conclusions
Facial melasma was independently associated with African ancestry in a highly admixed population.
Electronic supplementary material
The online version of this article (doi:10.1186/s12881-017-0378-7) contains supplementary material, which is available to authorized users.
Keywords: Melasma, Melanosis, Contraceptives, Oral contraceptives, Pregnancy, Hormones, Gonadal steroid hormones, Melanosis, Pigmentation, Skin pigmentation, Ultraviolet rays, Pigmentation disorders, Ancestry, INDEL
Background
Melasma is an acquired chronic hypermelanosis which mainly affects women during fertile age. Its aetiology is not fully understood, however, many factors can trigger or aggravate it: sun exposure, hormonal contraception (HC), hormone replacement therapy, cosmetics, photosensitising medication, pregnancy, and psychological stress. High levels of occurrence in families (40–60%) suggest a genetic component [1–3].
Ancestry-informative markers (AIMs) are used to estimate ancestral contributions to individuals due to their large allele frequency differences between geographically or ethnically defined populations [4]. AIMs have not been used to estimate the genetic contribution of population ancestry in melasma. However, self-reported Amerindian ancestry was linked to melasma in Brazil [5]. Some authors have also identified polymorphisms and different gene expression patterns related to skin pigmentation which are associated with the population origin [6–8].
The Brazilian population originated as a result of the admixture process that took place mostly between three ancestral groups, namely European colonisers, enslaved Africans and native Amerindians, which started more than 500 years ago [9–11]. This study aimed to evaluate genetic ancestry in Brazilian patients with facial melasma.
Methods
A cross-sectional study was performed with women over 18 years-old under treatment at Botucatu University Hospital – UNESP between November/2013 and May/2014. The project was approved by the institutional research ethics committee.
Cases were determined by the presence of facial melasma, clinically confirmed by a dermatologist. Controls were paired with cases according to age group (±5 years).
Subjects were not included if they had other facial dermatoses, reported Asian descent, or extreme Fitzpatrick’s phototypes I and VI (due to the absence of these extreme phototypes in this sample of melasma patients).
Sampling was performed by convenience on consecutive patients seen at the clinic. Subjects were interviewed by the researcher using a semi-structured form, they then rinsed their mouths with clean bottled mineral water and a sample of oral mucosa was taken using a swab.
DNA was extracted using a QIAmp DNA micro kit in a QIAcube and the QIAmp® DNA Investigator kit protocol provided by QIAGEN (USA) [12], in the Maternal Fetal Laboratory – UNESP. The samples were amplified and genotyped for 61 insertion-deletion (INDEL) AIMs (Additional file 1: Table S1) valid for the Brazilian population in the Human Genetics and Medicine Laboratory (LGHM-UFPA) [13, 14].
Amplification was performed using a multiplex PCR technique in a final volume of 10 μL (1 μL DNA + 1 μL Primer mix + 5 μL Taq PCR Master Mix Qiagen + 1 μL Qsolution + 2 μL water) [14]. The PCR product (1 μL) was added to a mix containing 8.7 μL formamide and 0.3 μL Gene Scan 500 LIZ standard size ladder (Applied Biosystems). The DNA fragments were genotyped by capillary electrophoresis using an automatic ABI PRISM® 3130 Genetic Sequencer Analyser (Applied Biosystems, USA), and analysed with Gene Mapper® IDv3.2 (Applied Biosystems). Allele identification was performed with reference to the 500 LIZ standard size ladder (Applied Biosystems) [14].
The ancestry of the Brazilian samples was estimated using STRUCTURE v2.3.4, using three parental populations (Amazonian Amerind, Sub-Saharan African and Western European). This assessment was based on a validated database with 593 individuals of known ancestry that resulted in 98% correct classification: Sub-Saharan Africans - 189 individuals fromAngola, Mozambique, Zaire, Cameroon, and the Ivory Coast; Europeans −161 individuals, mainly Portuguese; and Amerindians - 243 individuals from indigenous tribes of the Brazilian Amazon region [14–17].
Categorical and ordinal data were shown as percentages and compared between groups by the chi-squared or chi squared for trend test. Continuous data were represented by means and standard deviations or medians and quartiles (p25–p75) according to the Shapiro-Wilk test (normality), and compared by the Student t, Mann-Whitney or Jonckheere-Terpstra tests [18, 19].
Correlations between ancestral components and other continuous variables were estimated by Spearman’s coefficient of correlation (rho) [18, 20].
Ancestry components were tabulated and percentages from each group compared between cases and controls or according to phototype or schooling by multivariate analysis of variance (MANOVA-Pillai’s trace) with post-hoc Bonferroni test. Ancestral components were normalised with a log10 transformation (for the MANOVA test). Homoscedasticity was evaluated with the Levene test [18].
In order to adjust the effect of ancestry for clinical and other epidemiologic factors, a multivariate model (conditional multiple logistic regression) was built. The covariates were included according to their significance (p < 0.2) at the bivariate analysis, but collinearities were supressed. Interactions between final terms of the model were tested for their additive effect. Effect size was estimated by odds ratio (OR) and its 95% confidence interval [21, 22].
Missing data (<10%), for multivariate analysis, were estimated by multiple imputation using ten iterations [23].
Sensitivity analysis was performed by: evaluating the final multivariate logistic regression model without imputed data.
The sample size calculation was based on a pre-test with 100 cases and 100 controls calculated for a final multiple logistic regression model with 80% power and a two-sided alpha level of 0.05. It resulted in 110 subjects in each group, leading to an effect size (R2) of more than 0.3 [21, 22, 24].
Data were analysed with IBM-SPSS 20.0 [25]. Significance was set at p < 0.05.
Results
We evaluated 119 women with facial melasma and a similar number of controls (n = 238). Clinical characteristics of patients with facial melasma are shown in Table 1. The onset of melasma was during fertile age; pregnancy and sun exposure were the most prevalent triggering factors; and centrofacial topography was the most affected area. No melasma patient had skin phototype I or VI. Pregnancy occurred in 92 (77%) cases, and pregnancy-induced melasma was reported by 48 (52%) patients who had become pregnant.
Table 1.
Clinical and demographic data for patients with melasma
| Age of melasma onset (years)a | 27.2 (8.3) |
| Reported trigger factor − N (%) | |
| Pregnancy | 48 (40) |
| Sun exposure | 44 (37) |
| HC | 26 (22) |
| HRT | 2 (2) |
| Cosmetics/Treatments | 7 (6) |
| Stressful events | 3 (3) |
| Others | 6 (5) |
| Affected facial site − N (%) | |
| Zygomatic | 60 (50) |
| Frontal | 48 (40) |
| Upper lip | 44 (37) |
| Temporal | 39 (33) |
| Mentonian | 25 (21) |
| Mandibular | 22 (18) |
| Parotid | 20 (17) |
| Nasal | 19 (16) |
| Glabelar | 15 (13) |
| Affected facial sitesb | 3 (2–4) |
Abbreviations: HC hormonal oral contraception, HRT hormonal replacement therapy
amean (st deviation)
bmedian (p25–p75)
Main demographic and genetic ancestry data for the groups are shown in Table 2. There is a higher frequency of first generation family report of melasma, history of pregnancy, daily sun exposure, low schooling level and African ancestry among cases. All subjects presented mixed genetic ancestry. European ancestry was predominant in both groups followed by African and Amerindian components.
Table 2.
Demographic and genetic ancestry data from groups
| Variables | Melasma (n = 119) |
Controls (n = 119) |
Bivariate analysis | Multivariate analysis | ||
|---|---|---|---|---|---|---|
| Odds Ratio (CI 95%) | p | Odds Ratio (CI 95%) | p | |||
| Age (years)a | 39.0 (8.2) | 39.0 (9.7) | – | – | 0.99 (0.95–1.02) | 0.44 |
| Skin phototype-N (%) | 0.09 | 0.13 | ||||
| II | 18 (15) | 30 (25) | 1.00 (–) | 1.00 (–) | ||
| III | 42 (35) | 45 (38) | 1.56 (0.76–3.20) | 1.32 (0.57–3.02) | ||
| IV | 46 (39) | 30 (25) | 2.56 (1.22–5.38) | 1.40 (0.58–3.39) | ||
| V | 13 (11) | 14 (12) | 1.55 (0.60–4.02) | 0.39 (0.11–1.40) | ||
| Education level-N (%) | <0.01 | 0.01 | ||||
| Elementary-Middle school | 39 (33) | 14 (12) | 4.67 (2.24–9.73) | 4.04 (1.62–10.11) | ||
| High school | 43 (36) | 43 (36) | 1.68 (0.93–3.01) | 1.71 (0.85–3.44) | ||
| College | 37 (31) | 62 (52) | 1.00 (–) | 1.00 (–) | ||
| Family with melasma (first degree)-N (%) | 67 (56) | 27 (24) | 3.10 (1.11–8.70) | 0.03 | 3.04 (1.56–5.94) | <0.01 |
| Age of menarche (years)a | 12.8 (1.8) | 12.7 (1.8) | 1.01 (0.88–1.16) | 0.92 | – | – |
| Time using hormonal contraception (years)b | 10 (3–15) | 5 (1–12) | 1.03 (0.98–1.07) | 0.13 | 1.02 (0.98–1.07) | 0.33 |
| Daily regular sun exposition-N (%) | 42 (44) | 24 (27) | 2.15 (1.16–3.99) | 0.02 | 1.09 (0.57–2.10) | 0.80 |
| Pregnancy history-N (%) | 92 (77) | 77 (65) | 1.86 (1.05–3.29) | 0.03 | 1.50 (0.69–3.29) | 0.31 |
| Psycotropic drugs (regular use)-N (%) | ||||||
| Antidepressant | 28 (24) | 18 (15) | 1.73 (0.90–3.33) | 0.10 | 2.96 (0.37–24.03) | 0.31 |
| Anxiolytic | 11 (9) | 5 (4) | 2.32 (0.78–6.90) | 0.12 | – | – |
| Genetic ancestry (%)b | ||||||
| European component | 77 (64–89) | 82 (69–90) | 0.98 (0.97–0.99) | 0.04 | – | – |
| Amerindian component | 7 (4–14) | 7 (4–14) | 1.00 (0.97–1.02) | 0.72 | – | – |
| African component | 10 (4–21) | 6 (4–16) | 1.03 (1.01–1.05) | <0.01 | 1.04 (1.01–1.07) | <0.01 |
| Interactions | ||||||
| Antidepressanta Family with melasma | 6.15 (1.13–33.37) | <0.01 | ||||
| Antidepressanta Pregnancy history | 0.14 (0.01–1.35) | 0.09 | ||||
p (overall model) < 0.01; Hosmer-Lemeshow test: p = 0.98; Correct classification: 72%; R2 (Nagelkerke): 0.31
amean (st deviation)
bmedian (p25–p75)
Figure 1 shows case and control distribution related to genetic ancestry. There was a significant difference between groups for ancestral components with significant variation for African and European ancestry.
Fig. 1.
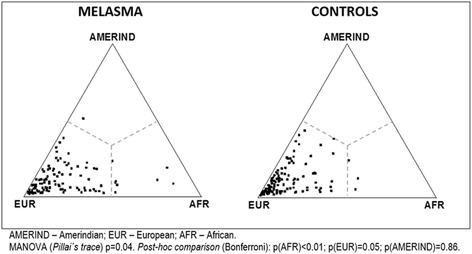
Ternary plot of group genetic ancestral composition
Multivariate analysis (Table 2) showed that the following were independently significant for melasma development: low education level, family history of melasma and African ancestry. Significant interaction was seen between use of antidepressants and family history of melasma (OR = 6.15; 95% CI 1.13 to 33.37; p < 0.01).
Sensitivity analysis using logistic regression without imputed data (n = 180) provided a similar result to the complete model (Additional file 2: Table S2).
Subjects with higher education levels exhibited higher median European ancestry and lower Amerindian ancestry than those with lower education levels, without difference between cases and controls (p > 0.1). Estimated ancestral contributions according to college, high school and elementary education were for European: 84, 79 and 76% (p < 0.01); for African: 5, 9 and 11% (p < 0.01); and for Amerindian: 6, 7, 9% (p = 0.01).
There was moderate correlation between European (rho = −0.43; p < 0.01) and African (rho = 0.41; p < 0.01) ancestry component and phototypes, but poor correlation with phototype for the Amerindian ancestral component (rho = 0.18; p < 0.01) (Additional file 3: Table S3).
Among melasma patients, genetic ancestry did not show an association with reported triggering factors, family history, or age at disease onset. The number of affected facial topographies decreased in proportion to education level: mean 4.0, 3.4 and 2.4 lesions (Additional file 4: Table S4) among participants with elementary, high school and college education (p < 0.01). Similarly, it was weakly correlated with the European ancestral component (rho = −0.23; p = 0.01), but not with the African and Amerindian components (rho = 0.18 and 0.15; p > 0.05).
Discussion
African genetic ancestry, as well as education and family history are associated with the development of female facial melasma in a highly genetically admixed population, independently of skin phototype and other risk factors.
Melasma patients in this study presented phenotype, clinical, and demographic characteristics similar to other Brazilian studies: disease onset during fertile age (16 to 35 years); the main triggers being sun exposure and hormones (pregnancy and HC), preferentially affecting the centrofacial region, high occurrence in family members and greater prevalence among dark phototypes (III to V) [3, 26].
Ancestral origin can be associated with diverse immunological responses patterns, metabolic processes, host response to infections, and drug treatment outcomes which justify clinical studies investigating ancestral components in admixed populations [27–31]. Amerindian ancestry is associated with a lower risk of leprosy [32] as well as for Alzheimer’s disease [33], but a higher risk of systemic lupus erythematous [34, 35]. European ancestry is associated with higher risk of neuromyelitis optica and multiple sclerosis, [36] sleep apnoea, [37] and death from heart failure [38]. Obesity shares African origin genes, [39] as do asthma and IgE level [40].
Brazil, especially the studied region, has experienced considerable admixture between Amerindian, European and African populations [41]. Skin pigmentation exhibits polygenic inheritance and several single nucleotide polymorphisms were identified in pigmentation genes in different ancestral groups [6–8, 42].
Despite the high admixture rate, European ancestry is the most prominent among the Brazilian population, as shown in our sample [11]. Physical traits and parental reports can lead to a mismatch between self-reported and genetic ancestry, which may explain the lack of association observed in our study between Amerindian ancestry and melasma, even though a positive association was described earlier in the same population [5, 43].
Melasma is less prevalent in Europeans, and more frequent in Asians and Latin Americans, who have a common phylogenetic origin in human migrations from Africa [44, 45]. In a study of genetic ancestry of the skin pigment system, similarities were seen between European and Asian expression patterns which differed from the African pattern. The authors also showed that pigmentation is the result of complex cellular interactions in which a large contingent of genes and regulatory factors are not completely understood, such as NINL, S100A4, H19, WIF-1, PDZK1, sex steroids, and miRNA-675 [46–52].
Furthermore, melanogenesis in melasma presents a different pathophysiological pattern than common tanning, ephelides and solar lentigines. A study on long wavelength UVA and visible light (violet and blue) identified a delayed pigmentation similar to melasma, and it was not identified among lighter phototypes [53–55]. The evolutive gain of melanogenesis promoted by non-ionizing radiation in darker skin is still not understood, but can support the relapsing of melasma despite adequate UVB and short wavelength UVA photoprotection [56].
There are histopathological similarities found in skin with melasma and dark skin. African skin has large non-aggregated melanosomes distributed through all layers of the epidermis with an increased number in the basal layer [57, 58]. The stratum corneum from black skin has less lipids and the dermis has the same thickness as Caucasian skin, however fibroblasts and macrophages are larger, more numerous, and hyperactive [57, 59, 60]. In an analogous way, the histopathological characteristics of highly pigmented skin, such as more mature melanosomes, greater dermic cellularity and reduced lipid layer are also present in patients with melasma. Moreover, after sun exposure, skin with melasma develops a more intense pigmentation than adjacent skin, as a localized darker phenotype [2, 61–64].
There was no information on melasma prevalence according to social strata or income levels. This is the first study to explore its prevalence across educational levels. Lower education is associated with lower socioeconomic status, higher overall mortality, less information regarding disease prevention, and less concern with personal health. Social and educational status can be considered as a proxy indicator for these factors that can be a confounding in the association with melasma and ancestry [65]. Patients with melasma and low schooling level could be less adept at sun protection, probably due to the lack of information on prevention and the cost of sunscreen products. They can be more exposed to the sun in the course of their daily life, as they work in jobs which require less instruction but more exposure to UVR.
Our study also showed that the number of facial topographies affected by the disease is lower in relation to education level. Also, schooling is associated with lower African and Amerindian ancestral components, in contrast with European ancestry. However, low educational level and African ancestry were independently associated with melasma. In addition to educational level, further studies need to evaluate the association between family income and melasma and its severity.
Observational studies are subject to memory and information bias, which in this case could have occurred in family history, use of medication and daily sun exposure. It is believed that there were similar imprecision levels between cases and controls which minimises their impact in final results.
Generalisation of this study is difficulted due to the fact that cases and controls were recruited from a public dermatologic service in the interior of Brazil, however, group homogeneity in relation to patient geographic and social origin, guarantees comparability between them. Similarly, the exclusion of Asian individuals and extreme phototypes (I & VI)-specifically associated with European and African ancestry, maximised the exploration of cases and controls with a higher genetic admixture, strengthening the internal validity of our results.
This investigation must be further pursued in patients with extrafacial melasma, men, and other populations with different genetic ancestral components, such as Middle Eastern, East Asian and populations from Oceania. Additionally an exploratory study on the mosaicism of the pigmentary system, especially in genes reported as related to ancestry, is warranted.
Conclusions
Facial melasma was independently associated with African ancestry in a highly admixed population.
Acknowledgements
We thank the patients for their cooperation and all the technicians involved in this work.
Funding
This study was supported by “Sebastião Sampaio” Fund to Support Dermatology of São Paulo-FUNADERSP, São Paulo, Brazil. (n° 09/2013).
Availability of data and materials
Data from this study are freely available and can be obtained by contacting the corresponding author.
Authors’ contributions
MPBD-Data colection, DNA processing, final text composition and approval. MCB-Data colection, DNA processing, final text approval. BRAR-DNA processing and sequencing, final text approval. MGS-Data analysis, DNA processing, final text approval. LDBM-Data colection, final text approval. SESS-Data analysis, DNA sequencing, final text approval. HAM-Data collection, statistical analysis, final text composition and approval. All authors read and approved the final manuscript.
Competing interests
The authors declare that they have no competing interests.
Consent for publication
Written informed consent was obtained from legally authorized representatives of the patient (parental consent) to participate in this study and its publication and any accompanying images.
Ethics approval and consent to participate
This study has been approved by the Botucatu Medical School’s Committee on Clinical Investigation (CAAE: 19900013.4.0000.5411). Written informed consent was obtained from the patients to participate in this study and its publication and any accompanying images.
Additional files
List of INDELs. (DOCX 22 kb)
Sensitivity analysis of data without imputation (n = 180). (DOCX 16 kb)
Correlation coefficient (Spearman’s rho) between ancestry component and skin phototype, education level or facial topographies affected (n = 119). (DOCX 14 kb)
Number of facial topographies affected by melasma according to schooling and skin phototypes (n = 119). (DOCX 14 kb)
Contributor Information
Maria Paula Barbieri D’Elia, Email: mpbarbieri@yahoo.com.br.
Marcela Calixto Brandão, Email: marcela-calixtobrandao@hotmail.com.
Bruna Ribeiro de Andrade Ramos, Email: bru_rar@hotmail.com.
Márcia Guimarães da Silva, Email: mgsilva@fmb.unesp.br.
Luciane Donida Bartoli Miot, Email: lucianemiot@fmb.unesp.br.
Sidney Emanuel Batista dos Santos, Email: sidneysantos@ufpa.br.
Hélio Amante Miot, Email: heliomiot@fmb.unesp.br.
References
- 1.Handel AC, Miot LD, Miot HA. Melasma: a clinical and epidemiological review. An Bras Dermatol. 2014;89(5):771–782. doi: 10.1590/abd1806-4841.20143063. [DOI] [PMC free article] [PubMed] [Google Scholar]
- 2.Miot LD, Miot HA, Silva MG, Marques ME. Physiopathology of melasma. An Bras Dermatol. 2009;84(6):623–635. doi: 10.1590/S0365-05962009000600008. [DOI] [PubMed] [Google Scholar]
- 3.Tamega Ade A, Miot LD, Bonfietti C, Gige TC, Marques ME, Miot HA. Clinical patterns and epidemiological characteristics of facial melasma in Brazilian women. J Eur Acad Dermatol Venereol. 2013;27(2):151–156. doi: 10.1111/j.1468-3083.2011.04430.x. [DOI] [PubMed] [Google Scholar]
- 4.Shriver MD, Smith MW, Jin L, Marcini A, Akey JM, Deka R, et al. Ethnic-affiliation estimation by use of population-specific DNA markers. Am J Hum Genet. 1997;60(4):957–964. [PMC free article] [PubMed] [Google Scholar]
- 5.Handel AC, Lima PB, Tonolli VM, Miot LD, Miot HA. Risk factors for facial melasma in women: a case-control study. Br J Dermatol. 2014;171(3):588–594. doi: 10.1111/bjd.13059. [DOI] [PubMed] [Google Scholar]
- 6.Sturm RA. Molecular genetics of human pigmentation diversity. Hum Mol Genet. 2009;18(R1):R9–R17. doi: 10.1093/hmg/ddp003. [DOI] [PubMed] [Google Scholar]
- 7.Quillen EE, Bauchet M, Bigham AW, Delgado-Burbano ME, Faust FX, Klimentidis YC, et al. OPRM1 and EGFR contribute to skin pigmentation differences between Indigenous Americans and Europeans. Hum Genet. 2012;131(7):1073–1080. doi: 10.1007/s00439-011-1135-1. [DOI] [PubMed] [Google Scholar]
- 8.Lao O, de Gruijter JM, van Duijn K, Navarro A, Kayser M. Signatures of positive selection in genes associated with human skin pigmentation as revealed from analyses of single nucleotide polymorphisms. Ann Hum Genet. 2007;71(Pt 3):354–369. doi: 10.1111/j.1469-1809.2006.00341.x. [DOI] [PubMed] [Google Scholar]
- 9.Alves-Silva J, da Silva Santos M, Guimaraes PE, Ferreira AC, Bandelt HJ, Pena SD, et al. The ancestry of Brazilian mtDNA lineages. Am J Hum Genet. 2000;67(2):444–461. doi: 10.1086/303004. [DOI] [PMC free article] [PubMed] [Google Scholar]
- 10.Ribeiro D. O povo brasileiro: a formação e o sentido do Brasil. 2. São Paulo: Companhia das Letras; 1995. [Google Scholar]
- 11.Leite TK, Fonseca RM, de Franca NM, Parra EJ, Pereira RW. Genomic ancestry, self-reported “color” and quantitative measures of skin pigmentation in Brazilian admixed siblings. Plos One. 2011;6(11):e27162. doi: 10.1371/journal.pone.0027162. [DOI] [PMC free article] [PubMed] [Google Scholar]
- 12.QIAGEN. QIAGEN Sample & Assay Technologies. 2014. Available from: http://www.qiagen.com/br/products/catalog/sample-technologies/dna-sample-technologies/genomic-dna/qiaamp-dna-investigator-kit. Accessed 14 Feb 2017.
- 13.Resque RL, Freitas Ndo S, Rodrigues EM, Guerreiro JF, Santos NP, Ribeiro Dos Santos A, et al. Estimates of interethnic admixture in the Brazilian population using a panel of 24 X-linked insertion/deletion markers. Am J Hum Biol. 2010;22(6):849–852. doi: 10.1002/ajhb.21089. [DOI] [PubMed] [Google Scholar]
- 14.Santos NP, Ribeiro-Rodrigues EM, Ribeiro-Dos-Santos AK, Pereira R, Gusmao L, Amorim A, et al. Assessing individual interethnic admixture and population substructure using a 48-insertion-deletion (INSEL) ancestry-informative marker (AIM) panel. Hum Mutat. 2010;31(2):184–190. doi: 10.1002/humu.21159. [DOI] [PubMed] [Google Scholar]
- 15.Cardena MM, Ribeiro-Dos-Santos A, Santos S, Mansur AJ, Pereira AC, Fridman C. Assessment of the relationship between self-declared ethnicity, mitochondrial haplogroups and genomic ancestry in Brazilian individuals. Plos One. 2013;8(4):e62005. doi: 10.1371/journal.pone.0062005. [DOI] [PMC free article] [PubMed] [Google Scholar]
- 16.Pritchard JK, Stephens M, Donnelly P. Inference of population structure using multilocus genotype data. Genetics. 2000;155(2):945–959. doi: 10.1093/genetics/155.2.945. [DOI] [PMC free article] [PubMed] [Google Scholar]
- 17.Falush D, Stephens M, Pritchard JK. Inference of population structure using multilocus genotype data: linked loci and correlated allele frequencies. Genetics. 2003;164(4):1567–1587. doi: 10.1093/genetics/164.4.1567. [DOI] [PMC free article] [PubMed] [Google Scholar]
- 18.Norman GR, Streiner DL. Biostatistics: the bare essentials. Ontario: Bc Decker Hamilton; 2008. [Google Scholar]
- 19.Flandre P, Marcelin AG, Pavie J, Shmidely N, Wirden M, Lada O, et al. Comparison of tests and procedures to build clinically relevant genotypic scores: application to the Jaguar study. Antivir Ther. 2005;10(4):479–487. [PubMed] [Google Scholar]
- 20.Weller EA, Ryan LM. Testing for trend with count data. Biometrics. 1998;54(2):762–773. doi: 10.2307/3109782. [DOI] [PubMed] [Google Scholar]
- 21.Bagley SC, White H, Golomb BA. Logistic regression in the medical literature: standards for use and reporting, with particular attention to one medical domain. J Clin Epidemiol. 2001;54(10):979–985. doi: 10.1016/S0895-4356(01)00372-9. [DOI] [PubMed] [Google Scholar]
- 22.Katz MH. Multivariable analysis: a practical guide for clinicians. New York: Cambridge university press; 2006. [Google Scholar]
- 23.Mackinnon A. The use and reporting of multiple imputation in medical research–a review. J Intern Med. 2010;268(6):586–593. doi: 10.1111/j.1365-2796.2010.02274.x. [DOI] [PubMed] [Google Scholar]
- 24.Miot HA. Sample size in clinical and experimental trials. J Vasc Bras. 2011;10(4):275–278. [Google Scholar]
- 25.SPSS . IBM SPSS Statistics Base 20. Chicago: SPSS Inc; 2011. [Google Scholar]
- 26.Hexsel D, Lacerda DA, Cavalcante AS, Machado Filho CA, Kalil CL, Ayres EL, et al. Epidemiology of melasma in Brazilian patients: a multicenter study. Int J Dermatol. 2014;53(4):440–444. doi: 10.1111/j.1365-4632.2012.05748.x. [DOI] [PubMed] [Google Scholar]
- 27.Sortica Vde A, Ojopi EB, Genro JP, Callegari-Jacques S, Ribeiro-Dos-Santos A, de Moraes MO, et al. Influence of genomic ancestry on the distribution of SLCO1B1, SLCO1B3 and ABCB1 gene polymorphisms among Brazilians. Basic Clin Pharmacol Toxicol. 2012;110(5):460–468. doi: 10.1111/j.1742-7843.2011.00838.x. [DOI] [PubMed] [Google Scholar]
- 28.Suarez-Kurtz G, Pena SD. Pharmacogenomics in the Americas: the impact of genetic admixture. Curr Drug Targets. 2006;7(12):1649–1658. doi: 10.2174/138945006779025392. [DOI] [PubMed] [Google Scholar]
- 29.Suarez-Kurtz G, Botton MR. Pharmacogenetics of coumarin anticoagulants in Brazilians. Expert Opin Drug Metab Toxicol. 2015;11(1):67–79. doi: 10.1517/17425255.2015.976201. [DOI] [PubMed] [Google Scholar]
- 30.Shim JK, Ackerman SL, Darling KW, Hiatt RA, Lee SS. Race and ancestry in the age of inclusion: technique and meaning in post-genomic science. J Health Soc Behav. 2014;55(4):504–518. doi: 10.1177/0022146514555224. [DOI] [PMC free article] [PubMed] [Google Scholar]
- 31.Franceschini N, Chasman DI, Cooper-Dehoff RM, Arnett DK. Genetics, ancestry, and hypertension: implications for targeted antihypertensive therapies. Curr Hypertens Rep. 2014;16(8):461. doi: 10.1007/s11906-014-0461-9. [DOI] [PMC free article] [PubMed] [Google Scholar]
- 32.Garcia P, Alencar D, Pinto P, Santos N, Salgado C, Sortica VA, et al. Haplotypes of the IL10 gene as potential protection factors in leprosy patients. Clin Vaccine Immunol. 2013;20(10):1599–1603. doi: 10.1128/CVI.00334-13. [DOI] [PMC free article] [PubMed] [Google Scholar]
- 33.Benedet AL, Moraes CF, Camargos EF, Oliveira LF, Souza VC, Lins TC, et al. Amerindian genetic ancestry protects against Alzheimer’s disease. Dement Geriatr Cogn Disord. 2012;33(5):311–317. doi: 10.1159/000339672. [DOI] [PubMed] [Google Scholar]
- 34.Sanchez E, Webb RD, Rasmussen A, Kelly JA, Riba L, Kaufman KM, et al. Genetically determined Amerindian ancestry correlates with increased frequency of risk alleles for systemic lupus erythematosus. Arthritis Rheum. 2010;62(12):3722–3729. doi: 10.1002/art.27753. [DOI] [PMC free article] [PubMed] [Google Scholar]
- 35.Seldin MF, Qi L, Scherbarth HR, Tian C, Ransom M, Silva G, et al. Amerindian ancestry in Argentina is associated with increased risk for systemic lupus erythematosus. Genes Immun. 2008;9(4):389–393. doi: 10.1038/gene.2008.25. [DOI] [PubMed] [Google Scholar]
- 36.Brum DG, Luizon MR, Santos AC, Lana-Peixoto MA, Rocha CF, Brito ML, et al. European ancestry predominates in neuromyelitis optica and multiple sclerosis patients from Brazil. Plos One. 2013;8(3):e58925. doi: 10.1371/journal.pone.0058925. [DOI] [PMC free article] [PubMed] [Google Scholar]
- 37.Guindalini C, Colugnati FA, Pellegrino R, Santos-Silva R, Bittencourt LR, Tufik S. Influence of genetic ancestry on the risk of obstructive sleep apnoea syndrome. Eur Respir J. 2010;36(4):834–841. doi: 10.1183/09031936.00146809. [DOI] [PubMed] [Google Scholar]
- 38.Cardena MM, Ribeiro-Dos-Santos A, Santos S, Mansur AJ, Pereira AC, Fridman C. Amerindian genetic ancestry is associated with higher survival rates compared to African and European ancestry in Brazilian patients with heart failure. Int J Cardiol. 2014;176(2):527–528. doi: 10.1016/j.ijcard.2014.07.039. [DOI] [PubMed] [Google Scholar]
- 39.Fernandez JR, Shiver MD. Using genetic admixture to study the biology of obesity traits and to map genes in admixed populations. Nutr Rev. 2004;62(7 Pt 2):S69–S74. doi: 10.1111/j.1753-4887.2004.tb00091.x. [DOI] [PubMed] [Google Scholar]
- 40.Vergara C, Caraballo L, Mercado D, Jimenez S, Rojas W, Rafaels N, et al. African ancestry is associated with risk of asthma and high total serum IgE in a population from the Caribbean Coast of Colombia. Hum Genet. 2009;125(5–6):565–579. doi: 10.1007/s00439-009-0649-2. [DOI] [PubMed] [Google Scholar]
- 41.Giolo SR, Soler JM, Greenway SC, Almeida MA, de Andrade M, Seidman J, et al. Brazilian urban population genetic structure reveals a high degree of admixture. Eur J Hum Genet. 2011;20(1):111–116. doi: 10.1038/ejhg.2011.144. [DOI] [PMC free article] [PubMed] [Google Scholar]
- 42.Shriver MD, Parra EJ, Dios S, Bonilla C, Norton H, Jovel C, et al. Skin pigmentation, biogeographical ancestry and admixture mapping. Hum Genet. 2003;112(4):387–399. doi: 10.1007/s00439-002-0896-y. [DOI] [PubMed] [Google Scholar]
- 43.Ramos BR, D’Elia MP, Amador MA, Santos NP, Santos SE, da Cruz CE, et al. Neither self-reported ethnicity nor declared family origin are reliable indicators of genomic ancestry. Genetica. 2016;144(3):259–265. doi: 10.1007/s10709-016-9894-1. [DOI] [PubMed] [Google Scholar]
- 44.Henn BM, Cavalli-Sforza L, Feldman MW. The great human expansion. Proc Natl Acad Sci U S A. 2012;109(44):17758–17764. doi: 10.1073/pnas.1212380109. [DOI] [PMC free article] [PubMed] [Google Scholar]
- 45.Falush D, Wirth T, Linz B, Pritchard JK, Stephens M, Kidd M, et al. Traces of human migrations in Helicobacter pylori populations. Science. 2003;299(5612):1582–1585. doi: 10.1126/science.1080857. [DOI] [PubMed] [Google Scholar]
- 46.Yin L, Coelho SG, Ebsen D, Smuda C, Mahns A, Miller SA, et al. Epidermal gene expression and ethnic pigmentation variations among individuals of Asian, European and African ancestry. Exp Dermatol. 2014;23(10):731–735. doi: 10.1111/exd.12518. [DOI] [PubMed] [Google Scholar]
- 47.Kim NH, Lee CH, Lee AY. H19 RNA downregulation stimulated melanogenesis in melasma. Pigment Cell Melanoma Res. 2010;23(1):84–92. doi: 10.1111/j.1755-148X.2009.00659.x. [DOI] [PubMed] [Google Scholar]
- 48.Kim JY, Lee TR, Lee AY. Reduced WIF-1 expression stimulates skin hyperpigmentation in patients with melasma. J Invest Dermatol. 2013;133(1):191–200. doi: 10.1038/jid.2012.270. [DOI] [PubMed] [Google Scholar]
- 49.Kang HY, Suzuki I, Lee DJ, Ha J, Reiniche P, Aubert J, et al. Transcriptional profiling shows altered expression of wnt pathway- and lipid metabolism-related genes as well as melanogenesis-related genes in melasma. J Invest Dermatol. 2011;131(8):1692–1700. doi: 10.1038/jid.2011.109. [DOI] [PubMed] [Google Scholar]
- 50.Kim NH, Choi SH, Lee TR, Lee CH, Lee AY. Cadherin 11, a miR-675 target, induces N-cadherin expression and epithelial-mesenchymal transition in melasma. J Invest Dermatol. 2014;134(12):2967–2976. doi: 10.1038/jid.2014.257. [DOI] [PubMed] [Google Scholar]
- 51.Chung BY, Noh TK, Yang SH, Kim IH, Lee MW, Yoon TJ, et al. Gene Expression Profiling in Melasma in Korean Women. Dermatology. 2014;229(4):333–342. doi: 10.1159/000365080. [DOI] [PubMed] [Google Scholar]
- 52.Kim NH, Cheong KA, Lee TR, Lee AY. PDZK1 upregulation in estrogen-related hyperpigmentation in melasma. J Invest Dermatol. 2012;132(11):2622–2631. doi: 10.1038/jid.2012.175. [DOI] [PubMed] [Google Scholar]
- 53.Mahmoud BH, Ruvolo E, Hexsel CL, Liu Y, Owen MR, Kollias N, et al. Impact of long-wavelength UVA and visible light on melanocompetent skin. J Invest Dermatol. 2010;130(8):2092–2097. doi: 10.1038/jid.2010.95. [DOI] [PubMed] [Google Scholar]
- 54.Duteil L, Cardot-Leccia N, Queille-Roussel C, Maubert Y, Harmelin Y, Boukari F, et al. Differences in visible light-induced pigmentation according to wavelengths: a clinical and histological study in comparison with UVB exposure. Pigment Cell Melanoma Res. 2014;27(5):822–826. doi: 10.1111/pcmr.12273. [DOI] [PubMed] [Google Scholar]
- 55.Lee AY. Recent progress in melasma pathogenesis. Pigment Cell Melanoma Res. 2015;28(6):648–660. doi: 10.1111/pcmr.12404. [DOI] [PubMed] [Google Scholar]
- 56.Schalka S, Steiner D, Ravelli FN, Steiner T, Terena AC, Marcon CR, et al. Brazilian consensus on photoprotection. An Bras Dermatol. 2014;89(6 Suppl 1):1–74. doi: 10.1590/abd1806-4841.20143971. [DOI] [PMC free article] [PubMed] [Google Scholar]
- 57.Alchorne MMA, Abreu MAMM. Dermatologia na pele negra. An Bras Dermatol. 2008;83(1):7–20. doi: 10.1590/S0365-05962008000100002. [DOI] [Google Scholar]
- 58.Sturm RA, Box NF, Ramsay M. Human pigmentation genetics: the difference is only skin deep. Bioessays. 1998;20(9):712–721. doi: 10.1002/(SICI)1521-1878(199809)20:9<712::AID-BIES4>3.0.CO;2-I. [DOI] [PubMed] [Google Scholar]
- 59.Muizzuddin N, Hellemans L, Van Overloop L, Corstjens H, Declercq L, Maes D. Structural and functional differences in barrier properties of African American, Caucasian and East Asian skin. J Dermatol Sci. 2010;59(2):123–128. doi: 10.1016/j.jdermsci.2010.06.003. [DOI] [PubMed] [Google Scholar]
- 60.Langton AK, Sherratt MJ, Sellers WI, Griffiths CEM, Watson REB. Geographical ancestry is a key determinant of epidermal morphology and dermal composition. Brit J Dermatol. 2014;171(2):274–282. doi: 10.1111/bjd.12860. [DOI] [PubMed] [Google Scholar]
- 61.Lee DJ, Lee J, Ha J, Park KC, Ortonne JP, Kang HY. Defective barrier function in melasma skin. J Eur Acad Dermatol Venereol. 2012;26(12):1533–1537. doi: 10.1111/j.1468-3083.2011.04337.x. [DOI] [PubMed] [Google Scholar]
- 62.Brianezi G, Handel AC, Schmitt JV, Miot LD, Miot HA. Changes in nuclear morphology and chromatin texture of basal keratinocytes in melasma. J Eur Acad Dermatol Venereol. 2015;29(4):809–812. doi: 10.1111/jdv.12453. [DOI] [PubMed] [Google Scholar]
- 63.Miot LD, Miot HA, Polettini J, Silva MG, Marques ME. Morphologic changes and the expression of alpha-melanocyte stimulating hormone and melanocortin-1 receptor in melasma lesions: a comparative study. Am J Dermatopathol. 2010;32(7):676–682. doi: 10.1097/DAD.0b013e3181cd4396. [DOI] [PubMed] [Google Scholar]
- 64.Miot LDB, Miot HA, da Silva MG, Marques MEA. Morphological and functional comparative study of melanocytes in melasma lesions. An Bras Dermatol. 2007;82(6):529–534. doi: 10.1590/S0365-05962007000600005. [DOI] [Google Scholar]
- 65.Lynch JW, Smith GD, Kaplan GA, House JS. Income inequality and mortality: importance to health of individual income, psychosocial environment, or material conditions. BMJ. 2000;320(7243):1200–1204. doi: 10.1136/bmj.320.7243.1200. [DOI] [PMC free article] [PubMed] [Google Scholar]
Associated Data
This section collects any data citations, data availability statements, or supplementary materials included in this article.
Data Availability Statement
Data from this study are freely available and can be obtained by contacting the corresponding author.