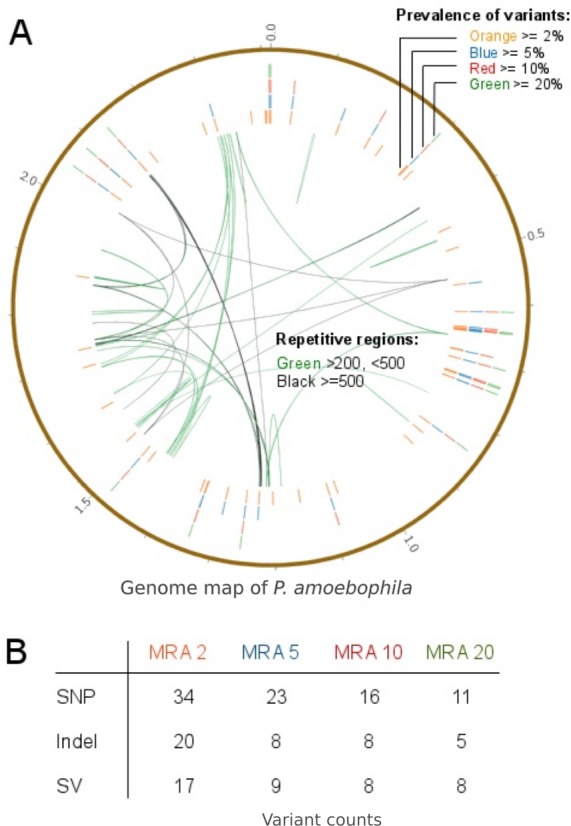
Figure 9. Prevalence of variants within a long-term culture with respect to their MRAs.

(A) shows the prevalence of variations at MRAs of 20%, 10%, 5% or 2%, which are visible in the four differently colored outer circles and the presence of repetitive regions within the reference genome (inner connective lines). (B) shows a more detailed view of the number of variations found at MRAs of 20%, 10%, 5% and 2%.
