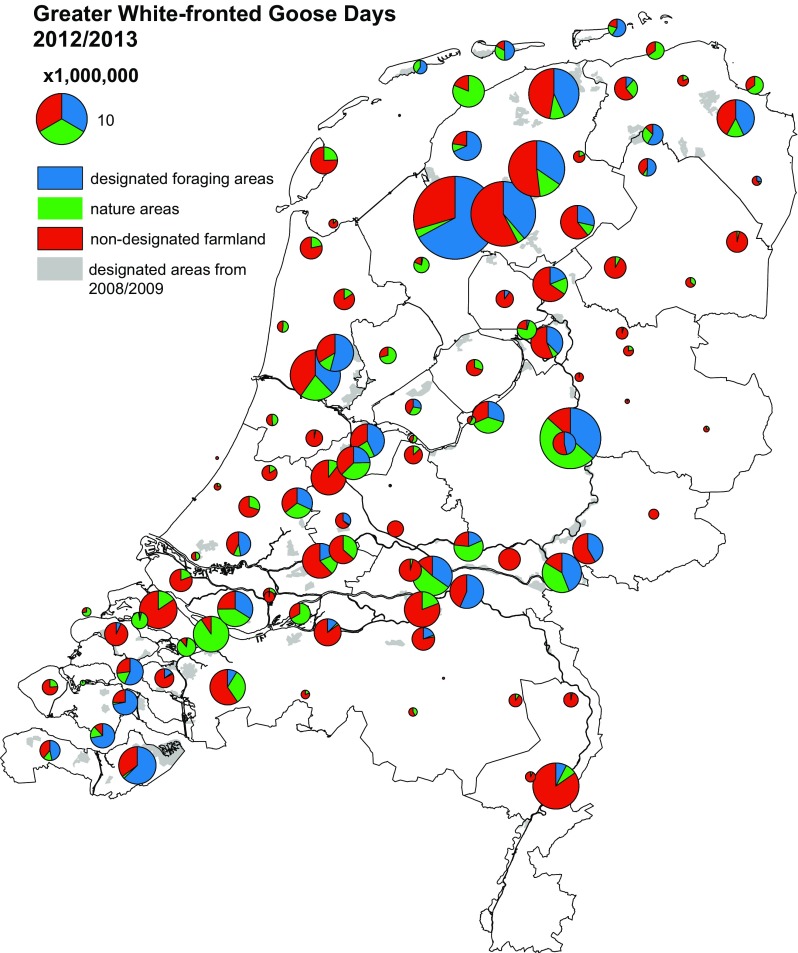
Fig. 3.
Distribution of geese in The Netherlands from October 2012 to March 2013, as an example of goose distribution during the new management scheme. The size of each dot represents the total number of white-fronted goose days (for species mentioned in Table 1) aggregated by main census region and divided into designated goose foraging areas in farmland and in nature reserves, and farmland not designated as goose foraging area. Designated goose foraging areas are shaded grey

