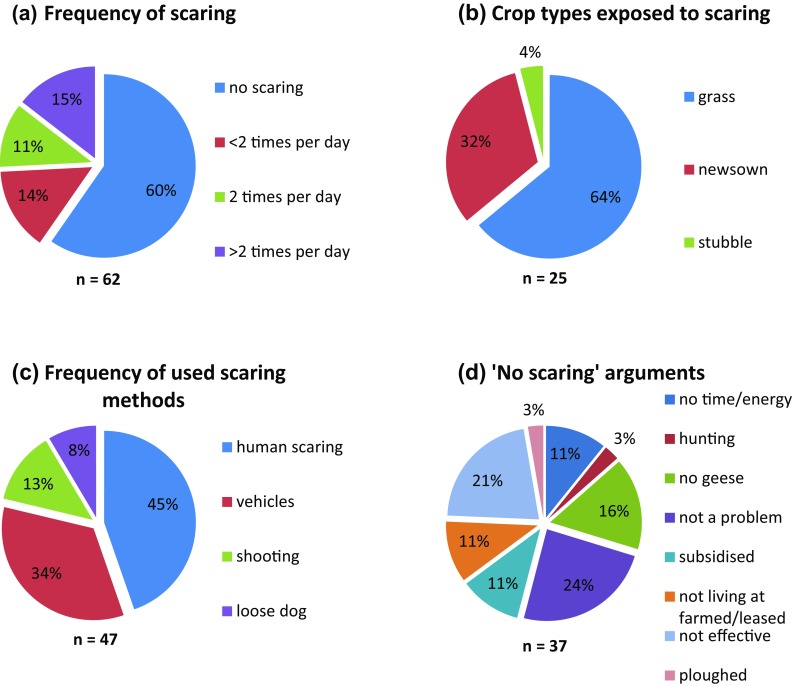
Fig. 2.

Pie charts showing the distribution of answers (%) from farmers involved in the study with regard to daily frequency of scaring (a), crop types exposed to scaring (b), scaring methods used (c) and arguments for why not scaring geese (d). n shows sample size (note: several farmers use multiple scaring methods, hence the larger sample size in 1c)
