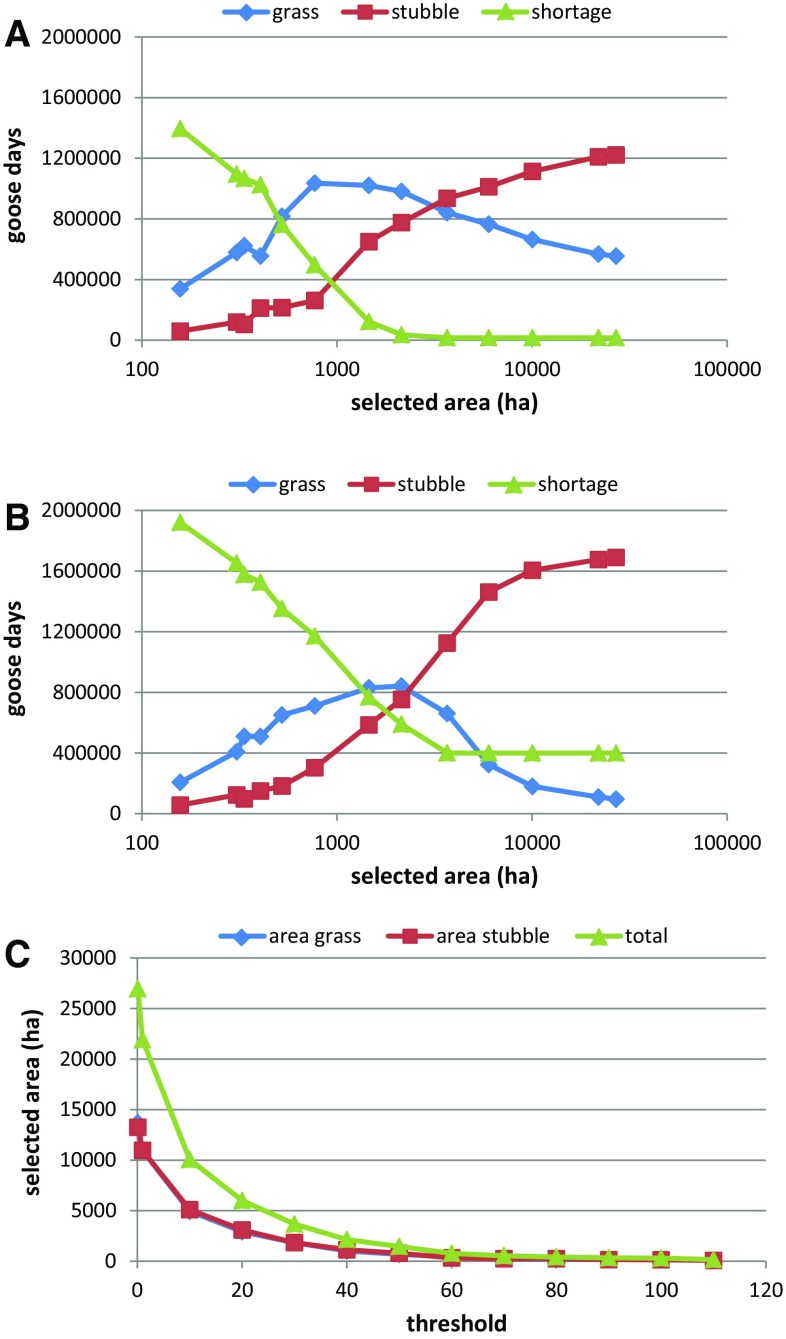
Fig. 2.
Results of running the resource depletion model on an increasing refuge area, when fields are added following the prioritization suggested by the species distribution model (SDM). Total numbers of goose days accommodated on grass and cereal fields, and the shortage (unaccommodated goose days) for 2009 (a) and 2013 (b). c The relationship between selected refuge area distinguishing between grassland, cereal fields and total area, and the applied threshold value for suitability. All values are averages over 5 runs

