

Abstract
IMPORTANCE
Clinicians have been urged to delay the use of obstetric interventions (eg, labor induction, cesarean delivery) until 39 weeks or later in the absence of maternal or fetal indications for intervention.
OBJECTIVE
To describe recent trends in late preterm and early term birth rates in 6 high-income countries and assess association with use of clinician-initiated obstetric interventions.
DESIGN
Retrospective analysis of singleton live births from 2006 to the latest available year (ranging from 2010 to 2015) in Canada, Denmark, Finland, Norway, Sweden, and the United States.
EXPOSURES
Use of clinician-initiated obstetric intervention (either labor induction or prelabor cesarean delivery) during delivery.
MAIN OUTCOMES AND MEASURES
Annual country-specific late preterm (34–36 weeks) and early term (37–38 weeks) birth rates.
RESULTS
The study population included 2 415 432 Canadian births in 2006–2014 (4.8% late preterm; 25.3% early term); 305 947 Danish births in 2006–2010 (3.6% late preterm; 18.8% early term); 571 937 Finnish births in 2006–2015 (3.3% late preterm; 16.8% early term); 468 954 Norwegian births in 2006–2013 (3.8% late preterm; 17.2% early term); 737 754 Swedish births in 2006–2012 (3.6% late preterm; 18.7% early term); and 25 788 558 US births in 2006–2014 (6.0% late preterm; 26.9% early term). Late preterm birth rates decreased in Norway (3.9% to 3.5%) and the United States (6.8% to 5.7%). Early term birth rates decreased in Norway (17.6% to 16.8%), Sweden (19.4% to 18.5%), and the United States (30.2% to 24.4%). In the United States, early term birth rates decreased from 33.0% in 2006 to 21.1% in 2014 among births with clinician-initiated obstetric intervention, and from 29.7% in 2006 to 27.1% in 2014 among births without clinician-initiated obstetric intervention. Rates of clinician-initiated obstetric intervention increased among late preterm births in Canada (28.0% to 37.9%), Denmark (22.2% to 25.0%), and Finland (25.1% to 38.5%), and among early term births in Denmark (38.4% to 43.8%) and Finland (29.8% to 40.1%).
CONCLUSIONS AND RELEVANCE
Between 2006 and 2014, late preterm and early term birth rates decreased in the United States, and an association was observed between early term birth rates and decreasing clinician-initiated obstetric interventions. Late preterm births also decreased in Norway, and early term births decreased in Norway and Sweden. Clinician-initiated obstetric interventions increased in some countries but no association was found with rates of late preterm or early term birth.
Late preterm and early term births are of emerging clinical and public health importance and concern due to the associated risks of adverse neonatal and childhood outcomes.1,2 Preterm and early term births may occur spontaneously or be initiated by clinicians through the use of obstetric interventions such as labor induction or cesarean delivery. In the case of maternal or fetal clinical indications (eg, preeclampsia or fetal growth restriction), obstetric interventions may be medically indicated or nonelective.2 In the United States, clinicians have been urged to reduce nonmedically indicated or elective deliveries before 39 weeks.3,4
Increasing US preterm birth rates from the 1990s to the mid-2000s were attributed in part to changes in the use of obstetric interventions.5–8 Recently, declines in both spontaneous preterm births and preterm births that involved induction or cesarean delivery were documented in the United States over 2005–2012.9 Several recent US-based hospital and regional studies have documented reductions in elective obstetric intervention at early term gestations,10–12 but these trends have not been examined at the national level. The relationships between use of obstetric interventions and national-level late preterm and early term birth rates have not been examined in other high-income countries where obstetric intervention practices may be similar to the United States.
This study described temporal trends since 2006 in late preterm and early term birth rates across 6 high-income countries in North America and Europe, and assessed the association between these temporal trends and changes in the use of clinician-initiated obstetric interventions.
Methods
This study was conducted using national and population-based birth registry data from 2006 to the most recent available year in Canada, Denmark, Finland, Norway, Sweden, and the United States. Canadian data were from hospitalization records in the Canadian Institute for Health Information Discharge Abstract Database, including all hospital live births in all Canadian provinces and territories except Quebec. Danish, Finnish, Norwegian, and Swedish data were from nationwide medical birth registers that collect infant and maternal data by mandatory reporting.13,14 US data were from the National Center for Health Statistics natality public use files containing birth certificate data for more than 99% of US births.
This study used deidentified, aggregated data sets; it was reviewed by the Emory institutional review board and determined not to be human participant research. The study population included singleton live births delivered at 22 or more completed weeks of gestation and weighing 500 g or more at birth. Births were excluded if missing information on gestational age or birth weight, or if reported birth weight was implausible for gestational age.15
Outcomes were annual country-specific late preterm and early term birth rates. The late preterm birth rate was the percentage of all singleton live births that occurred at 34 to 36 completed weeks of gestation. The early term birth rate was the percentage of all singleton live births that occurred at 37 to 38 completed weeks of gestation.
Gestational age was determined using an ultrasound- or clinical-based estimate as available in each country. In Denmark, gestational age was estimated from ultrasound dating prior to 24 weeks or from the first day of the last menstrual period. In Canada, Finland, Norway, and Sweden, gestational age estimates were primarily based on ultrasound dating during the first or early second trimester.16 In the United States, the best obstetric estimate of gestation (determined by birth attendants based on all perinatal factors and assessments) was used.17
Clinician-initiated obstetric intervention was defined as the presence of either labor induction or prelabor cesarean delivery. In Canada, induction of labor was identified based on Canadian Classification of Health Interventions (CCI) codes. Prelabor cesarean deliveries were identified as cesarean deliveries without signs of labor using CCI and International Classification of Disease and Related Health Problems, 10th Revision, Canada (ICD-10-CA) codes. In Denmark, the medical birth register contained codes for prelabor induction and cesarean section. In Finland, planned cesarean delivery was reported if the decision on cesarean delivery was made before the start of labor, and there was a checkbox for labor induction. In Norway, checkboxes for onset of labor (spontaneous onset, labor induction, or cesarean delivery) and cesarean delivery (acute or elective) were used. In Sweden, birth registrations included variables for mode of delivery denoting start (elective cesarean delivery, labor induction, or spontaneous) and end (cesarean delivery or vaginal delivery) of delivery. In the United States, there was a checkbox for labor induction. Prelabor cesarean deliveries were cesarean deliveries with the birth certificate checkbox for “trial of labor attempted” marked “no.” Because this checkbox was added to the 2003 revision of the US live birth certificate, analyses were restricted to US births reported on the 2003 revision. The proportion of total US births included increased from 49% in 2006 to 96% in 2014 as additional states adopted the revised birth certificate.18 In a sensitivity analysis, US analyses were restricted to births in states that reported on the 2003 revision for all study years to ensure that changes to the states included in the analyses due to variable time of adoption of the 2003 revised birth certificate did not drive the results of the main analyses.
For all countries, data were obtained in aggregated data sets with counts of births in strata defined by cross-tabulations of year, gestational age category, labor induction, mode of delivery (vaginal delivery; cesarean delivery without trial of labor/elective cesarean delivery; cesarean delivery with trial of labor/emergency cesarean delivery; cesarean delivery, unknown whether elective or emergency), mother’s age at delivery (≤17, 18–19, 20–24, 25–34, ≥35 years), and parity (first, second or third, fourth or above live birth). Canadian and Danish data sets were provided with suppression of all strata with 1–4 for Canada or 1–3 for Denmark birth counts. Counts were imputed for these strata by randomly assigning integer values 1–4 for Canada and 1–3 for Denmark to the suppressed strata.
Statistical Analyses
Country-level yearly rates of late preterm birth and early term birth, as well as rates of labor induction, prelabor cesarean delivery, and the combined outcome of clinician-initiated obstetric intervention among late preterm births and among early term births, were computed. Country-level rate ratios (RRs) for the annual rates of change in late preterm and early term birth rates over the study period were estimated using negative binomial regression with year as a continuous variable. In addition to RRs representing average annual rate of change for each country, summary RRs were computed to represent the total change in rate from the first to the last year of each country’s observed study period (eg, 8-year change for countries with data for 2006–2014). Because countries varied in years of available data, summary RRs were not directly comparable across countries. Base models were unadjusted (Model 0) to quantify the crude trend in rates, and Model 1 was adjusted for potential individual-level covariates that may have differed across countries (ie, mother’s age at delivery, parity). Model 2 was further adjusted for clinician-initiated intervention to assess whether temporal trends in obstetric intervention were associated with concurrent changes in the late preterm or early term birth rates. If changes in obstetric intervention practices were associated with observed changes in late preterm or early term birth rates, adjustment for this variable would shift estimated RRs toward the null. Multiplicative interaction terms between year of delivery and clinician-initiated obstetric intervention were added to Model 2 to test whether the rate of change in late preterm or early term birth rate over the study period differed between births with and without clinician-initiated intervention (Model 3).
Adjusted analyses were based on births with complete data. Data were missing for clinician-initiated intervention, mother’s age at delivery, and parity in a small proportion of births. Parity data were missing for 22% (n = 519 918) of Canadian births; these births were similar to complete cases in terms of gestational age, clinician-initiated obstetric intervention, and mother’s age at delivery. In a sensitivity analysis, multiple imputation was conducted for missing parity data using the monotone discriminant function method based on observed values of the other analytic variables.19 In 0.3% of the Norwegian cesarean deliveries and 2.3% of the US cesarean deliveries, information was missing on whether labor was attempted prior to delivery (United States) or whether it was an elective or emergency cesarean delivery (Norway). The primary analyses took the conservative approach of treating these births as emergency cesarean deliveries, potentially underestimating clinician-initiated obstetric interventions. In sensitivity analyses, these births were treated as all involving clinician-initiated obstetric intervention or all missing mode of delivery.
Analyses were conducted using SAS (SAS Institute), version 9.4. Results were considered statistically significant at an α of less than .05 (2-sided).
Results
The study population included singleton live births during 2006–2014 in Canada (n = 2 415 432); 2006–2010 in Denmark (n = 305 947); 2006–2015 in Finland (n = 571 937); 2006–2013 in Norway (n = 468 954); 2006–2012 in Sweden (n = 737 754); and 2006–2014 in the United States (n = 25 788 558). Imputed birth counts represented less than 1% of births in both Canada (n = 1556) and Denmark (n = 659). Less than 2.5% of singleton live births in each country were excluded due to missing information on gestational age or birth weight, or if reported birth weight was implausible for gestational age (eTable 1 in the Supplement). Results of the sensitivity analysis restricting US analyses to births in states that reported on the 2003 revised live birth certificate for all study years were similar to the main results (eTables 2–3 in the Supplement).
Late preterm birth rates pooled over the years of available data for each country were 4.8% in Canada, 3.6% in Denmark, 3.3% in Finland, 3.8% in Norway, 3.6% in Sweden, and 6.0% in the United States (Table 1). Adjusting for mother’s age at delivery and parity, late preterm birth rates significantly decreased in Norway (annual decrease of 2.9% [95% CI, 0.4% to 5.3%] from 3.9% in 2006 to 3.5% in 2013) and the United States (annual decrease of 1.6% [95% CI, 0.9% to 2.3%] from 6.8% in 2006 to 5.7% in 2014) (Table 2, Model 1).
Table 1.
Temporal Trends in Country-Level Gestational Age Distribution, 2006–2015
| No. of Births (%) | |||||||||||
|---|---|---|---|---|---|---|---|---|---|---|---|
| 2006 | 2007 | 2008 | 2009 | 2010 | 2011 | 2012 | 2013 | 2014 | 2015 | All Years | |
| Canada | |||||||||||
| Very or moderately Preterm (22 to <34 wk) |
4004 (1.6) |
4114 (1.6) |
4201 (1.5) |
4181 (1.5) |
3973 (1.5) |
3941 (1.5) |
3953 (1.5) |
3297 (1.5) |
4006 (1.5) |
36300 (1.5) |
|
| Late preterm (34 to ≤36 wk) |
12 622 (5.0) |
12 894 (4.9) |
13 608 (5.0) |
13 216 (4.8) |
13 028 (4.8) |
12 743 (4.7) |
13 089 (4.9) |
12 972 (4.8) |
12 971 (4.7) |
117 143 (4.8) |
|
| Early term (37 to ≤39 wk) |
63 009 (24.9) |
65 711 (24.9) |
69 838 (25.6) |
68 141 (24.9) |
68 443 (25.3) |
68 729 (25.5) |
70 129 (26.0) |
67 968 (25.3) |
69323 (25.3) |
611 291 (25.3) |
|
| Term (39 to ≤41 wk) |
172 067 (68.0) |
179 977 (68.2) |
184 066 (67.4) |
186 853 (68.3) |
183 549 (67.9) |
183 274 (67.9) |
181 440 (67.3) |
183 115 (68.1) |
186 263 (68.1) |
1 640 604 (67.9) |
|
| Postterm (42 wk and later) |
1192 (0.5) |
1263 (0.5) |
1191 (0.4) |
1217 (0.4) |
1180 (0.4) |
1045 (0.4) |
962 (0.4) |
1055 (0.4) |
989 (0.4) |
10 094 (0.4) |
|
| All singleton live birthsa | 252 894 | 263 959 | 272 904 | 273 608 | 270 173 | 269 732 | 269 573 | 269 037 | 273 552 | 2 415 432 | |
| Denmark | |||||||||||
| Very or moderately preterm (22 to <34 wk) |
768 (1.2) |
844 (1.4) |
805 (1.3) |
758 (1.3) |
791 (1.3) |
3966 (1.3) |
|||||
| Late preterm (34 to ≤36 wk) |
2306 (3.7) |
2300 (3.8) |
2179 (3.5) |
2131 (3.6) |
2130 (3.5) |
11 046 (3.6) |
|||||
| Early term (37 to <39 wk) |
11 954 (19.3) |
12 002 (19.6) |
11 537 (18.6) |
11 070 (18.5) |
10 982 (18.1) |
57 545 (18.8) |
|||||
| Term (39 to ≤41 wk) |
43 401 (69.9) |
42 508 (69.4) |
43 776 (70.6) |
42 377 (70.7) |
43 147 (71.2) |
215 209 (70.3) |
|||||
| Postterm (42 wk and later) |
3665 (5.9) |
3591 (5.9) |
3695 (6.0) |
3641 (6.1) |
3589 (5.9) |
18 181 (5.9) |
|||||
| All singleton live births | 62 094 | 61 245 | 61 992 | 59 977 | 60 639 | 305 947 | |||||
| Finland | |||||||||||
| Very or moderately preterm (22 to <34 wk) |
591 (1.0) |
593 (1.0) |
583 (1.0) |
634 (1.1) |
603 (1.0) |
632 (1.1) |
608 (1.0) |
577 (1.0) |
581 (1.0) |
579 (1.1) |
5981 (1.0) |
| Late preterm (34 to ≤36 wk) |
1929 (3.4) |
1822 (3.2) |
1891 (3.3) |
1852 (3.2) |
1958 (3.3) |
1851 (3.2) |
1907 (3.3) |
1896 (3.3) |
1957 (3.5) |
1811 (3.4) |
18 874 (3.3) |
| Early term (37 to <39 wk) |
9620 (17.0) |
9313 (16.5) |
9615 (16.6) |
9706 (16.5) |
9518 (16.1) |
9663 (16.6) |
9595 (16.5) |
9634 (17.0) |
9871 (17.6) |
9369 (17.4) |
95 904 (16.8) |
| Term (39 to ≤41 wk) |
41 695 (73.5) |
41 674 (73.7) |
42 667 (73.9) |
43 447 (73.9) |
44 289 (74.7) |
43 414 (74.5) |
43 444 (74.9) |
42 087 (74.2) |
41 282 (73.7) |
39 960 (74.1) |
423 959 (74.1) |
| Postterm (42 wk and later) |
2896 (5.1) |
3106 (5.5) |
2996 (5.2) |
3137 (5.3) |
2890 (4.9) |
2718 (4.7) |
2439 (4.2) |
2527 (4.5) |
2309 (4.1) |
2201 (4.1) |
27 219 (4.8) |
| All singleton live births | 56 731 | 56 508 | 57 752 | 58 776 | 59 258 | 58 278 | 57 993 | 56 721 | 56 000 | 53 920 | 571 937 |
| Norway | |||||||||||
| Very or moderately preterm (22 to <34 wk) |
891 (1.6) |
1014 (1.8) |
954 (1.6) |
899 (1.5) |
929 (1.5) |
846 (1.4) |
857 (1.5) |
844 (1.5) |
7234 (1.5) |
||
| Late preterm (34 to ≤36 wk) |
2237 (3.9) |
2274 (4.0) |
2285 (3.9) |
2266 (3.7) |
2205 (3.7) |
2084 (3.5) |
2192 (3.7) |
2043 (3.5) |
17 586 (3.8) |
||
| Early term (37 to <39 wk) |
9971 (17.6) |
10 183 (18.0) |
10 802 (18.3) |
10 474 (17.3) |
10 009 (16.6) |
9591 (16.2) |
9914 (16.8) |
9689 (16.8) |
80 633 (17.2) |
||
| Term (39 to ≤41 wk) |
39 466 (69.5) |
39 287 (69.4) |
41 145 (69.8) |
43 025 (71.2) |
43 429 (72.1) |
43 729 (74.0) |
43 886 (74.3) |
43 073 (74.5) |
337 040 (71.9) |
||
| Postterm (42 wk and later) |
4212 (7.4) |
3837 (6.8) |
3728 (6.3) |
3787 (6.3) |
3643 (6.0) |
2843 (4.8) |
2241 (3.8) |
2170 (3.8) |
26 461 (5.6) |
||
| All singleton live births | 56 777 | 56 595 | 58 914 | 60 451 | 60 215 | 59 093 | 59 090 | 57 819 | 468 954 | ||
| Sweden | |||||||||||
| Very or moderately preterm (22 to <34 wk) |
1304 (1.3) |
1264 (1.2) |
1290 (1.2) |
1271 (1.2) |
1347 (1.2) |
1261 (1.2) |
1250 (1.2) |
8987 (1.2) |
|||
| Late preterm (34 to ≤36 wk) |
3703 (3.7) |
3663 (3.6) |
3765 (3.6) |
3799 (3.6) |
3872 (3.5) |
3809 (3.5) |
3719 (3.5) |
26 330 (3.6) |
|||
| Early term (37 to <39 wk) |
19 662 (19.5) |
19 846 (19.4) |
19 550 (18.7) |
19 647 (18.6) |
20 305 (18.3) |
19 531 (18.2) |
19 564 (18.5) |
138 105 (18.7) |
|||
| Term (39 to ≤41 wk) |
69 232 (68.6) |
70 567 (69.0) |
72 540 (69.4) |
73 541 (69.6) |
77 816 (70.1) |
75 780 (70.6) |
74 632 (70.4) |
514 108 (69.7) |
|||
| Postterm (42 wk and later) |
7068 (7.0) |
6914 (6.8) |
7324 (7.0) |
7465 (7.1) |
7617 (6.9) |
7019 (6.5) |
6817 (6.4) |
50 224 (6.8) |
|||
| All singleton live births | 100 969 | 102 254 | 104 469 | 105 723 | 110 957 | 107 400 | 105 982 | 737 754 | |||
| United States | |||||||||||
| Very or moderately Preterm (22 to <34 wk) |
31 833 (2.2) |
46 987 (2.1) |
53 161 (2.0) |
53 590 (2.0) |
59 913 (2.0) |
64 685 (2.0) |
66 690 (2.0) |
67 472 (2.0) |
72 433 (2.0) |
516 764 (2.0) |
|
| Late preterm (34 to ≤36 wk) |
98 270 (6.8) |
145 214 (6.4) |
166 598 (6.3) |
163 507 (6.1) |
178 439 (6.0) |
190 121 (5.8) |
194 010 (5.8) |
194 246 (5.7) |
210 178 (5.7) |
1 540 583 (6.0) |
|
| Early term (37 to <39 wk) |
453 138 (31.2) |
688 224 (30.2) |
793 539 (30.0) |
771 794 (28.6) |
811 666 (27.3) |
839 424 (25.7) |
839 438 (25.0) |
835 200 (24.4) |
902 958 (24.4) |
6 935 381 (26.9) |
|
| Term (39 to ≤41 wk) |
860 288 (59.2) |
1 386 483 (60.8) |
1 618 195 (61.1) |
1 698 678 (62.9) |
1 909 485 (64.2) |
2 152 010 (66.0) |
2 240 130 (66.8) |
2 307 600 (67.5) |
2 500 221 (67.6) |
16 673 090 (64.7) |
|
| Postterm (42 wk and later) |
8547 (0.6) |
14 404 (0.6) |
14 989 (0.6) |
13 970 (0.5) |
14 015 (0.5) |
14 342 (0.4) |
14 092 (0.4) |
13 715 (0.4) |
14 666 (0.4) |
122 740 (0.5) |
|
| All singleton live births | 1 452 076 | 2 281 312 | 2 646 482 | 2 701 539 | 2 973 518 | 3 260 582 | 3 354 360 | 3 418 233 | 3 700 456 | 25 788 558 | |
Singleton live births with missing gestational age or birth weight were excluded from all analyses.
Table 2.
Temporal Trends in Country-Level Rates of Late Preterm and Early Term Birth, 2006–2015
| RR (95% CI) | ||||||
|---|---|---|---|---|---|---|
| Model 0a | Model 1b | Model 2c | Model 3d | |||
| Intervention | No Intervention | P Value for Interaction | ||||
| Late Preterm Birth Rate | ||||||
| Canada | ||||||
| 1-y changee | 0.998 (0.982–1.014) | 0.995 (0.978–1.013) | 0.999 (0.982–1.015) | 1.014 (0.992–1.037) | 0.979 (0.955–1.004) | .04 |
| 8-y change (2006–2014)f |
0.982 (0.865–1.114) | 0.964 (0.835–1.112) | 0.988 (0.865–1.129) | 1.119 (0.936–1.337) | 0.846 (0.694–1.033) | |
| Denmark | ||||||
| 1-y change | 0.947 (0.891–1.006) | 0.950 (0.896–1.008) | 0.950 (0.898–1.006) | 0.913 (0.845–0.987) | 0.993 (0.916–1.078) | .14 |
| 4-y change (2006–2010) |
0.804 (0.631–1.024) | 0.816 (0.645–1.032) | 0.816 (0.651–1.022) | 0.695 (0.509–0.949) | 0.974 (0.702–1.350) | |
| Finland | ||||||
| 1-y change | 1.010 (0.991–1.029) | 1.011 (0.993–1.030) | 1.012 (0.994–1.031) | 1.014 (0.989–1.039) | 1.011 (0.984–1.038) | .87 |
| 9-y change (2006–2015) |
1.089 (0.921–1.289) | 1.107 (0.938–1.307) | 1.116 (0.947–1.314) | 1.130 (0.903–1.413) | 1.099 (0.864–1.399) | |
| Norway | ||||||
| 1-y change | 0.971 (0.946–0.996) | 0.971 (0.947–0.996) | 0.970 (0.946–0.995) | 0.953 (0.922–0.986) | 0.990 (0.955–1.027) | .14 |
| 7-y change (2006–2013) |
0.811 (0.678–0.969) | 0.814 (0.684–0.970) | 0.810 (0.680–0.964) | 0.716 (0.564–0.907) | 0.934 (0.724–1.205) | |
| Sweden | ||||||
| 1-y change | 0.982 (0.955–1.010) | 0.983 (0.955–1.012) | 0.995 (0.966–1.025) | 0.994 (0.955–1.035) | 0.997 (0.954–1.042) | .93 |
| 6-y change (2006–2012) |
0.897 (0.756–1.063) | 0.901 (0.757–1.072) | 0.973 (0.814–1.162) | 0.965 (0.760–1.226) | 0.982 (0.753–1.280) | |
| United States | ||||||
| 1-y change | 0.985 (0.977–0.992) | 0.984 (0.977–0.991) | 0.985 (0.977–0.992) | 0.984 (0.975–0.994) | 0.986 (0.974–0.998) | .80 |
| 8-y change (2006–2014) |
0.884 (0.831–0.941) | 0.881 (0.832–0.933) | 0.885 (0.833–0.940) | 0.879 (0.813–0.951) | 0.894 (0.811–0.984) | |
| Early Term Birth Rate | ||||||
| Canada | ||||||
| 1-y change | 1.004 (0.994–1.014) | 1.001 (0.991–1.012) | 1.002 (0.993–1.012) | 0.995 (0.982–1.008) | 1.013 (0.998–1.028) | .07 |
| 8-y change (2006–2014) |
1.030 (0.950–1.118) | 1.011 (0.927–1.103) | 1.020 (0.944–1.102) | 0.960 (0.868–1.062) | 1.108 (0.984–1.248) | |
| Denmark | ||||||
| 1-y change | 0.990 (0.948–1.034) | 0.990 (0.949–1.032) | 0.986 (0.953–1.020) | 0.998 (0.954–1.042) | 0.970 (0.920–1.023) | .43 |
| 4-y change (2006–2010) |
0.960 (0.807–1.143) | 0.959 (0.810–1.135) | 0.946 (0.826–1.084) | 0.990 (0.830–1.181) | 0.886 (0.716–1.097) | |
| Finland | ||||||
| 1-y change | 1.007 (0.997–1.017) | 1.005 (0.997–1.014) | 1.004 (0.997–1.012) | 1.006 (0.996–1.016) | 1.003 (0.992–1.013) | .65 |
| 9-y change (2006–2015) |
1.062 (0.970–1.163) | 1.050 (0.975–1.131) | 1.040 (0.975–1.108) | 1.054 (0.967–1.149) | 1.022 (0.929–1.125) | |
| Norway | ||||||
| 1-y change | 0.978 (0.960–0.997) | 0.977 (0.960–0.995) | 0.979 (0.964–0.994) | 0.969 (0.950–0.989) | 0.991 (0.969–1.015) | .16 |
| 7-y change (2006–2013) |
0.857 (0.750–0.980) | 0.851 (0.750–0.965) | 0.861 (0.773–0.958) | 0.804 (0.697–0.927) | 0.940 (0.799–1.107) | |
| Sweden | ||||||
| 1-y change | 0.976 (0.954–0.999) | 0.975 (0.952–0.998) | 0.983 (0.963–1.003) | 0.973 (0.948–1.000) | 0.996 (0.965–1.028) | .27 |
| 6-y change (2006–2012) |
0.865 (0.754–0.993) | 0.858 (0.746–0.986) | 0.902 (0.798–1.020) | 0.851 (0.724–1.000) | 0.978 (0.810–1.181) | |
| United States | ||||||
| 1-y change | 0.962 (0.958–0.966) | 0.963 (0.959–0.966) | 0.961 (0.957–0.964) | 0.947 (0.942–0.951) | 0.982 (0.977–0.987) | <.001 |
| 8-y change (2006–2014) |
0.734 (0.709–0.760) | 0.738 (0.717–0.759) | 0.724 (0.704–0.745) | 0.644 (0.622–0.667) | 0.865 (0.829–0.902) | |
Abbreviation: RR, rate ratio.
Unadjusted.
Adjusted for age and parity.
Adjusted for age, parity, and clinician-initiated obstetric intervention.
Adjusted for age, parity, and clinician-initiated obstetric intervention, including interaction between year of delivery and clinician-initiated obstetric intervention.
RR represents the annual rate of change in late preterm or early term birth rate over the years of data available for each country. These annual rates of change are approximately comparable across countries.
RR represents the total estimated change in late preterm or early term birth rate over the entire specified study period observed for each country. Total estimated changes over the observed study periods may not be directly comparable across countries due to differing lengths of follow-up.
Early term birth rates pooled over the years of available data for each country were 25.3% in Canada, 18.8% in Denmark, 16.8% in Finland, 17.2% in Norway, 18.7% in Sweden, and 26.9% in the United States. Adjusting for mother’s age at delivery and parity, early term birth rates significantly decreased in Norway (annual decrease of 2.3% [95% CI, 0.5% to 4.0%] from 17.6% in 2006 to 16.8% in 2013), Sweden (annual decrease of 2.5% [95% CI, 0.2% to 4.8%] from 19.5% in 2006 to 18.5% in 2012), and the United States (annual decrease of 3.7% [95% CI, 3.4% to 4.1%] from 31.2% in 2006 to 24.4% in 2014) (Table 2, Model 1).
Mean rates of clinician-initiated obstetric intervention among late preterm and early term births as well as trends in those rates over the study period varied across countries (Figure; eTable 4 in the Supplement). The United States had the highest rates of clinician-initiated obstetric intervention among late preterm births; 44.1% of late preterm births in 2006–2014 involved clinician-initiated obstetric intervention.
Figure. Temporal Trends in Country-Level Rates of Labor Induction, Prelabor Cesarean Delivery, and Clinician-Initiated Obstetric Intervention Among Late Preterm Births and Early Term Births, 2006–2015.
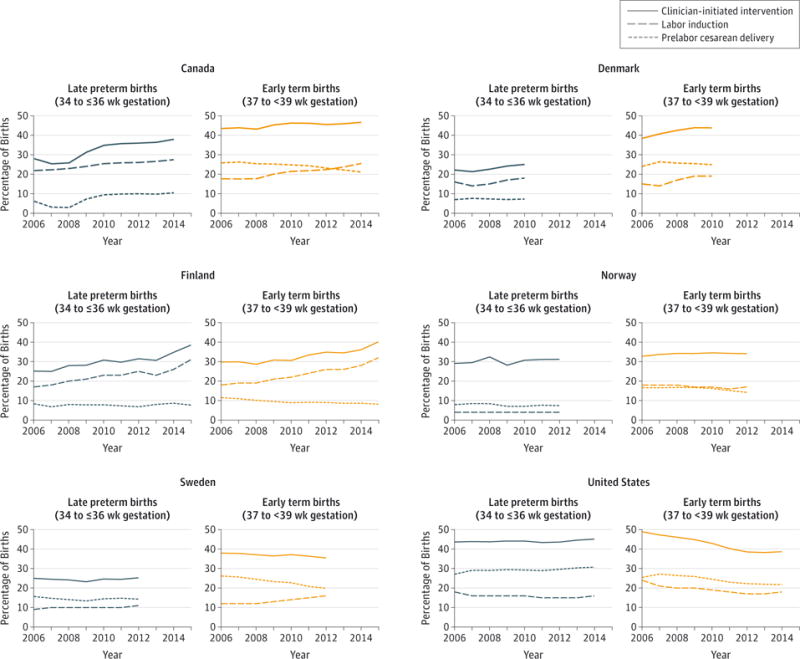
For denominator data, see Table 1.
Increases in clinician-initiated obstetric interventions among late preterm births were observed in Canada (28.0% in 2006 to 37.9% in 2014), Denmark (22.2% in 2006 to 25.0% in 2010) and Finland (25.1% in 2006 to 38.5% in 2015), although there was no significant change in late preterm birth rates in those countries over the study period (Table 2, Model 1). Increasing prevalence of intervention in Canada reflected increasing rates of both prelabor cesarean delivery and labor induction, whereas increases in Denmark and Finland reflected increasing rates of labor induction.
Early term births generally had higher rates of clinician-initiated obstetric intervention compared with late preterm births, although in the United States this pattern reversed after 2009 (Figure; eTable 4 in the Supplement). Rates of clinician-initiated obstetric intervention among early term births were highest in Canada (45.2% among early term births in 2006–2014), Denmark (41.8% of early term births in 2006–2010), and the United States (42.4% of early term births in 2006–2014). Increasing rates of clinician-initiated obstetric intervention among early term births were observed in Denmark (38.4% in 2006 to 43.8% in 2010) and Finland (29.8% in 2006 to 40.1% in 2015), reflecting increases in labor induction, although no significant change was observed in early term birth rate over the same period (Table 2, Model 1). In contrast, rates of clinician-initiated obstetric intervention declined among US early term births (48.9% in 2006 to 38.7% in 2014), reflecting declines in both labor induction and prelabor cesarean delivery, in tandem with the significant decrease observed in early term birth rate (Table 2, Model 1).
Adjusting for clinician-initiated obstetric intervention did not change estimated RRs for temporal change in late preterm birth rates (Table 2, Model 2). A significant interaction between year of delivery and clinician-initiated obstetric intervention was found for Canada (P = .04), indicating that estimated changes in late preterm birth rate were different comparing births with and without clinician-initiated obstetric intervention. Across all Canadian births, no significant change was observed in late preterm birth rate over 2006–2014. This overall null effect appeared to reflect a nonsignificant annual increase of 1.4% (95% CI, −0.8% to 3.7%) in late preterm birth rates among births with clinician-initiated obstetric intervention, combined with a nonsignificant annual decrease of 2.1% (95% CI, −4.5% to 0.4%) among births without clinician-initiated obstetric intervention (Table 2, Model 3). Over the 8-year study period in Canada, late preterm birth rates increased by 11.9% (95% CI, −6.4% to 33.7%) among births with clinician-initiated obstetric intervention but decreased by 15.4% (95% CI, −30.6% to 3.3%) among births without clinician-initiated obstetric intervention (Table 2, Model 3). In absolute terms, unadjusted late preterm birth rates increased from 4.3% in 2006 to 4.7% in 2014 among births with clinician-initiated obstetric intervention but decreased from 5.3% in 2006 to 4.8% in 2014 among births without clinician-initiated obstetric intervention (eTable 5 in the Supplement).
Adjusting for clinician-initiated obstetric intervention did not change estimated RRs for temporal change in early term birth rates (Table 2, Model 2). A significant interaction between year of delivery and obstetric intervention was observed in the United States (P < .001): an annual decrease of 5.3% (95% CI, 4.9% to 5.8%) in early term birth rates among births with clinician-initiated obstetric intervention vs an annual decrease of 1.8% (95% CI, 1.3% to 2.3%) among births without clinician-initiated obstetric intervention. Over the 8-year study period in the United States, early term birth rates declined by 35.6% (95% CI, 33.3% to 37.8%) among births with clinician-initiated obstetric intervention and by 13.5% (95% CI, 9.8% to 17.1%) among births without clinician-initiated obstetric intervention after adjustment for maternal age at delivery and parity (Table 2, Model 3). In absolute terms, unadjusted early term birth rates declined from 33.0% in 2006 to 21.1% in 2014 among births with clinician-initiated obstetric intervention, and from 29.7% in 2006 to 27.1% in 2014 among births without clinician-initiated obstetric intervention (eTable 5 in the Supplement).
Results were similar to the primary findings when multiple imputation was conducted for missing parity data in Canada (eTable 6 in the Supplement), and Norwegian and US births by cesarean delivery with missing data on whether labor was attempted prior to delivery (United States) or whether it was an elective or emergency cesarean delivery (Norway) were treated as all involving clinician-initiated obstetric intervention or all missing mode of delivery (eTable 7 in the Supplement).
Discussion
Since 2006, late preterm birth rates decreased in Norway and the United States and early term birth rates decreased in Norway, Sweden, and the United States, whereas rates remained stable in the other countries studied. Clinician-initiated obstetric interventions increased among late preterm births in Canada, Denmark, and Finland, although they remained insufficiently frequent in absolute terms in those countries to affect late preterm birth rates. Clinician-initiated obstetric interventions (especially labor induction) increased in Denmark and Finland, although there was no effect seen on early term birth rates. In the United States, however, a considerable decrease in clinician-initiated obstetric interventions occurred among early term births, coupled with a larger decrease in early term birth rate among births with such interventions compared with births without the interventions.
Several multicountry reports, including the countries in this study, have characterized recent trends in their rates of all preterm births (<37 weeks).20–22 Few reports, however, have documented population-based trends in late preterm birth, and none have compared trends in early term birth. Declining US rates of preterm birth9 and early term birth23 have been documented since 2005, and this study confirmed a continuation of those trends through 2014. To the authors’ knowledge, this is the first study to compare prevalence of clinician-initiated obstetric interventions across several high-income countries.
Late preterm birth and early term birth rates were higher in Canada and the United States compared with the Nordic countries. Although the US late preterm birth rates declined by 12% after several decades of increasing preterm birth rates24 and early term birth rates declined by 37%, US rates remained higher than the other countries studied. Overall rates of clinician-initiated obstetric intervention varied across countries among late preterm births, ranging from 23% in Denmark to 44% in the United States, and among early term births, ranging from 33% in Finland to 45% in Canada. In most countries, obstetric intervention was more common among early term than late preterm births, probably owing to the known higher neonatal risks of preterm delivery.25 Canadian rates of clinician-initiated obstetric intervention were low among late preterm births at the start of the study period, reflecting low rates of prelabor cesarean delivery. One possible explanation for the subsequent increase in prelabor cesarean delivery is a return to former clinical practices after efforts to reduce clinician-initiated obstetric interventions in response to the peak in Canadian preterm birth rates observed in 2004.26 In line with recent observations of increasing labor induction rates in the Nordic countries,27,28 clinician-initiated intervention rates increased in those countries over the study period; yet, late preterm and early term birth rates remained stable. Continued monitoring and analysis of these trends is required, especially to identify factors driving increasing rates of labor induction.
The US findings were consistent with several recent hospital- and regional-based studies reporting reductions in elective obstetric intervention at early term gestations10–12,29 and may reflect the success of perinatal quality collaboratives aimed at reducing elective deliveries prior to 39 weeks.30–32 Concerns have been expressed that delaying interventions until 39 weeks might increase stillbirth rates,10 and this is an area requiring further study. Decreasing late preterm and early term birth rates were also observed among births without clinician-initiated obstetric intervention, similar to recent findings of decreases in spontaneous late preterm births.9 Some of the same potential factors behind reductions in spontaneous late preterm birth (eg, progesterone use, cerclage) may apply to the early term population.33
Multicountry studies are typically limited by noncomparable data and the use of ecologic analyses. A major strength of this study was the use of large, national- and population-based birth registry data sets from several countries, obtained in harmonized data sets containing some individual-level potential confounders (eg, mother’s age at delivery), allowing for a more rigorous analysis than an ecologic comparison of trends across countries. Residual confounding cannot be excluded, however, owing to differences in additional maternal factors such as socioeconomic status (eg, access to and quality of health care), race and ethnicity, and maternal obesity.
Several study limitations must be considered. First, Danish and Swedish data were limited to births through 2010 and 2012, respectively. Second, to harmonize analyses across countries, a consensus definition of clinician-initiated obstetric intervention based on labor induction or prelabor/elective cesarean delivery was applied to each country’s birth register or administrative (hospitalization) database; it is important to recognize that this definition represents a proxy measure that may not perfectly correspond to elective (vs emergency) obstetric intervention. Comparable and reliable individual-level data on maternal or fetal indications for early delivery were not available. Known limitations of birth registry and administrative data include the potential for underreporting, overreporting, and misreporting obstetric interventions, with varying attempts to assess these potential issues in the countries studied. Although perinatal data validation in Canada found high (>89%) sensitivity and specificity for cesarean delivery and induction of labor,34 the algorithm used in this study to identify prelabor cesarean deliveries has not been validated.
Validity of reporting of elective cesarean delivery and labor induction has been assessed to some extent in the Nordic birth registers, which are widely known for their high data quality. Danish reports of cesarean delivery and labor induction were found to have high positive predictive values, although elective (prelabor) cesarean delivery has not been validated.35 The latest Finnish validation study (in 1995) found high validity for cesarean delivery but could not define validity for labor induction.36 The latest Swedish validation study (in 2001) found that classification of elective vs emergency cesarean delivery was adequate at term gestations but elective cesarean delivery was overestimated for preterm; additional check-boxes have subsequently been added to improve reporting. Validity of the labor induction checkbox, which is marked at the onset of delivery, has not been assessed.14 No validation studies have been performed for the Norwegian Medical Birth Register; however, checkboxes for labor inductions, as well as emergency and elective cesarean deliveries, are similar to those used in Sweden.
In the United States, data quality concerns have been documented when using vital records to ascertain obstetric interventions.37,38 A recent study in 2 states based on the 2003 revised live birth certificate found high sensitivity but a 15% to 20% false-positive rate for reports of trial of labor, and variability in accuracy of labor induction.37 US analyses were restricted to births reporting on the 2003 revised live birth certificate, although sensitivity analyses indicated robustness of the findings. Future population-based studies could be improved by using birth certificate data augmented with prospective individual-level data on indications for obstetric intervention (eg, by linkage to medical records).39,40
Conclusions
Between 2006 and 2014, late preterm and early term birth rates declined in the United States, and an association was observed between early term birth rates and decreasing clinician-initiated obstetric interventions. Late preterm births also decreased in Norway, and early term births decreased in Norway and Sweden. Clinician-initiated obstetric interventions increased in some countries but no association was found with rates of late preterm or early term birth.
Supplementary Material
Key Points.
Question
Are temporal trends in late preterm and early term birth rates in 6 high-income countries associated with use of clinician-initiated obstetric interventions?
Findings
These population-based retrospective analyses of singleton live births found declining late preterm birth rates in Norway and the United States and declining early term birth rates in Norway, Sweden, and the United States. Obstetric interventions increased in some countries but decreased in the United States, where an association was observed with decreasing early term birth rates.
Meaning
Decreasing US early term birth rates were associated with decreasing rates of clinician-initiated obstetric interventions; obstetric interventions increased in some other countries but with no association with late preterm or early term birth rates.
Acknowledgments
Funder/Sponsor: This work was supported by a T32 Predoctoral Training Program in Reproductive, Perinatal, and Pediatric Epidemiology grant (T32HD052460) from the Eunice Kennedy Shriver National Institute of Child Health and Human Development (NICHD) of the National Institutes of Health (NIH; Ms Richards); a grant from Paris Descartes University (Ms Delnord); grant KAKENHI 26870889 from the Japan Society for the Promotion of Science (Dr Morisaki); grant AMED-6013 from the Japan Ministry of Health, Labour, and Welfare (Dr Morisaki); and grant K01HD074726 from the NICHD of the NIH (Dr M. R. Kramer).
Role of the Funder/Sponsor: The funding sources had no role in the design and conduct of the study; collection, management, analysis, and interpretation of the data; preparation, review, or approval of the manuscript; and decision to submit the manuscript for publication.
Footnotes
Supplemental content at jama.com
Author Contributions: Ms Jennifer Richards had full access to all of the data in the study and takes responsibility for the integrity of the data and the accuracy of the data analysis.
Study concept and design: Richards, M.S. Kramer, Gissler, Morken, Skjærven, Cnattingius, Zeitlin, M.R. Kramer.
Acquisition, analysis, or interpretation of data: All authors.
Drafting of the manuscript: Richards, Johansson, Zeitlin, M.R. Kramer.
Critical revision of the manuscript for important intellectual content: M.S. Kramer, Deb-Rinker, Rouleau, Mortensen, Gissler, Morken, Skjærven, Cnattingius, Johansson, Delnord, Dolan, Morisaki, Tough, M.R. Kramer.
Statistical analysis: Richards, Deb-Rinker, Rouleau, Mortensen, Gissler, Morken, Skjærven, Tough, M.R. Kramer.
Obtained funding: Mortensen.
Administrative, technical, or material support: M.S. Kramer, Mortensen, Gissler, Skjærven, Cnattingius, Johansson, Dolan, Morisaki, M.R. Kramer.
Study supervision: M.S. Kramer, Gissler, Morken, Skjærven, Zeitlin, M.R. Kramer.
Conflict of Interest Disclosures: All authors have completed and submitted the ICMJE Form for Disclosure of Potential Conflicts of Interest.
Dr Morisaki reports receiving grant funding from the Uehara Memorial Foundation, Kanzawa Medical Research Foundation, and the Danone Institute. No other disclosures were reported.
Disclaimer: The content is solely the responsibility of the authors and does not necessarily represent the official views of the NIH.
References
- 1.Shapiro-Mendoza CK, Lackritz EM. Epidemiology of late and moderate preterm birth. Semin Fetal Neonatal Med. 2012;17(3):120–125. doi: 10.1016/j.siny.2012.01.007. [DOI] [PMC free article] [PubMed] [Google Scholar]
- 2.The American College of Obstetricians and Gynecologists Committee on Obstetric Practice, The Society for Maternal-Fetal Medicine. Committee opinion number 561. http://www.acog.org/Resources-And-Publications/Committee-Opinions/Committee-on-Obstetric-Practice/Nonmedically-Indicated-Early-Term-Deliveries. Accessed June 28, 2016.
- 3.ACOG Committee on Practice Bulletins—Obstetrics. ACOG practice bulletin No. 107. Obstet Gynecol. 2009;114(2 Pt 1):386–397. doi: 10.1097/AOG.0b013e3181b48ef5. [DOI] [PubMed] [Google Scholar]
- 4.American College of Obstetricians and Gynecologists Committee on Obstetric Practice. ACOG committee opinion number 559. http://www.acog.org/Resources-And-Publications/Committee-Opinions/Committee-on-Obstetric-Practice/Cesarean-Delivery-on-Maternal-Request. Accessed December 15, 2015.
- 5.MacDorman MF, Declercq E, Zhang J. Obstetrical intervention and the singleton preterm birth rate in the United States from 1991–2006. Am J Public Health. 2010;100(11):2241–2247. doi: 10.2105/AJPH.2009.180570. [DOI] [PMC free article] [PubMed] [Google Scholar]
- 6.VanderWeele TJ, Lantos JD, Lauderdale DS. Rising preterm birth rates, 1989–2004. Soc Sci Med. 2012;74(2):196–201. doi: 10.1016/j.socscimed.2011.10.031. [DOI] [PMC free article] [PubMed] [Google Scholar]
- 7.Zhang X, Kramer MS. The rise in singleton preterm births in the USA. BJOG. 2012;119(11):1309–1315. doi: 10.1111/j.1471-0528.2012.03453.x. [DOI] [PubMed] [Google Scholar]
- 8.Martin JA, Kirmeyer S, Osterman M, Shepherd RA. Born a bit too early. NCHS Data Brief. 2009;24:1–8. [PubMed] [Google Scholar]
- 9.Gyamfi-Bannerman C, Ananth CV. Trends in spontaneous and indicated preterm delivery among singleton gestations in the United States, 2005–2012. Obstet Gynecol. 2014;124(6):1069–1074. doi: 10.1097/AOG.0000000000000546. [DOI] [PubMed] [Google Scholar]
- 10.Little SE, Robinson JN, Puopolo KM, et al. The effect of obstetric practice change to reduce early term delivery on perinatal outcome. J Perinatol. 2014;34(3):176–180. doi: 10.1038/jp.2013.166. [DOI] [PubMed] [Google Scholar]
- 11.Danilack VA, Botti JJ, Roach JJ, Savitz DA, Muri JH, Caldwell DL. Changes in delivery methods at specialty care hospitals in the United States between 2006 and 2010. J Perinatol. 2013;33(12):919–923. doi: 10.1038/jp.2013.90. [DOI] [PubMed] [Google Scholar]
- 12.Oshiro BT, Henry E, Wilson J, Branch DW, Varner MW, Women and Newborn Clinical Integration Program Decreasing elective deliveries before 39 weeks of gestation in an integrated health care system. Obstet Gynecol. 2009;113(4):804–811. doi: 10.1097/AOG.0b013e31819b5c8c. [DOI] [PubMed] [Google Scholar]
- 13.National Institute for Health and Welfare. Medical Birth Register. https://www.thl.fi/fi/web/thlfi-en/statistics/information-on-statistics/register-descriptions/newborns. Accessed August 6, 2015.
- 14.Swedish National Board of Health and Welfare Centre for Epidemiology. The Swedish Medical Birth Register. https://www.socialstyrelsen.se/Lists/Artikelkatalog/Attachments/10655/2003-112-3_20031123.pdf. Accessed November 9, 2015.
- 15.Alexander GR, Himes JH, Kaufman RB, Mor J, Kogan M. A United States national reference for fetal growth. Obstet Gynecol. 1996;87(2):163–168. doi: 10.1016/0029-7844(95)00386-X. [DOI] [PubMed] [Google Scholar]
- 16.Høgberg U, Larsson N. Early dating by ultrasound and perinatal outcome. Acta Obstet Gynecol Scand. 1997;76(10):907–912. doi: 10.3109/00016349709034900. [DOI] [PubMed] [Google Scholar]
- 17.Wier ML, Pearl M, Kharrazi M. Gestational age estimation on United States livebirth certificates. Paediatr Perinat Epidemiol. 2007;21(suppl 2):4–12. doi: 10.1111/j.1365-3016.2007.00856.x. [DOI] [PubMed] [Google Scholar]
- 18.Centers for Disease Control and Prevention. Vital statistics data available online. http://www.cdc.gov/nchs/data_access/vitalstatsonline.htm. August 16, 2015.
- 19.Journal of Statistical Software. Multiple Imputation Using SAS. https://www.jstatsoft.org/index.php/jss/article/view/v045i06. Accessed May 12, 2016.
- 20.Blencowe H, Cousens S, Oestergaard MZ, et al. National, regional, and worldwide estimates of preterm birth rates in the year 2010 with time trends since 1990 for selected countries. Lancet. 2012;379(9832):2162–2172. doi: 10.1016/S0140-6736(12)60820-4. [DOI] [PubMed] [Google Scholar]
- 21.Chang HH, Larson J, Blencowe H, et al. Preventing preterm births. Lancet. 2013;381(9862):223–234. doi: 10.1016/S0140-6736(12)61856-X. [DOI] [PMC free article] [PubMed] [Google Scholar]
- 22.Zeitlin J, Szamotulska K, Drewniak N, et al. Preterm birth time trends in Europe. BJOG. 2013;120(11):1356–1365. doi: 10.1111/1471-0528.12281. [DOI] [PMC free article] [PubMed] [Google Scholar]
- 23.Little SE, Zera CA, Clapp MA, Wilkins-Haug L, Robinson JN. A multi-state analysis of early-term delivery trends and the association with term stillbirth. Obstet Gynecol. 2015;126(6):1138–1145. doi: 10.1097/AOG.0000000000001109. [DOI] [PubMed] [Google Scholar]
- 24.Martin JA, Osterman MJK, Sutton PD. Are preterm births on the decline in the United States? NCHS Data Brief. 2010;39:1–8. [PubMed] [Google Scholar]
- 25.Spong CY, Mercer BM, D’alton M, Kilpatrick S, Blackwell S, Saade G. Timing of indicated late-preterm and early-term birth. Obstet Gynecol. 2011;118(2 pt 1):323–333. doi: 10.1097/AOG.0b013e3182255999. [DOI] [PMC free article] [PubMed] [Google Scholar]
- 26.Public Health Agency of Canada. Perinatal health indicators for Canada. 2013 doi: 10.24095/hpcdp.35.1.05. http://publications.gc.ca/collections/collection. Accessed May 9, 2016. [DOI] [PMC free article] [PubMed]
- 27.Dögl M, Vanky E, Heimstad R. Changes in induction methods have not influenced cesarean section rates among women with induced labor. Acta Obstet Gynecol Scand. 2016;95(1):112–115. doi: 10.1111/aogs.12809. [DOI] [PubMed] [Google Scholar]
- 28.Ekéus C, Lindgren H. Induced labor in Sweden, 1999–2012. Birth. 2016;43(2):125–133. doi: 10.1111/birt.12220. [DOI] [PubMed] [Google Scholar]
- 29.Osterman MJK, Martin JA. NCHS data brief: recent declines in induction of labor by gestational age. http://www.cdc.gov/nchs/data/databriefs/db155.pdf. Accessed October 6, 2015. [PubMed]
- 30.Trembath AN, Iams JD, Walsh M. Quality initiatives related to moderately preterm, late preterm, and early term births. Clin Perinatol. 2013;40(4):777–789. doi: 10.1016/j.clp.2013.07.011. [DOI] [PubMed] [Google Scholar]
- 31.Oshiro BT, Kowalewski L, Sappenfield W, et al. A multistate quality improvement program to decrease elective deliveries before 39 weeks of gestation. Obstet Gynecol. 2013;121(5):1025–1031. doi: 10.1097/AOG.0b013e31828ca096. [DOI] [PubMed] [Google Scholar]
- 32.Berrien K, Devente J, French A, et al. The perinatal quality collaborative of North Carolina’s 39 weeks project. N C Med J. 2014;75(3):169–176. doi: 10.18043/ncm.75.3.169. [DOI] [PMC free article] [PubMed] [Google Scholar]
- 33.Schoen CN, Tabbah S, Iams JD, Caughey AB, Berghella V. Why the United States preterm birth rate is declining. Am J Obstet Gynecol. 2015;213(2):175–180. doi: 10.1016/j.ajog.2014.12.011. [DOI] [PubMed] [Google Scholar]
- 34.Joseph KS, Fahey J, Canadian Perinatal Surveillance System Validation of perinatal data in the Discharge Abstract Database of the Canadian Institute for Health Information. Chronic Dis Can. 2009;29(3):96–100. [PubMed] [Google Scholar]
- 35.Schmidt M, Schmidt SAJ, Sandegaard JL, Ehrenstein V, Pedersen L, Sørensen HT. The Danish National Patient Registry. Clin Epidemiol. 2015;7:449–490. doi: 10.2147/CLEP.S91125. [DOI] [PMC free article] [PubMed] [Google Scholar]
- 36.Gissler M, Teperi J, Hemminki E, Meriläinen J. Data quality after restructuring a national medical registry. Scand J Soc Med. 1995;23(1):75–80. doi: 10.1177/140349489502300113. [DOI] [PubMed] [Google Scholar]
- 37.Martin JA, Wilson EC, Osterman MJK, Saadi EW, Sutton SR, Hamilton BE. Assessing the quality of medical and health data from the 2003 birth certificate revision. Natl Vital Stat Rep. 2013;62(2):1–19. [PubMed] [Google Scholar]
- 38.Bailit JL, Ohio Perinatal Quality Collaborative Rates of labor induction without medical indication are overestimated when derived from birth certificate data. Am J Obstet Gynecol. 2010;203(3):269.e1–269.e3. doi: 10.1016/j.ajog.2010.07.004. [DOI] [PubMed] [Google Scholar]
- 39.Korst LM, Fridman M, Lu MC, Fleege L, Mitchell C, Gregory KD. Trending elective preterm deliveries using administrative data. Paediatr Perinat Epidemiol. 2013;27(1):44–53. doi: 10.1111/ppe.12018. [DOI] [PubMed] [Google Scholar]
- 40.Iams JD. Late preterm birth. Am J Obstet Gynecol. 2011;205(5):395. doi: 10.1016/j.ajog.2011.08.006. [DOI] [PubMed] [Google Scholar]
Associated Data
This section collects any data citations, data availability statements, or supplementary materials included in this article.