Abstract
Phosphorus bioavailability is an emerging topic of interest in the field of renal nutrition that has important research and clinical implications. Estimates of phosphorus bioavailability, based on digestibility, indicate that bioavailability of phosphorus increases from plants to animals to food additives. In this commentary, we examined the proportion of dietary phosphorus from plants, animals and food additives excreted in urine from four controlled feeding studies conducted in healthy adults and patients with chronic kidney disease. As expected, a smaller proportion of phosphorus from plant foods was excreted in urine compared to animal foods. However, contrary to expectations, phosphorus from food additives appeared to be incompletely absorbed. The apparent discrepancy between digestibility of phosphorus additives and the proportion excreted in urine suggests a need for human balance studies to determine the bioavailability of different sources of phosphorus.
Keywords: Phosphorus, Bioavailability, Plant, Animal, Food Additives, Urine, Digestibility, Absorption
INTRODUCTION
Hyperphosphatemia is a common complication in patients with chronic kidney disease (CKD), which is thought to contribute to renal osteodystrophy and cardiovascular disease.1 To help manage hyperphosphatemia, CKD patients are often prescribed phosphorus binders and advised to follow a low-phosphorus diet, which involves restricting foods that are high in phosphorus.1 Unfortunately, phosphorus-rich foods are abundant in the diet (e.g., dairy, nuts, seeds, legumes, whole grains), and include many other important nutrients. As a result, avoiding high-phosphorus foods can be challenging for CKD patients, and may contribute to malnutrition in this already nutritionally compromised patient population.2
A growing body of evidence suggests that crude amounts of phosphorus in foods do not reflect true phosphorus exposure because of variability in phosphorus bioavailability.3,4 Indeed, phosphorus bioavailability estimates range from approximately 6% for sesame seeds to nearly 100% for phosphorus-based food additives.5-7 Adjusting for phosphorus bioavailability has important implications for research linking dietary phosphorus to disease outcomes, and dietary guidelines for managing hyperphosphatemia in CKD patients, in particular, providing opportunities to liberalize the diet.
In general, foods are grouped together based on phosphorus bioavailability by source as plants, animals and food additives.7 Although differences in phosphorus bioavailability between plants and animals have been shown to be clinically relevant8, phosphorus bioavailability estimates are largely based on chemical composition and digestibility, which may not reflect the bioavailability in vivo. With this commentary, we attempt to bring attention to this issue by exploring the available data on the proportion of plant-, animal-, and food additive-based phosphorus excreted in urine during controlled feeding studies.
THE DIGESTIBILITY MODEL OF PHOSPHORUS BIOAVAILABILITY
Although estimates of phosphorus bioavailability vary, it is generally accepted that bioavailability of phosphorus from plant < animals < food additives.7 Phosphorus from plants is thought to be poorly absorbed because the majority of it exists as part of phosphorus storage molecules called phytates, which cannot be broken down by human digestive enzymes.6 A substantial portion of animal-based phosphorus (and some plant-based phosphorus) is bound to digestible organic molecules (e.g., proteins, phospholipids, nucleic acids), which are thought to be mostly bioavailable.6 Lastly, food additive-based phosphorus (and some plant- and animal-based phosphorus) exists as inorganic molecules (e.g., phosphate, phosphate salts) that readily dissociate in water, and are thought to be fully bioavailable.6,7 The amount of phosphorus added to processed foods is unlisted; however, researchers have established novel analytical procedures for measuring inorganic phosphorus in foods9,10, and have started to obtain these estimates.
The digestibility model of phosphorus bioavailability (described above) is based on the assumption that digestion of dietary phosphorus is the key determinant of bioavailability, and therefore, the effect of dietary phosphorus on health (e.g., hyperphosphatemia, renal osteodystrophy, vascular calcification). However, this model overlooks interactions that occur within the human digestive tract, and the effects of other nutrients in phosphorus-rich foods on phosphorus metabolism and health. We hypothesize that the proposed differences in phosphorus bioavailability between plants, animals and food additives based on digestibility will be attenuated in vivo because: (1) binding of phosphorus to other compounds in the digestive tract will disproportionately affect highly-digestible inorganic phosphorus; and (2) phosphorus in phytates, which are assumed to be unavailable, may be broken down by bacteria in the digestive tract that possess phytase activity, making it partially bioavailable.11
PROPORTION OF DIETARY PHOSPHORUS EXCRETED IN URINE
At least four studies have collected data to examine the proportion of dietary phosphorus excreted in urine from different diets in humans (Supplementary Table 1).12-15 Most were crossover controlled feeding studies that were not designed to study phosphorus bioavailability as the primary outcome, but reported estimates of phosphorus intake from different sources, and the amount of phosphorus excreted in 24-hour urine samples. This approach to assessing phosphorus bioavailability assumes that the participants are in phosphorus balance at the time of measurement, and that urinary phosphorus reflects the absorbed fraction of dietary phosphorus; the extent to which these assumptions are met vary depending on design features of the study (e.g., population, amount of phosphorus, duration of feeding).
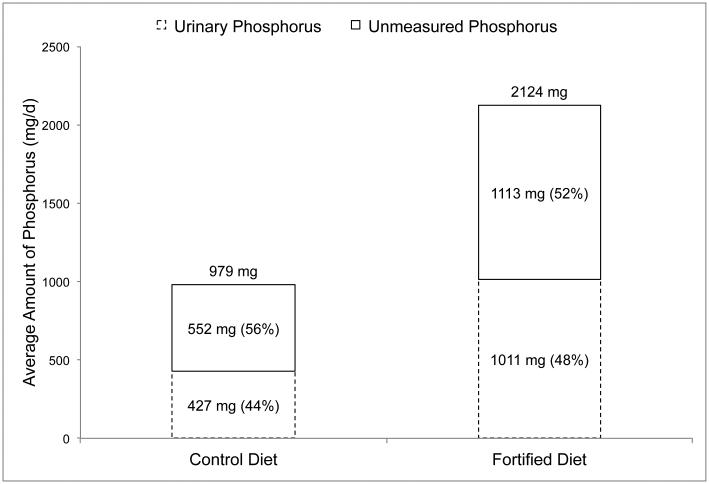
The first study by Bell et al.12 was a 4-week crossover feeding study in 8 healthy volunteers (5 male, 3 female; 24-36 years) designed to examine the effects of phosphorus additives on mineral metabolism and bone turnover. During the first 4 weeks, participants were provided a diet containing phosphorus from natural sources only. During the last 4 weeks, foods were substituted with similar foods containing phosphorus additives. The phosphorus content of the diets was analyzed using duplicate meals in week 1, and urinary output of phosphorus was measured in 24-hour urine samples collected on the last day of each week. The results of this study are depicted in Figure 1, and show that amount of urinary phosphorus in relation to dietary phosphorus was similar in the two diets (44% vs 48%).
Figure 1. Daily urinary phosphorus output in relation to dietary phosphorus intakes in healthy adults (n=8) consuming a phosphorus additive-free control diet, and a diet fortified with phosphorus additives.
Data obtained from a 4-week crossover feeding study by Bell et al.10
Dietary phosphorus intake values are based on the average phosphorus content of duplicate meals in week 1 of each diet. Urinary phosphorus values are based on the average of four 24-hour urine samples collected on the end of each week.
Unmeasured phosphorus (shown as a percent of dietary intake in the top stacked column) is equal to dietary phosphorus intake (shown on top of the columns) minus the amount of phosphorus measured in 24-hour urine samples (shown as a percent of dietary phosphorus intake in the bottom stacked column).
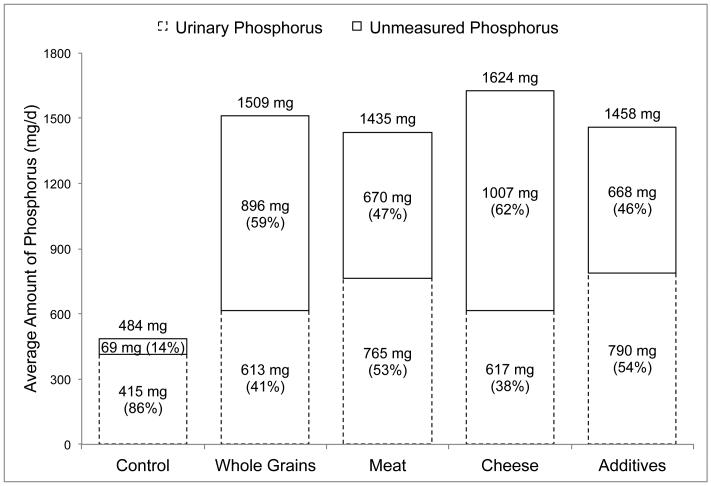
The second study by Karp et al.13 was a series of five, 24-hour feeding sessions conducted in 16 healthy female volunteers (20-30 years) over a 5-week period (1 session per week) designed to compare the effect of different dietary sources of phosphorus on calcium and bone metabolism. The control session was created to be low in phosphorus (500 mg) and calcium (300 mg), whereas the other feeding sessions were planned to contain approximately 1,000 mg additional phosphorus from whole grains, meat, cheese or supplements. Because these authors were interested in studying the impact of whole-foods, diets differed in nutrient content (e.g., fiber, protein, calcium). The phosphorus content of control foods were estimated using local nutrient composition tables and manufacturers’ information, and the phosphorus content of whole grains, meat, cheese and 24-hour urine samples were directly analyzed. Because urinary phosphorus was unreported, we estimated these values by measuring the published column graph lengths in Microsoft PowerPoint for Mac® (v. 14.6.4). The results of this study are depicted in Figure 2, and show that the relative amount of urinary phosphorus was highest in the control session (86%), and similar in the whole grain (41%) and cheese (38%) sessions, and the meat (53%) and supplement (54%) sessions. The lower urine content of the control session likely reflects negative phosphorus balance caused by the low dietary phosphorus intake (484 mg), but the other sessions had similar phosphorus contents (Figure 2).
Figure 2. Daily urinary phosphorus output in relation to dietary phosphorus intakes in healthy females (n=16) consuming a low-phosphorus control diet, and the control diet enhanced with phosphorus from whole grains, meat, cheese and food additives.
Data obtained from a single day crossover feeding study by Karp et al.11
Urinary phosphorus values were obtained by measuring the published column graph lengths in Microsoft PowerPoint for Mac® (v. 14.6.4).
Unmeasured phosphorus (shown as a percent of dietary intake in the top stacked column) is equal to dietary phosphorus intake (shown on top of the columns) minus the amount of phosphorus measured in 24-hour urine samples (shown as a percent of dietary phosphorus intake in the bottom stacked column).
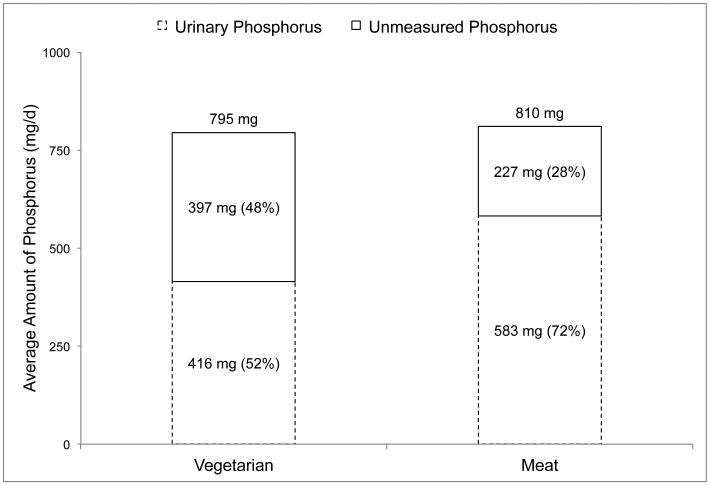
The third study by Moe et al.14 was a 7-day crossover feeding study with a 2-4 week washout period designed to determine if the source of phosphorus (animal vs plant) impacts phosphorus metabolism and related hormone concentrations in 8 patients with CKD (eGFR 25-40 mL/min/1.73m2; 4 male, 4 female; 61±8.1 years). Patients requiring phosphorus binders or taking dietary calcium or vitamin D supplements were excluded. Diets were planned to provide similar amounts of energy, protein, calcium, sodium and phosphorus, with phosphorus content of the diets being directly analyzed. Participants stayed at the data collection site on the final day of each diet, during which time 24-hour urine samples were collected and analyzed for phosphorus content. The results of this study are depicted in Figure 3, and show that the relative amount of urinary phosphorus was notably higher in the animal-based diet (72%) compared to the plant-based diet (52%).
Figure 3. Daily urinary phosphorus output in relation to dietary phosphorus intakes in patients with chronic kidney disease (n=8, eGFR 25-40 mL/min/1.73m2) consuming diets containing the majority of phosphorus from plant (grain/soy) and animal (meat/dairy) sources.
Data obtained from a 7-day crossover feeding study by Moe et al.12
Dietary and urinary phosphorus values are based on duplicate meals and 24-hour urine samples from the last day of each diet.
Unmeasured phosphorus (shown as a percent of dietary intake in the top stacked column) is equal to dietary phosphorus intake (shown on top of the columns) minus the amount of phosphorus measured in 24-hour urine samples (shown as a percent of dietary phosphorus intake in the bottom stacked column).
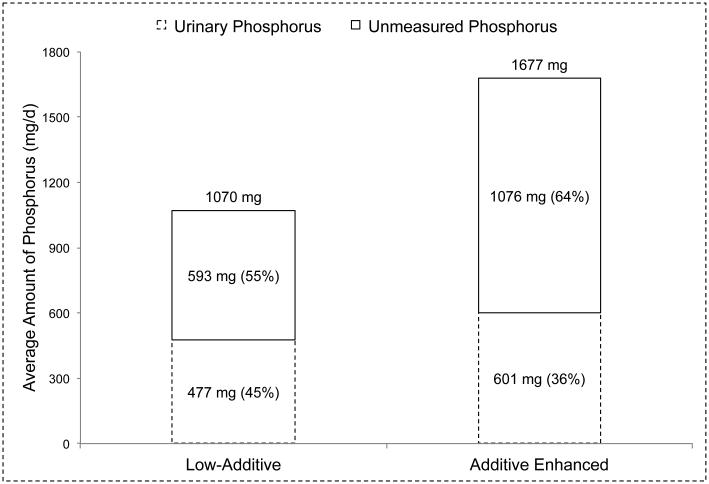
The fourth study by Gutierrez et al.15 was a 7-day crossover feeding study designed to examine the effects of phosphorus additives on bone and mineral metabolism in 10 healthy volunteers (4 male, 6 female; 19-45 years, 31.9±7.9 years). Diets were planned on a 4-day menu designed to provide similar amounts of energy and other nutrients, although the fat and sodium content of the additive-enhanced diet were higher than the low-additive diet. The 4-day menus, and 24-hour urine samples collected on day 7 of each diet were analyzed for phosphorus content. The results of this study are depicted in Figure 4, and show that the relative amount of urinary phosphorus was actually lower in the additive enhanced diet (36%) compared to the low-additive diet (45%).
Figure 4. Daily urinary phosphorus output in relation to dietary phosphorus intakes in healthy volunteer (n=10) consuming low phosphorus additive and phosphorus additive enhanced diets Data obtained from a 7-day crossover feeding study by Gutierrez et al.13.
Dietary phosphorus values are based on duplicate meals, and urinary phosphorus values are based on 24-hour urine samples collected on the last day of each diet.
Unmeasured phosphorus (shown as a percent of dietary intake in the top stacked column) is equal to dietary phosphorus intake (shown on top of the columns) minus the amount of phosphorus measured in 24-hour urine samples (shown as a percent of dietary phosphorus intake in the bottom stacked column).
DISCUSSION
Phosphorus bioavailability is an emerging topic in the field of renal nutrition, which could have important implications for research and clinical recommendations related to dietary phosphorus. However, despite the growing awareness of differences in phosphorus bioavailability by source3,4, no balance studies have been designed to assess the bioavailability of phosphorus from plants, animals and food additives in humans. In this commentary, we have identified potentially important distinctions between proportion of dietary phosphorus excreted in urine by source, and the commonly referenced values based on chemical composition and digestibility studies.
Most notably, three studies failed to support the relatively high bioavailability of phosphorus additives that are often reported in the literature.12,13,15 The reason for the discrepancy is unclear, but may relate to nutrient-nutrient interactions that occur in the digestive tract, rendering inorganic phosphorus less bioavailable (e.g., binding to calcium), or the higher phosphorus content of the diets containing phosphorus additives12,15 resulting in lower phosphorus absorption, either directly by saturating transporters, or indirectly by suppressing calcitriol production.16 However, the latter explanation is limited in that: (1) diets with phosphorus additives are expected to contain more phosphorus; (2) one study, matched on phosphorus content, found no difference in urine phosphorus between phosphorus additives and meat14; and (3) phosphorus bioavailability studies indicate that dietary phosphorus absorption is constant across the range of intakes used in feeding studies we examined.17 Regardless of the cause, based on the proportion of phosphorus excreted in urine, it seems likely that they are incompletely absorbed. This conclusion is supported by a recent feeding study by Scanni et al.16, in which 73% of sodium phosphate continuously administered by nasoduodenal feeding tube over a 36-hour period was recovered in urine, compared to 100% of intravenously infused sodium phosphate.
Conversely, two studies supported the notion that phosphorus in plant-based foods is less bioavailable.13,14 Of interest, the relative amount of phosphorus in urine, and the differences between plant and animal sources were lower in one study11 compared to the other14. These studies had many dissimilarities, including population (healthy young females vs CKD), duration (1 day vs 7 days), sources of plant (unfermented whole grains vs soy/grain) and animal (meat or cheese vs meat/dairy) phosphorus, amount of dietary phosphorus (~1,500 mg vs ~800 mg) and matching of nutrient intakes (sodium and phosphorus vs protein, calcium, sodium and phosphorus), which may explain these discrepancies. Ultimately, additional studies are needed to clarify these findings, but it appears that at approximately 40-50% of plant and 40-70% of animal phosphorus is excreted in urine.13,14
The four studies discussed in this commentary were controlled-feeding studies that provided measured amounts of dietary phosphorus, and analyzed the phosphorus content of 24-hour urine samples. However, they were not designed to compare phosphorus bioavailability by source, and therefore, their findings should be interpreted cautiously. In particular, the vitamin D content of each diet, and vitamin D status of participants at the start of each diet were not reported. Because calcitriol (active vitamin D) increases phosphorus absorption, human balance studies assessing phosphorus bioavailability should account for vitamin D intake and status.17 In addition, although two studies reported that sodium-based phosphate additives were exclusively-13 or mostly-used12, many commonly used phosphorus additives contain calcium, magnesium or aluminum (e.g., calcium diphosphate, calcium polyphosphates, magnesium phosphate, sodium aluminum phosphate).7 Although the absorption rates of different phosphorus additives is unknown, the proportion of phosphorus in food additives excreted in urine would likely be lowered by the presence of these minerals.7 Lastly, most of these studies were conducted in healthy volunteers, and it is unclear whether the results would be similar in CKD patients.
CONCLUSION
In conclusion, estimates of dietary phosphorus bioavailability based on digestibility are somewhat discordant with the proportion of phosphorus excreted in urine in human feeding studies. In particular, phosphorus additives, which are completely digestible, appear to be incompletely absorbed based on 24-hour urinary phosphorus measurements.12,13,15 Although digestibility is a key determinant of phosphorus bioavailability, their collinearity may be altered by factors affecting phosphorus absorption such as vitamin D status, and other minerals in the intestinal lumen. Human balance studies conducted over several days are a practical approach for assessing nutrient bioavailability, however no such studies have been conducted comparing plant, animal and additive sources of phosphorus. Given the growing interest in bioavailability as an important consideration in dietary phosphorus assessment, balance studies are urgently needed to inform this work.
PRACTICAL APPLICATIONS
This commentary examined the proportion of phosphorus in plants, animals and food additives excreted in 24-hour urine samples in individuals consuming known amounts of phosphorus. Phosphorus bioavailability may have important implications in the study of dietary phosphorus, and the development of low phosphorus diets for CKD patients. Our major finding was that phosphorus from food additives, which are readily digested, appears to be incompletely absorbed. This contradicts the current literature, which states that phosphorus from food additives is 90-100% bioavailable. Although interesting, and potentially important for measuring dietary phosphorus exposure, additives are still a major source of dietary phosphorus that can be eliminated from the diet to manage hyperphosphatemia18, often without impacting dietary quality (e.g., protein intake). Consequently, we argue that phosphorus-based food additives should continue to be a primary target for CKD patients with hyperphosphatemia. The apparent discrepancy with phosphorus bioavailability estimates based on digestibility highlights the need for human balance studies designed to determine the in vivo bioavailability of phosphorus from plants, animal and food additives.
Supplementary Material
Acknowledgments
Support
The work of this paper was supported by the following NIH grants: K24-NR012226 and R01-DK100492. NIH played no role in study design; collection, analysis, and interpretation of data; writing the report; or the decision to submit the report for publication. KKZ received honoraria from Abbott, Abbvie, Alexion, Amgen, Astra-Zeneca, AVEO Oncology, Chugai, DaVita, Fresenius, Genentech, Haymarket Media, Hospira, Kabi, Keryx, Novartis, Pfizer, Relypsa, Resverlogix, Sandoz, Sanofi, Shire, Vifor, UpToDate, and ZS-Pharma.
Footnotes
Publisher's Disclaimer: This is a PDF file of an unedited manuscript that has been accepted for publication. As a service to our customers we are providing this early version of the manuscript. The manuscript will undergo copyediting, typesetting, and review of the resulting proof before it is published in its final citable form. Please note that during the production process errors may be discovered which could affect the content, and all legal disclaimers that apply to the journal pertain.
Financial Disclosure Declaration
Other authors have not declared any relevant conflicts of interest.
REFERENCES
- 1.Kidney Disease: Improving Global Outcomes (KDIGO) CKD–MBD Work Group KDIGO clinical practice guideline for the diagnosis, evaluation, prevention, and treatment of chronic kidney disease–mineral and bone disorder (CKD–MBD) Kidney Int. 2009;76(Suppl 113):S1–S130. doi: 10.1038/ki.2009.188. [DOI] [PubMed] [Google Scholar]
- 2.Kalantar-Zadeh K, Tortorici AR, Chen JLT, Kamgar M, Lau W, Moradi H, Rhee CM, Streja E, Kovesdy CP. Dietary restrictions in dialysis patients: Is there anything left to eat? Sem Dial. 2015;28(2):159–168. doi: 10.1111/sdi.12348. [DOI] [PMC free article] [PubMed] [Google Scholar]
- 3.Gallant KMH. Studying dietary phosphorus intake: The challenge of when a gram is not a gram. Am J Clin Nutr. 2015;102:237–238. doi: 10.3945/ajcn.115.116889. [DOI] [PubMed] [Google Scholar]
- 4.Fukagawa M, Komaba H, Miyamoto K. Source matters: From phosphorus load to bioavailability. Clin J Am Soc Nephrol. 2011;6:239–240. doi: 10.2215/CJN.11051210. [DOI] [PubMed] [Google Scholar]
- 5.Karp H, Elkholm P, Kemi V, Itkonen S, Hivonen T, Narkki S, Lamberg-Allardt C. Differences among total and in vitro digestible phosphorus content of plant foods and beverages. J Ren Nutr. 2012;22(4):416–422. doi: 10.1053/j.jrn.2011.04.004. [DOI] [PubMed] [Google Scholar]
- 6.Uribarri J, Calvo MS. Hidden sources of phosphorus in the typical American diet: Does it matter in nephrology? Sem Dial. 2003;16(3):186–188. doi: 10.1046/j.1525-139x.2003.16037.x. [DOI] [PubMed] [Google Scholar]
- 7.Cupisti A, Kalantar-Zadeh K. Management of natural and added dietary phosphorus burden in kidney disease. Semin Nephrol. 2013;33:180–190. doi: 10.1016/j.semnephrol.2012.12.018. [DOI] [PMC free article] [PubMed] [Google Scholar]
- 8.Moe SM, Chen NX, Seifert MF, Sinders RM, Duan D, Chen X, Liang Y, Radcliff JS, White KE, Gattone VH. A rat model of chronic kidney disease-mineral bone disorder. Kidney Int. 2009;75:176–184. doi: 10.1038/ki.2008.456. [DOI] [PMC free article] [PubMed] [Google Scholar]
- 9.Joung H, Jeun BY, Li SJ, Kim J, Woodhouse LR, King JC, Welch RM, Paik HY. Fecal phytate excretion varies with dietary phytate and age in women. J Am Coll Nutr. 2007;26(3):295–302. doi: 10.1080/07315724.2007.10719614. [DOI] [PubMed] [Google Scholar]
- 10.Benini O, D’Alessandro C, Gianfaldoni D, Cupisti A. Extra-phosphate load from food additives in common eaten foods: A real and insidious danger for renal patients. J Ren Nutr. 2011;21(4):303–308. doi: 10.1053/j.jrn.2010.06.021. [DOI] [PubMed] [Google Scholar]
- 11.Cupisti A, Benini O, Ferretti V, Gianfaldoni D, Kalantar-Zadeh K. Novel differential measurement of natural and added phosphorus in cooked ham with and without preservatives. J Ren Nutr. 2012;22(6):533–540. doi: 10.1053/j.jrn.2011.12.010. [DOI] [PMC free article] [PubMed] [Google Scholar]
- 12.Bell RR, Draper HH, Tzeng DYM, Shin HK, Schmidt GR. Physiological responses of human adults to foods containing phosphate additives. J Nutr. 1977;107:42–50. doi: 10.1093/jn/107.1.42. [DOI] [PubMed] [Google Scholar]
- 13.Karp HJ, Viahia KP, Karkkainen MUM, Niemisto MJ, Lamberg-Allardt CJE. Acute effects of different phosphorus sources on calcium and bone metabolism in young women: A whole-foods approach. Calcif Tissue Int. 2007;80:251–258. doi: 10.1007/s00223-007-9011-7. [DOI] [PubMed] [Google Scholar]
- 14.Moe SM, Zidehsarai MO, Chambers MA, Jackman LA, Radcliffe JS, Trevino LL, Donahue SE, Asplin JR. Vegetarian compared with meat dietary protein source and phosphorus homeostasis in chronic kidney disease. Clin J Am Soc Nephrol. 2011;6:257–264. doi: 10.2215/CJN.05040610. [DOI] [PMC free article] [PubMed] [Google Scholar]
- 15.Gutierrez Om, Luzuriaga-McPherson A, Lin Y, Gilbert LC, Ha S, Beck GR., Jr. Impact of phosphorus-based food additives on bone and mineral metabolism. J Clin Endocrinol Metab. 2015;100:4264–4271. doi: 10.1210/jc.2015-2279. [DOI] [PMC free article] [PubMed] [Google Scholar]
- 16.Scanni R, vonRotz M, Jehle S, Hulter HN, Krapf R. The human response to acute enteral and parental phosphate loads. J Am Soc Nephrol. 2014;25(12):2730–2739. doi: 10.1681/ASN.2013101076. [DOI] [PMC free article] [PubMed] [Google Scholar]
- 17.Lemann J., Jr. Calcium and phosphate metabolism: An overview in health and in calcium stone formers. In: Coe FL, Favus MJ, Pak CYC, Parks JH, Preminger GM, editors. Kidney stones: Medical and surgical management. Lippincott-Raven Publishers; Philadelphia, PA: 1996. [Google Scholar]
- 18.Sullivan C, Sayre SS, Leon JB, Machekano R, Love TE, Porter D, Marbury M, Sehgal AR. Effect of food additives on hyperphosphatemia among patients with end-stage renal disease: A randomized controlled trial. JAMA. 2009;301(6):629–635. doi: 10.1001/jama.2009.96. [DOI] [PubMed] [Google Scholar]
Associated Data
This section collects any data citations, data availability statements, or supplementary materials included in this article.


