

Abstract
INTRODUCTION
High blood glucose levels may be responsible for the increased risk for dementia in diabetic patients.
METHODS
A secondary data analysis merging electronic medical records (EMRs) with data collected from the Indianapolis-Ibadan Dementia project (IIDP). Of the enrolled 4105 African Americans, 3778 were identified in the EMR. Study endpoints were dementia, mild cognitive impairment (MCI) or normal cognition. Repeated serum glucose measurements were used as the outcome variables.
RESULTS
Diabetic participants who developed incident dementia had a significant decrease in serum glucose levels in the years preceding the diagnosis compared to the participants with normal cognition (p=0.0002). They also had significantly higher glucose levels up to nine years before the dementia diagnosis (p=0.0367).
DISCUSSION
High glucose levels followed by a decline occurring years prior to diagnosis in African American participants with diabetes may represent a powerful pre-symptomatic metabolic indicator of dementia.
Keywords: Dementia, Alzheimer disease, longitudinal risk factors, diabetes, glucose levels, African Americans, electronic medical records, early detection
1. Introduction
With the aging of the US and world populations, the dementing disorders including Alzheimer disease (AD) are emerging as a major public health challenge. The identification of potentially modifiable risk factors for these disorders is critically important. Vascular risk factors such as diabetes, hypertension, hyperlipidemia, and obesity have been implicated as risk factors for dementia but the results have not been consistent [1–4].
Rates of diabetes have been increasing worldwide [5] thus the relationship between diabetes and dementia has received particular scrutiny [6–10]. A recent longitudinal study demonstrated that higher glucose levels in elderly participants with or without diabetes were associated with an increased risk of dementia occurring years before the dementia diagnosis [11].
Most predictive studies of the association of vascular risk factors with dementia have typically utilized measurements at a single point of time or relied on a mean value of multiple measurements over time. These analytic approaches may fail to capture change or variability in these markers over the lengthy pre-symptomatic period that precedes a clinical diagnosis of dementia/AD [12].
The Indianapolis Ibadan dementia project (IIDP) is a 20 year National Institute on Aging-funded longitudinal study of dementia and its risk factors in elderly community-dwelling African Americans living in Indianapolis, Indiana and elderly community-dwelling Yoruba living in Ibadan, Nigeria. Recently, data from the African American participants in the study were merged with data from the Indiana Network for Patient Care, a regional health information exchange, allowing us to examine longitudinal vascular risk factor profiles based on diagnostic testing obtained in the routine care of these older adults. This paper reports on an analysis of repeated serum glucose measurements and cognitive outcomes for the African American participants.
2. Methods
2.1 Study Population
The study population consisted of the African American participants of the IIDP. All were age 65 or older residing in Indianapolis, Indiana. Recruitment was conducted at two time points. During the first recruitment in 1992, 2212 African Americans age 65 or older living in Indianapolis were enrolled. In 2001, the project enrolled 1893 additional African American community-dwelling participants 70 years and older. All participants agreed to undergo regular follow-up cognitive assessment and clinical evaluations. Details on the assembling of the original cohort and the enrichment cohort are described elsewhere [13, 14].
The study followed a two stage design with a screening evaluation every two to three years followed by a more comprehensive home based clinical evaluation. Diagnoses of dementia, mild cognitive impairment, and Alzheimer disease were made by consensus [15–17]. For more details of the diagnostic process and criteria see eMethods 1 in the Supplement.
2.2 Electronic Medical Records
Electronic medical records were obtained from the Indiana Network for Patient Care (INPC). The INPC is a regional health information exchange that integrates clinical information from the five major health care systems in Indianapolis in support of medical care (see eMethods 2 in Supplement)[18].
EMR data were made available after appropriate approvals from the INPC Privacy Board. Of the 4105 participants enrolled in IIDP, 3778 (92%) were identified in INPC using social security numbers, name, gender and date of birth. For each individual, we retrieved serum glucose and hemoglobin A1c measures associated with outpatient visits, ICD-9 codes for diabetes and common comorbidities, and the use of diabetes medications classified as insulin only, oral antidiabetic medication only, or both insulin and oral medications. In addition, ICD-9 codes were used in the EMR to define diabetes complications [19].
3. Statistical Analyses
Since our analysis is focused on the change in glucose levels, repeated glucose measures were used as the outcome variables. Three groups of participants were defined in the analysis. The first group consisted of participants with incident dementia diagnosed at or after the 1995 evaluation for those in the original cohort and after the 2001 evaluation for participants enrolled in 2001. A second group consisted of participants diagnosed with MCI at their last evaluation. The third group consisted of participants who were either diagnosed as normal or were determined to have good cognitive function at their last follow-up evaluation. Since we are interested in the within-person changes in glucose levels prior to dementia diagnosis, only participants with at least two glucose measures before reaching IIDP study endpoints are included in this analysis. Participants with one or no glucose measure or those diagnosed with dementia prior to their first glucose measures were excluded from the analysis. This analysis included 1991 participants with longitudinal glucose values who contributed a total of 22865 glucose measures, where the glucose values were daily averaged glucose values and 1630 of the glucose values were calculated from hemoglobin A1c values (28.7*hemoglobin A1C-46.7) as done in previous studies [11].
To compare changes in serum glucose levels prior to the clinical diagnosis of dementia or MCI to those in normal participants, we aligned the timing of the glucose measurements to an index time point defined to be the time of diagnosis for participants with incident dementia and the time of last evaluation for normal participants. As participants with MCI in our cohort have heterogeneous outcomes, we included only those who were diagnosed with MCI at their last evaluation in the MCI category allowing those whose diagnosis had changed to normal or dementia to be included in the respective categories. Therefore, glucose measures taken during the course of the study were aligned by the number of years serum glucose was measured prior to the index time. In all of our statistical models, index time was coded as time zero. For example, a participant with serum glucose measured at 1995 and a diagnosis of dementia in 2007 would have time coded as -12, indicating that glucose was measured 12 years prior to the dementia diagnosis.
Demographic characteristics and medical history among the three groups were compared using chi-square tests for categorical variables and analysis of variance (ANOVA) for continuous variables. Covariates considered for the mixed effects models included baseline age, gender, years of education, alcohol, smoking, BMI, systolic and diastolic pressure, history of hypertension, coronary heart disease, stroke, cancer and depression based on self or informant reports collected from IIDP evaluations. ICD-9 codes from EMR were used to classify participants into those with diabetes or no diabetes. Two additional covariates based on EMR data were included as covariates: renal disease was identified with blood creatinine levels ≥2 mg/dL or ICD-9 codes for nephropathy [19], hypoglycemia was defined as any glucose measure ≤70 mg/dL.
We first explored separate single covariate mixed effect models with repeated glucose measures as the dependent variables and including one covariate, main effect of time and time squared, and an interaction term between the covariate and time. The final multivariate model included variables that had either significant main effects or significant interaction with time in the single covariate glucose models in addition to group, time and the interaction between group and time. Significant interactions between group and time would indicate differences in changes of glucose levels over time among the three groups. We also examined interactions between group and time squared and found these higher order interactions to be nonsignificant. The mixed effects models were first examined in all participants with an interaction among group, time and diabetes status (yes versus no) which resulted in a significant interaction (p=0.0010). Therefore, the mixed effects models were conducted separately in participants with diabetes and those without diabetes based on the same set of covariates. The final multivariate models included only covariates with either significant main effect or significant interactions with time. Post-hoc analyses examining glucose differences among the three groups at each year prior to the index time were conducted using linear contrasts within the final mixed effect model.
Additional sets of mixed effects models in participants with diabetes were conducted. The multivariate mixed effects model was used in participants with Alzheimer’s disease (AD), MCI and normal cognition, excluding those with non-AD dementia. The final model was also used in a subset of the analysis sample by excluding participants with cerebrovascular disease. To determine whether the decline in glucose levels in participants with incident dementia was accounted for by decline in BMI or albumin levels, we also conducted mixed effects models with repeated BMI and albumin levels measured during study follow-up as time-varying covariates (see eStatistical Analysis in Supplement). We also compared the demographic characteristics and medical conditions between participants included in the analyses and those excluded due to the lack of two or more glucose measures in the 3778 participants identified in EMR. The statistical software SAS version 9.4 was used for the analyses.
4. Results
A total of 1991 individuals with two or more serum glucose measures were included in this analysis. There were 207 participants diagnosed with dementia (163 with AD) during the course of the study, 211 with MCI at their last evaluation, and 1573 participants who remained in the normal group at their last evaluation. Median length of follow-up was 7.6 years (interquartile range: 4.3, 11.1), with the MCI participants having a longer median follow-up (9 years) than those in the group with dementia (7.2 years) or the normal group (7.4 years). The mean number of serum glucose measures per year is 1.1 and the three groups did not differ in the number of glucose measures over the study follow-up period (p=0.8669).
Demographic characteristics and comorbidities by the three groups are presented in Table 1. The three groups differed in baseline age, years of education, BMI, history of smoking, stroke and diabetes. Among the subset of the cohort (n=1255) genotyped for APOE, there was a significantly higher percentage of APOE ɛ4 carriers in the group with dementia (52.4%), followed by the group with MCI (40.3%) and the normal group (31.0%; p<0.0001). In participants with diabetes, there were no significant differences between the three groups in the percentage of participants treated with insulin (p=0.3439).
Table 1.
Comparisons of demographics and rates of medical conditions among participants with dementia, mild cognitive impairment (MCI) and normal cognition.
| All (n=1991) | MCI (n=211) | Dementia (n=207) | Normal (n=1573) | p-value | |
|---|---|---|---|---|---|
| Age at baseline, mean (sd) | 75.5(6.1) | 76.6(6.5) | 77.7(6.7) | 75.1(5.9) | <.0001 |
| Female, n (%) | 1417(71.2%) | 140(66.4%) | 152(73.4%) | 1125(71.5%) | 0.2234 |
| Years of education, mean (sd) | 10.7(2.9) | 9.9(3) | 9.4(3.4) | 10.9(2.7) | <.0001 |
| Alcohol Drinking, n (%) | 732(37.2%) | 75(35.9%) | 62(30%) | 595(38.3%) | 0.0608 |
| History of Smoking, n (%) | 1126(56.6%) | 123(58.3%) | 90(43.5%) | 913(58.1%) | 0.0003 |
| Body mass index, mean (sd) | 29.3(5.9) | 28.9(5.8) | 28.3(5.3) | 29.5(5.9) | 0.0124 |
| Systolic blood pressure, mean (sd) | 146.3(21.5) | 146.8(23.3) | 146.6(23.9) | 146.2(21) | 0.9044 |
| Diastolic blood pressure, mean (sd) | 79.3(12.1) | 79.5(12) | 79(13.5) | 79.3(11.9) | 0.9208 |
| Hypertension, n (%) | 1497(75.3%) | 157(74.8%) | 153(73.9%) | 1187(75.6%) | 0.8596 |
| Coronary heart disease, n (%) | 646(32.4%) | 73(34.6%) | 66(31.9%) | 507(32.2%) | 0.7756 |
| Stroke, n (%) | 293(14.7%) | 46(21.8%) | 35(16.9%) | 212(13.5%) | 0.0039 |
| Cancer, n (%) | 295(14.8%) | 23(11%) | 27(13%) | 245(15.6%) | 0.1624 |
| Depression, n (%) | 226(11.4%) | 28(13.4%) | 20(9.7%) | 178(11.3%) | 0.4922 |
| Renal Disease, n (%) | 761(38.2%) | 91(43.1%) | 81(39.1%) | 589(37.4%) | 0.2690 |
| Hypoglycemia, n (%) | 83(4.2%) | 4(1.9%) | 8(3.9%) | 71(4.5%) | 0.1974 |
| Diabetes, n (%) | 973(48.9%) | 110(52.1%) | 78(37.7%) | 785(49.9%) | 0.0025 |
| Medications for diabetes patients | 0.3439 | ||||
| Insulin only, n (%) | 98(10.1%) | 15(13.6%) | 7(9.0%) | 76(9.7%) | |
| Oral only, n (%) | 211(21.7%) | 16(14.6%) | 17(21.8%) | 178(18.3%) | |
| Both Insulin and Oral, n (%) | 139(14.3%) | 21(19.1%) | 12(15.4%) | 106(13.5%) | |
| Not on any medications, n (%) | 525(54.0%) | 58(52.7%) | 42(53.9%) | 425(54.1%) | |
| Median length of follow-up (Interquartile range) | 7.6(4.3,11.1) | 9.0(5.8,12.5) | 7.2(4.8,10.5) | 7.4(4.2,11.1) | <0.0001 |
| Mean glucose measures per person per year (sd) | 1.1(1.0) | 1.1(1.0) | 1.1(0.9) | 1.1(1.0) | 0.8669 |
| APOE Genotyped | All (n=1255) | CI (n=149) | D (n=145) | N (n=961) | p-value |
| APOE ɛ4 carriers, n (%) | 434 (34.6%) | 60(40.3%) | 76(52.4%) | 298(31.0%) | <0.0001 |
In Table 2, we present results from the mixed effects model with repeated glucose measures as the outcome variable in participants who do not have diabetes. There was no significant group and time interaction indicating that changes in glucose over time did not differ among the three groups. In Table 3, results of the mixed effects model for glucose in participants with diabetes are presented. Participants who had dementia had a significant decrease in glucose compared to participants with MCI and those who were normal while participants with MCI did not differ from those in the normal group adjusting for gender, age at baseline, BMI and diabetic medications. Figure 1 illustrates the differences in glucose levels over time for participants in the three groups. Participants with incident dementia had significantly higher glucose levels than those with MCI and in the normal group many years before their diagnosis. However, with the steady decrease in glucose levels over time for participants with dementia, glucose levels appeared similar among the three groups within three years of index time which was the time of diagnosis for participants with dementia and the last evaluation time for the rest of the participants.
Table 2.
Results from final mixed effects model with repeated glucose levels over time as the dependent variable in participants without diabetes (n=1018).
| Independent Variables | Parameter Estimate | Standard Error | p-value |
|---|---|---|---|
| Female | −3.1977 | 1.1252 | 0.0045 |
| Time | 0.4614 | 0.2228 | 0.0383 |
| Group | 0.6818 | ||
| MCI | −0.9466 | 1.9256 | 0.6230 |
| Dementia | 1.2008 | 1.8354 | 0.5130 |
| Normal | ref | – | – |
| Time2 | 0.04630 | 0.01650 | 0.0050 |
| Group*time | 0.0953 | ||
| MCI*time | −0.3804 | 0.2053 | 0.0639 |
| Dementia*time | 0.2115 | 0.2469 | 0.3917 |
| Normal*time | ref | – | – |
Table 3.
Results from mixed effects model with repeated glucose levels over time as the dependent variable in participants with diabetes (n=973).
| Independent Variables | Parameter Estimate | Standard Error | p-value |
|---|---|---|---|
| Female | −6.8003 | 2.9223 | 0.0200 |
| Age at baseline | −0.5086 | 0.2329 | 0.0290 |
| BMI | −0.1361 | 0.2610 | 0.6021 |
| Diabetes Meds | |||
| Insulin only | 8.7675 | 5.0160 | 0.0805 |
| Oral only | −0.3222 | 3.7077 | 0.9308 |
| Both Oral and Insulin | 15.7825 | 4.2845 | 0.0002 |
| None | ref | – | – |
| Time | 1.8708 | 0.8551 | 0.0287 |
| Group | 0.4511 | ||
| MCI | −2.9185 | 4.6130 | 0.5270 |
| Dementia | −7.1591 | 5.4719 | 0.1908 |
| Normal | ref | – | – |
| BMI*time | −0.08142 | 0.02732 | 0.0029 |
| Group*time | |||
| MCI*time | −0.2691 | 0.4424 | 0.5430 |
| Dementia*time | −2.1840 | 0.5819 | 0.0002 |
| Normal*time | ref | – | – |
| Diabetes Meds*time | |||
| Insulin only*Time | −1.4708 | 0.4953 | 0.0030 |
| Oral only*Time | −0.1862 | 0.3899 | 0.6329 |
| Both Oral and Insulin*Time | −0.4650 | 0.4150 | 0.2626 |
| None*Time | ref | – | – |
Figure 1.
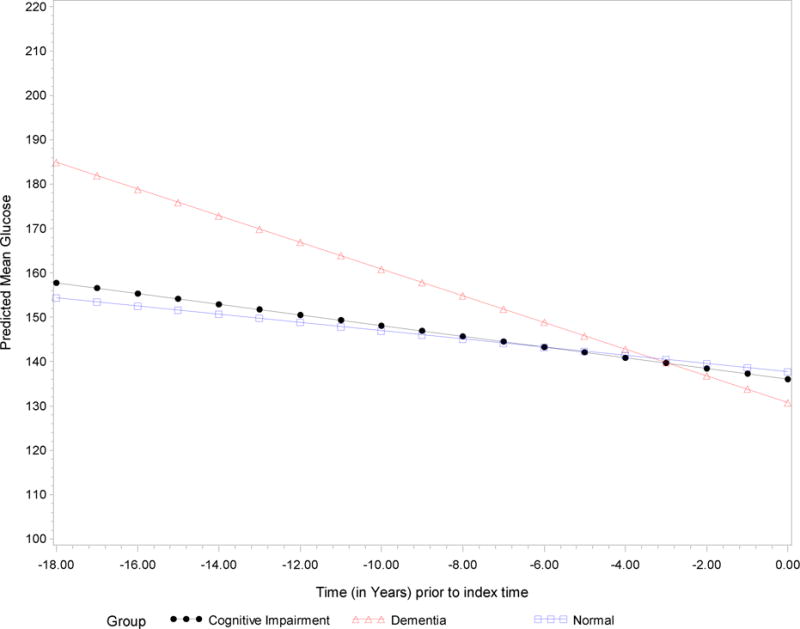
Predicted mean glucose levels over time in diabetic participants diagnosed with dementia, mild cognitive impairment and normal cognition.
In Table 4, we compared the rates of diabetes complications among participants with dementia, MCI and normal groups using ICD-9 codes from the EMR following the classifications published previously.[19] Participants with diabetes who were diagnosed with dementia during follow-up had significantly higher rates of cerebrovascular disease (35.9%) than those who were diagnosed with MCI (12.7%) or those in the normal group (12.1%). There were no significant differences in the rates of other complications among the three groups (p=0.4671). The three groups also did not differ in the total numbers of other complications (p=0.1042).
Table 4.
Comparisons of the rates of diabetic complication in participants with diabetes (n=973).
| Complications | All (n=973) | MCI (n=110) | Dementia (n=78) | Normal (n=785) | p-value |
|---|---|---|---|---|---|
| Retinopathy | 242(24.9%) | 34(30.9%) | 21(26.9%) | 187(23.8%) | 0.2485 |
| Nephropathy | 223(22.9%) | 30(27.3%) | 20(25.6%) | 173(22%) | 0.3961 |
| Neuropathy | 220(22.6%) | 29(26.4%) | 19(24.4%) | 172(21.9%) | 0.5376 |
| Cerebrovascular disease | 137(14.1%) | 14(12.7%) | 28(35.9%) | 95(12.1%) | <.0001 |
| Cardiovascular disease | 262(26.9%) | 34(30.9%) | 20(25.6%) | 208(26.5%) | 0.5987 |
| Peripheral vascular disease | 193(19.8%) | 28(25.5%) | 15(19.2%) | 150(19.1%) | 0.2918 |
| Metabolic disease | 5(0.5%) | 1(0.9%) | 0(0%) | 4(0.5%) | 0.6910 |
| With any complication other than CVD | 627(64.4%) | 76(69.1%) | 51(65.4%) | 500(63.7%) | 0.4671 |
| No complication, n (%) | 324(33.3%) | 32(29.1%) | 23(29.5%) | 269(34.3%) | |
| Total number of complications other than CVD | 1.8(1.0) | 2.1(1.0) | 1.9(1.1) | 1.8(1.0) | 0.1042 |
Additional analyses restricting the dementia group to AD or excluding those with cerebrovascular disease revealed similar but less steep decreases in glucose level in the group without cerebrovascular disease or with AD (see eTables 1 and 2). Further analyses accounting for changes in BMI or albumen levels (see eResults, eTables 3 and 4 and eFigures 1 and 2) indicate that the decrease in glucose levels in dementia participants was independent of changes in BMI (see eResults and eTable 5). Comparisons of characteristics between participants included in the analyses and those excluded due to lack of glucose measures are also included. The 1787 participants excluded from the study tended to be men, have less education, but with lower rates of co-morbidities including diabetes (see eTable 6).
5. Discussion
In this analysis using repeated glucose measures obtained up to 18 years before the diagnosis of dementia, we found that among participants with diabetes, those who develop incident dementia had higher glucose levels compared to those who develop MCI or those with normal cognition. We also found that among the participants with diabetes, those who developed incident dementia experienced a significant decline in glucose levels in the years prior to the dementia diagnosis compared to participants with MCI and normal participants.
Our finding of an association between high glucose levels and increased risk of dementia is similar to that reported by Crane et al but in our study the association was confined only to those participants with diabetes. The reason for this discrepancy is unclear. Our population was African American. Differences in glucose homeostasis have been reported between African American and white populations and the rates of diabetes are higher in African Americans [20, 21]. In our study 48.9% of the participants had diabetes as compared to <10% in the Crane study. A statistically significant relationship with high glucose levels and dementia risk persisted in the participants with diabetes until at least nine years prior to diagnoses in our study. The Seattle group reported a significant relationship up to 5–8 years prior to diagnosis. This difference may be attributable to the differences in statistical methods used between the studies.
Perhaps the most striking finding from this study was the highly significant decline in glucose levels that occurred in the participants with diabetes in the years prior to the diagnosis of dementia but not in participants that were adjudicated with MCI or no cognitive impairment. We could find no published study that reported similar findings using the innovative analytic methodology we applied. One possible explanation for these findings is that the severe hyperglycemia, which in previous reports has been associated with increased risk for dementia perhaps by accelerating brain macrovascular disease [11], also induces direct neuronal damage [22]. This direct effect on neurons and glia could impair regions of the brain such as the hypothalamus and other medullary regions and disrupt central pathways related to hypoglycemia awareness or glucose counter regulatory responses. Our results are consistent with the findings of Brinton and her colleagues suggesting there is a shift in the brain metabolic profile from a glucose-driven to a less efficient ketogenic pathway at least in elderly women [23]. It is also possible that physicians when confronted with high glucose levels increased the number or dosage of anti-diabetic medications. We found no significant differences in types of anti-diabetic medication used between the groups, and no increased use of insulin in the group that developed dementia. However, there could have been dose differences within the same medication types that were not captured in our analysis.
In a previous paper we reported a significantly increased risk for cognitive decline in our African American participants with diabetes and that this appeared to be mediated primarily by increased levels of cerebrovascular pathology, particularly incident stroke, in the diabetic participants [16]. In this analysis, when the rates of possible diabetic complications were compared among the three groups, only cerebrovascular disease was significantly higher in the group of participants with incident dementia. When participants with cerebrovascular disease are excluded from the study, the association between change in glucose levels and dementia weakened (see eTable 2). When the analyses are limited to participants with probable and possible AD, the association between dementia and change in glucose levels also become non-significant (see eTable 1). These findings do support the hypothesis that the association between high and subsequently declining glucose levels and dementia are mediated to a significant degree by increased levels of cerebrovascular disease in these participants.
Results from other studies have also suggested an early effect on metabolic homeostatic mechanisms during the dementing process. In a prior analysis we reported a similar finding with declining BMI levels in participants who developed dementia [24]. Mielke et al reported that both declining cholesterol levels and declining BMI were associated with incident dementia, and suggested that this finding may be related either to brain pathology occurring in the hypothalamus area, or to reduction of appetite caused by incipient dementia symptoms such as apathy and depression [25]. In an attempt to explore this latter possibility we also included BMI levels and albumin levels in our analysis. BMI levels but not albumin levels showed a significant difference in decline between participants with incident dementia and those in the other diagnostic groups (see eTables 3 and 4 and eFigures 1 and 2). When changes in BMI are incorporated into the models the decline in glucose levels remained in participants with incident dementia (see eTable 5). This finding, together with the lengthy pre-dementia time period of the changes, supports the suggestion by Meilke et al that these changes are related to brain pathology rather than being a product of apathy or depression. The fact that no decline in glucose levels was detected in participants with MCI might appear to contradict this hypothesis, but in our study MCI outcomes were very heterogeneous. The MCI participants who subsequently developed dementia are included in our dementia subgroup.
In summary, the results of these analyses add to accumulating evidence that high glucose levels are associated with an increased risk for dementia and that this risk accrues over many years prior to a dementia diagnosis in participants with diabetes. We also report that after a period of elevated serum glucose levels, these levels decline significantly as the patient progresses toward a clinical diagnosis of dementia. This decline in glucose levels together with a decline in BMI may well represent a powerful pre-symptomatic metabolic indicator for future dementia in participants with diabetes. A similar pattern of changes in blood pressure in the period preceding dementia have also been reported. These potential metabolic changes could be due to the underlying pathology leading to dementia or may directly contribute to this pathology. It will be important to investigate in the future whether interventions that alter these metabolic changes offer a pathway for prevention of dementia.
5.1 Strengths
The current study has a number of strengths. The participants represent a well-characterized community-based random sample of elderly African Americans who received standardized clinical assessments and consensus- based clinical diagnoses using the same diagnostic criteria over time. The follow up period was lengthy. The use of EMR allowed the access to repeated laboratory measures associated with outpatient visits. Although many research studies have measured glucose as part of biomarker panel, few have the resources to support the collection of repeated biomarker measures.
5.2 Limitations
This analysis was confined only to those participants with repeated glucose level measurements which was approximately 50% of the total sample. The 1787 participants excluded from the study tended to be men, have less education, but with lower rates of co-morbidities including diabetes which may explain the lack of repeated glucose measures (see eTable 6).
It was not possible from our database to distinguish between fasting and non-fasting glucose levels nor did this analysis include estimates of glucose variability which has also been proposed as an independent risk factor for diabetic complications including dementia. Information on antidiabetic drug dosage was not available for this analysis.
Reports from previous studies have suggested that midlife rather than late life diabetes is a risk factor for dementia and that longer duration is associated with greater risk [28, 29]. Unfortunately our electronic medical record system, which was unable to capture midlife data for all participants in our cohort, did not allow us to address this issue.
As mentioned previously our population is African Americans who have reported higher rates of diabetes and differences in glucose metabolism as compared to white populations.
Supplementary Material
Highlights.
High glucose levels increased risk for dementia in diabetic patients.
Glucose levels significantly declined as the patient progressed to dementia.
These findings may represent a strong early metabolic indicator for dementia.
Acknowledgments
Dr. Hendrie and Dr. Gao had full access to all the data in the study and take responsibility for the integrity of the data and the accuracy of the data analysis. No authors have any conflicts of interest. This research was supported by NIH grant RO1 AG0145350 and NIH grant P30 AG10133.
Footnotes
Publisher's Disclaimer: This is a PDF file of an unedited manuscript that has been accepted for publication. As a service to our customers we are providing this early version of the manuscript. The manuscript will undergo copyediting, typesetting, and review of the resulting proof before it is published in its final citable form. Please note that during the production process errors may be discovered which could affect the content, and all legal disclaimers that apply to the journal pertain.
Conflicts of interest: none.
References
- 1.Dementia and Risk Reduction: an analysis of protective and modifiable factors. Alzheimer’s Disease International; 2014. World Alzheimer Report 2014. [Google Scholar]
- 2.Luchsinger JA. Diabetes, related conditions, and dementia. J Neurol Sci. 2010;299:35–8. doi: 10.1016/j.jns.2010.08.063. [DOI] [PMC free article] [PubMed] [Google Scholar]
- 3.Hughes TM, Sink KM. Hypertension and Its Role in Cognitive Function: Current Evidence and Challenges for the Future. Am J Hypertens. 2016;29:149–57. doi: 10.1093/ajh/hpv180. [DOI] [PMC free article] [PubMed] [Google Scholar]
- 4.Deckers K, van Boxtel MP, Schiepers OJ, de Vugt M, Munoz Sanchez JL, Anstey KJ, et al. Target risk factors for dementia prevention: a systematic review and Delphi consensus study on the evidence from observational studies. Int J Geriatr Psychiatry. 2015;30:234–46. doi: 10.1002/gps.4245. [DOI] [PubMed] [Google Scholar]
- 5.Lam DW, LeRoith D. The worldwide diabetes epidemic. Curr Opin Endocrinol Diabetes Obes. 2012;19:93–6. doi: 10.1097/MED.0b013e328350583a. [DOI] [PubMed] [Google Scholar]
- 6.Cheng D, Noble J, Tang MX, Schupf N, Mayeux R, Luchsinger JA. Type 2 diabetes and late-onset Alzheimer’s disease. Dement Geriatr Cogn Disord. 2011;31:424–30. doi: 10.1159/000324134. [DOI] [PMC free article] [PubMed] [Google Scholar]
- 7.Ohara T, Doi Y, Ninomiya T, Hirakawa Y, Hata J, Iwaki T, et al. Glucose tolerance status and risk of dementia in the community: the Hisayama study. Neurology. 2011;77:1126–34. doi: 10.1212/WNL.0b013e31822f0435. [DOI] [PubMed] [Google Scholar]
- 8.Akomolafe A, Beiser A, Meigs JB, Au R, Green RC, Farrer LA, et al. Diabetes mellitus and risk of developing Alzheimer disease: results from the Framingham Study. Arch Neurol. 2006;63:1551–5. doi: 10.1001/archneur.63.11.1551. [DOI] [PubMed] [Google Scholar]
- 9.Whitmer RA, Sidney S, Selby J, Johnston SC, Yaffe K. Midlife cardiovascular risk factors and risk of dementia in late life. Neurology. 2005;64:277–81. doi: 10.1212/01.WNL.0000149519.47454.F2. [DOI] [PubMed] [Google Scholar]
- 10.Yamada M, Kasagi F, Sasaki H, Masunari N, Mimori Y, Suzuki G. Association between dementia and midlife risk factors: the Radiation Effects Research Foundation Adult Health Study. J Am Geriatr Soc. 2003;51:410–4. doi: 10.1046/j.1532-5415.2003.51117.x. [DOI] [PubMed] [Google Scholar]
- 11.Crane PK, Walker R, Larson EB. Glucose levels and risk of dementia. N Engl J Med. 2013;369:1863–4. doi: 10.1056/NEJMc1311765. [DOI] [PubMed] [Google Scholar]
- 12.Sutphen CL, Jasielec MS, Shah AR, Macy EM, Xiong C, Vlassenko AG, et al. Longitudinal Cerebrospinal Fluid Biomarker Changes in Preclinical Alzheimer Disease During Middle Age. JAMA Neurol. 2015;72:1029–42. doi: 10.1001/jamaneurol.2015.1285. [DOI] [PMC free article] [PubMed] [Google Scholar]
- 13.Hall KS, Gao S, Baiyewu O, Lane KA, Gureje O, Shen J, et al. Prevalence rates for dementia and Alzheimer’s disease in African Americans: 1992 versus 2001. Alzheimers Dement. 2009;5:227–33. doi: 10.1016/j.jalz.2009.01.026. [DOI] [PMC free article] [PubMed] [Google Scholar]
- 14.Hendrie HC, Osuntokun BO, Hall KS, Ogunniyi AO, Hui SL, Unverzagt FW, et al. Prevalence of Alzheimer’s disease and dementia in two communities: Nigerian Africans and African Americans. Am J Psychiatry. 1995;152:1485–92. doi: 10.1176/ajp.152.10.1485. [DOI] [PubMed] [Google Scholar]
- 15.Hendrie HC, Ogunniyi A, Hall KS, Baiyewu O, Unverzagt FW, Gureje O, et al. Incidence of dementia and Alzheimer disease in 2 communities: Yoruba residing in Ibadan, Nigeria, and African Americans residing in Indianapolis, Indiana. JAMA. 2001;285:739–47. doi: 10.1001/jama.285.6.739. [DOI] [PubMed] [Google Scholar]
- 16.Wessels AM, Lane KA, Gao S, Hall KS, Unverzagt FW, Hendrie HC. Diabetes and cognitive decline in elderly African Americans: a 15-year follow-up study. Alzheimers Dement. 2011;7:418–24. doi: 10.1016/j.jalz.2010.07.003. [DOI] [PMC free article] [PubMed] [Google Scholar]
- 17.Hendrie HC, Baiyewu O, Lane KA, Purnell C, Gao S, Hake A, et al. Homocysteine levels and dementia risk in Yoruba and African Americans. Int Psychogeriatr. 2013;25:1859–66. doi: 10.1017/S1041610213001294. [DOI] [PMC free article] [PubMed] [Google Scholar]
- 18.McDonald CJ, Overhage JM, Barnes M, Schadow G, Blevins L, Dexter PR, et al. The Indiana network for patient care: a working local health information infrastructure. An example of a working infrastructure collaboration that links data from five health systems and hundreds of millions of entries. Health Aff (Millwood) 2005;24:1214–20. doi: 10.1377/hlthaff.24.5.1214. [DOI] [PubMed] [Google Scholar]
- 19.Young BA, Lin E, Von Korff M, Simon G, Ciechanowski P, Ludman EJ, et al. Diabetes complications severity index and risk of mortality, hospitalization, and healthcare utilization. Am J Manag Care. 2008;14:15–23. [PMC free article] [PubMed] [Google Scholar]
- 20.Meigs JB, Grant RW, Piccolo R, Lopez L, Florez JC, Porneala B, et al. Association of African genetic ancestry with fasting glucose and HbA1c levels in non-diabetic individuals: the Boston Area Community Health (BACH) Prediabetes Study. Diabetologia. 2014;57:1850–8. doi: 10.1007/s00125-014-3301-1. [DOI] [PMC free article] [PubMed] [Google Scholar]
- 21.Menke A, Casagrande S, Geiss L, Cowie CC. Prevalence of and Trends in Diabetes Among Adults in the United States, 1988–2012. JAMA. 2015;314:1021–9. doi: 10.1001/jama.2015.10029. [DOI] [PubMed] [Google Scholar]
- 22.Gold SM, Dziobek I, Sweat V, Tirsi A, Rogers K, Bruehl H, et al. Hippocampal damage and memory impairments as possible early brain complications of type 2 diabetes. Diabetologia. 2007;50:711–9. doi: 10.1007/s00125-007-0602-7. [DOI] [PubMed] [Google Scholar]
- 23.Klosinski LP, Yao J, Yin F, Fonteh AN, Harrington MG, Christensen TA, et al. White Matter Lipids as a Ketogenic Fuel Supply in Aging Female Brain: Implications for Alzheimer’s Disease. EBioMedicine. 2015;2:1888–904. doi: 10.1016/j.ebiom.2015.11.002. [DOI] [PMC free article] [PubMed] [Google Scholar]
- 24.Gao S, Nguyen JT, Hendrie HC, Unverzagt FW, Hake A, Smith-Gamble V, et al. Accelerated weight loss and incident dementia in an elderly African-American cohort. J Am Geriatr Soc. 2011;59:18–25. doi: 10.1111/j.1532-5415.2010.03169.x. [DOI] [PMC free article] [PubMed] [Google Scholar]
- 25.Mielke MM, Zandi PP, Shao H, Waern M, Ostling S, Guo X, et al. The 32-year relationship between cholesterol and dementia from midlife to late life. Neurology. 2010;75:1888–95. doi: 10.1212/WNL.0b013e3181feb2bf. [DOI] [PMC free article] [PubMed] [Google Scholar]
- 26.Joas E, Backman K, Gustafson D, Ostling S, Waern M, Guo X, et al. Blood pressure trajectories from midlife to late life in relation to dementia in women followed for 37 years. Hypertension. 2012;59:796–801. doi: 10.1161/HYPERTENSIONAHA.111.182204. [DOI] [PubMed] [Google Scholar]
- 27.Stewart R, Xue QL, Masaki K, Petrovitch H, Ross GW, White LR, et al. Change in blood pressure and incident dementia: a 32-year prospective study. Hypertension. 2009;54:233–40. doi: 10.1161/HYPERTENSIONAHA.109.128744. [DOI] [PMC free article] [PubMed] [Google Scholar]
- 28.Roberts RO, Knopman DS, Przybelski SA, Mielke MM, Kantarci K, Preboske GM, et al. Association of type 2 diabetes with brain atrophy and cognitive impairment. Neurology. 2014;82:1132–41. doi: 10.1212/WNL.0000000000000269. [DOI] [PMC free article] [PubMed] [Google Scholar]
- 29.West RK, Ravona-Springer R, Schmeidler J, Leroith D, Koifman K, Guerrero-Berroa E, et al. The association of duration of type 2 diabetes with cognitive performance is modulated by long-term glycemic control. Am J Geriatr Psychiatry. 2014;22:1055–9. doi: 10.1016/j.jagp.2014.01.010. [DOI] [PMC free article] [PubMed] [Google Scholar]
Associated Data
This section collects any data citations, data availability statements, or supplementary materials included in this article.