

Summary
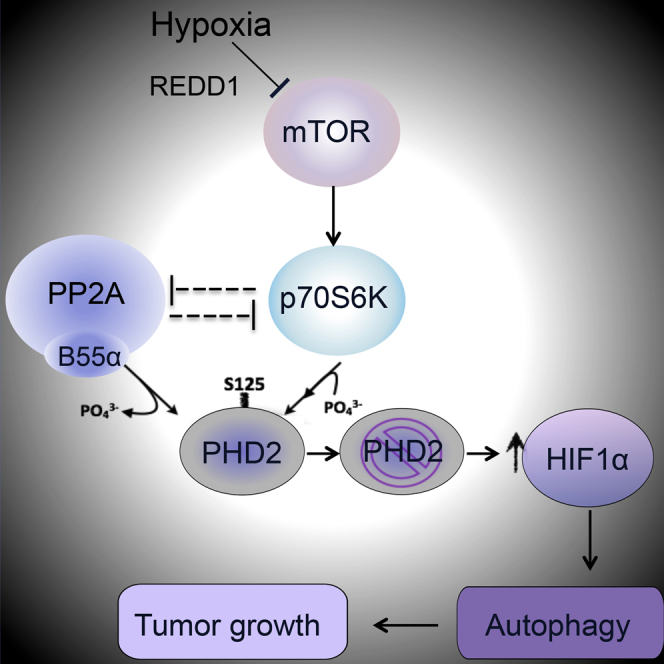
Oxygen-dependent HIF1α hydroxylation and degradation are strictly controlled by PHD2. In hypoxia, HIF1α partly escapes degradation because of low oxygen availability. Here, we show that PHD2 is phosphorylated on serine 125 (S125) by the mechanistic target of rapamycin (mTOR) downstream kinase P70S6K and that this phosphorylation increases its ability to degrade HIF1α. mTOR blockade in hypoxia by REDD1 restrains P70S6K and unleashes PP2A phosphatase activity. Through its regulatory subunit B55α, PP2A directly dephosphorylates PHD2 on S125, resulting in a further reduction of PHD2 activity that ultimately boosts HIF1α accumulation. These events promote autophagy-mediated cell survival in colorectal cancer (CRC) cells. B55α knockdown blocks neoplastic growth of CRC cells in vitro and in vivo in a PHD2-dependent manner. In patients, CRC tissue expresses higher levels of REDD1, B55α, and HIF1α but has lower phospho-S125 PHD2 compared with a healthy colon. Our data disclose a mechanism of PHD2 regulation that involves the mTOR and PP2A pathways and controls tumor growth.
Graphical Abstract
Highlights
-
•
PHD2 is phosphorylated at Ser125 by P70S6K and dephosphorylated by PP2A/B55α
-
•
PHD2 dephosphorylation impairs its function, resulting in increased HIF1α accumulation
-
•
HIF1α promotes CRC survival in hypoxia via autophagy in a PHD2/B55α-dependent fashion
-
•
B55α silencing blocks CRC tumor growth in vitro and in vivo; this is PHD2 dependent
Di Conza et al. find that PP2A/B55α dephosphorylates and partly inactivates PHD2, leading to augmented HIF1α and CRC cell survival in hypoxia through autophagy. Dephosphorylated PHD2 and B55α accumulate in CRC human specimens versus normal colon, and B55α targeting impairs CRC neoplastic growth in vitro and in mice.
Introduction
Tumor hypoxia correlates with unfavorable disease outcome, malignancy, and resistance to therapy (De Bock et al., 2011). The main executors of the cellular response to hypoxia are the hypoxia-inducible factors (HIFs) HIF1 and HIF2, which are negatively regulated by the HIF prolyl hydroxylase (PHD) family members PHD1, PHD2, and PHD3. Following hydroxylation in specific prolyl residues, the alpha subunits of HIF1 and HIF2 are targeted for ubiquitination and proteasomal degradation (Epstein et al., 2001, Keith et al., 2011).
Although the activity of PHDs is reduced by hypoxia, this is a graded effect, and, because of their high affinity for oxygen (KM = 100–250 μM), significant PHD activity is still observed at 1% oxygen (Chan et al., 2005, Epstein et al., 2001, Pan et al., 2007, Stolze et al., 2004). Indeed, several reports document that HIFs still become hydroxylated under nearly anoxic conditions (Chan et al., 2005, Epstein et al., 2001). Under these conditions, manipulation of PHD levels or activity can be a key determinant in the hydroxylation rate of HIFα (Chan et al., 2005, Epstein et al., 2001, Pan et al., 2007, Stolze et al., 2004). Transcriptional induction of PHD2 and PHD3 (EGLN1 and EGLN3, respectively) during chronic hypoxia presumably prevents a deleterious HIF response upon reoxygenation (Appelhoff et al., 2004, Epstein et al., 2001, Ginouvès et al., 2008).
Although HIF levels have mostly been associated with a poor prognosis of several tumor histotypes, the correlation between PHD abundance and cancer progression is less clear (Jokilehto and Jaakkola, 2010). This is likely due to the fact that mechanisms besides protein level regulation, including oxygen, cofactor bioavailability, and post-translational modifications (e.g., SUMOylation), can regulate the enzymatic function of PHDs (Jokilehto and Jaakkola, 2010, Núñez-O’Mara et al., 2015, Ortmann et al., 2016). The presence of phosphorylation sites in PHD2 has been predicted (http://www.phosphonet.ca), but their functional role is unclear.
mTOR is one of the main kinases involved in the regulation of protein synthesis and cell growth in response to nutrients and growth factors. When normal or cancer cells are exposed to starvation, mTOR is inhibited, and autophagy is induced mainly as a survival response. mTOR is also involved in the hypoxia response. In particular, HIF1α stabilization leads to early transcription of REDD1, which works as a negative regulator of mTOR and restrains its activity in hypoxia (Brugarolas et al., 2004). Full inactivation of mTOR also requires the engagement of the PP2A phosphatase (Hartley and Cooper, 2002, Peterson et al., 1999, Roberts et al., 2014), further blocking this pathway by directly dephosphorylating and inhibiting P70S6-kinase (P70S6K) downstream of mTOR.
PP2A is a ubiquitously expressed serine-threonine phosphatase. It is a trimeric complex formed by a catalytic C subunit, a scaffold A subunit, and a regulatory B subunit, which confers specificity of PP2A for selective substrates. Fifteen B subunit genes encoding 26 different isoforms give rise to more than 100 combinations of the PP2A holoenzyme, leading to a large spectrum of biological activities (Seshacharyulu et al., 2013). In cancer, PP2A is considered to be a tumor suppressor because its main inhibitor, okadaic acid, was shown to have tumor-promoting activity (Bialojan and Takai, 1988). However, the complexity of the PP2A structure suggests that the presence of different B subunits might determine different phenotypes in the context of cancer.
Results
P70S6K-Mediated Phosphorylation of PHD2 on S125 Controls HIF1α Levels
Mass spectrometry analysis of wild-type PHD2 (PHD2WT) revealed three phosphorylation sites in S12, S14, and S125. Mutation of S125 to alanine (PHD2S125A) impaired PHD2 ability to reduce the signal emitted by a luciferase fused to an oxygen-dependent degradation domain (Luc-ODDD) or to degrade HIF1α compared with wild-type PHD2 (Figures 1A–1C; Table S1), suggesting that phosphorylation at S125 modulates its function. In contrast, PHD2S12A or PHD2S14A mutants displayed similar activity as PHD2WT (Figures 1B and 1C). To further investigate the effect of PHD2 mutants on HIF1α levels, we transfected HEK293T or DLD1 cells with PHD2WT, PHD2S125A, or PHD2S125D (which mimics constitutive phosphorylation). PHD2WT as well as PHD2S125D induced degradation of both exogenous and endogenous HIF1α (Figures 1D and 1E; Table S1), whereas the mutant PHD2S125A showed impaired function. Similarly, HT29 cells exposed to the proteasome inhibitor MG132 showed partial HIF1α degradation upon overexpression of PHD2WT and PHD2S125D but not of PHD2S125A (Figure 1F; Table S1). Prolonged exposure to MG132 overruled the differential activity of all PHD2 isoforms (PHD2WT, PHD2S125A, and PHD2S125D), as indicated by the equalized HIF1α levels (Figure S1A). In hypoxia, the activity of these PHD2 isoforms on HIF1α resembled what was observed previously (Figure 1F; Table S1). Moreover, the half-life of HIF1α was strongly reduced in the presence of PHD2WT and PHD2S125D, whereas, under the same conditions, expression of PHD2S125A correlated with a longer HIF1α half-life (Figure 1G). To test whether PHD2 phosphorylation might affect its enzymatic activity, we measured HIF1α hydroxylation. In both HEK293T and DLD1 cells, hydroxylation of overexpressed HIF1α was 40% to 55% lower in the presence of PHD2S125A than with PHD2WT (Figure 1H). Similarly, upon treatment with the proteasome inhibitor MG132 (which equalizes the total levels of HIF1α under all conditions), hydroxylation of endogenous HIF1α by PHD2S125A was halved compared with the amount detected in the presence of PHD2WT (Figure 1I). These data indicate that the lack of phosphorylation of PHD2 on S125 impairs its hydroxylase function, leading to a longer HIF1α half-life.
Figure 1.

Phosphorylation of S125 by P70S6K Is Important to Control HIF1α Levels
(A) MS/MS spectrum of NH2-AKPPADPAAAAS < p > PCR-COOH (S < p > indicates phosphoserine). Nine of 15 amino acids, including the phosphorylated serine, are covered by a ladder of y-type fragment ions. The neutral loss peak (−98 Da) characteristic for phosphorylated peptides is the most intense peak of the spectrum at 492.9 mass-to-charge ratio (m/z).
(B) Luciferase activity of HEK293T cells stably overexpressing an oxygen-dependent degradable luciferase (Luc-ODDD) transfected with plasmids carrying wild-type (WT) or mutant PHD2 (S12A, S14A, and S125A) or an empty vector (EV) as a control.
(C) Western blot (WB) of HEK293T cells transfected with HIF1α, alone (EV) or in combination with WT or mutant PHD2 (S12A, S14A, and S125A).
(D) WB of HEK293T cells transfected with HIF1α, alone (EV) or in combination with PHD2WT, PHD2S125A, or PHD2S125D.
(E) WB of DLD1 cells transfected with PHD2WT, PHD2S125A, and PHD2S125D and exposed to hypoxia for 4 hr.
(F) HT29 cells were transfected with an EV or with PHD2WT, PHD2S125A, and PHD2S125D. After 16 hr, cells were treated with the proteasome inhibitor MG132 or exposed to hypoxic conditions for 4 hr, and whole cell extracts (WCEs) were analyzed by WB.
(G) DLD1 cells were transfected with PHD2WT, PHD2S125A, and PHD2S125D. After 16 hr, cells were treated with cycloheximide for the indicated time, and WCEs were analyzed by WB.
(H) HEK293T or DLD1 cells were transfected with HIF1α, alone (EV) or in combination with PHD2WT or PHD2S125A. Hydroxylation of HIF1α was detected by using antibody against OH-HIF1α.
(I) WB of DLD1 cells transfected with PHD2WT, PHD2S125A, and PHD2S125D and treated with MG132 (10 μM) for 8 hr.
(J) WB of HEK293T cells transfected with PHD2 treated with 1 μM Rapamycin, 200 nM Torin2, 10 μM PD169316, and 10 μM PD19058 for 16 hr.
(K) DLD1 cells were transfected with either EV or FLAG-PHD2 and with a control (siCTR) or a small interfering RNA (siRNA) targeting P70S6K (siP70S6K). After 24 hr, cells were lysed, and WCEs were analyzed by WB (left). 1 mg of EV or FLAG-PHD2 lysate was immunoprecipitated using anti-FLAG M2 beads to detect endogenous P70S6K kinase (right).
(L) Purified FLAG-PHD2 and PHD2 S125 proteins were phosphorylated with active P70S6K kinase in the presence of [32P]-γ-ATP for 20 min at 30°C. The specific P70S6K inhibitor LY2584702 was used to a final concentration of 50 μM. Proteins were separated by 10% SDS-PAGE, and incorporated radioactivity was detected by autoradiography (left). A WB of PHD2 input was used as a loading control (right).
(M) HEK293T were transfected with FLAG-PHD2 and silenced with siP70S6K or siCTR. Then cells were lysed, and WCEs were analyzed by WB. 1 mg of EV or FLAG-PHD2 lysate was immunoprecipitated using anti-FLAG M2 beads to detect endogenous phosphorylated PHD2 (right).
(N) WB of DLD1 cells transfected with siCTR or siP70S6K and exposed to hypoxia for 4 hr.
(O) WB of HEK293T cells overexpressing HIF1α and silenced with siP70S6K or siCTR.
All WBs were repeated three times on independent biological replicates. ∗p < 0.05 versus EV in (B) and versus all other conditions in (H) and (I). Graphs show mean ± SEM. See also Figure S1.
To unveil the kinase responsible for PHD2 phosphorylation, we blocked the predicted PHD serine kinases (http://www.phosphonet.ca) and used a specific phospho-PHD2 antibody as readout. Torin2 and Rapamycin, both blocking the mTOR pathway, were able to downmodulate phospho-PHD2 (Figure 1J; Table S1). In fact, we found that the serine/threonine kinase P70S6K, an mTOR target, was able to bind (Figure 1K) and directly phosphorylate PHD2 in vitro and in vivo (Figures 1L and 1M). Furthermore, P70S6K knockdown caused increased levels of both hypoxia-induced and overexpressed HIF1α (Figures 1N and 1O). Altogether, these results show that P70S6K phosphorylates PHD2 on S125, leading to enhanced HIF1α degradation.
PP2A/B55α Specifically Binds and Dephosphorylates PHD2 on S125
To assess whether a specific phosphatase complex could interact with PHD2, we performed a stable isotope labeling with amino acids in cell culture (SILAC)-based mass spectrometry analysis from which it emerged that the B55α regulatory subunit of the phosphatase family PP2A was able to co-immunoprecipitate with PHD2 (Table S2; Figure 2A). In HEK293T cells, overexpressed B55α pulls down endogenous PHD2 (Figure 2B, left). Vice versa, overexpressed PHD2 interacts with endogenous B55α (Figure 2B, right). Because in vitro-translated PHD2 and B55α were able to bind each other in a cell-free system (Figure 2C), this binding is direct and does not require other partners. In both DLD1 and HT29 colorectal cancer (CRC) cells, endogenous PHD2 and B55α were able to bind to each other (Figures 2D and 2E; Figure S1B), suggesting that this interaction occurs in different cell lines. PHD2 could pull down the PP2A catalytic subunit Cα as well, but only in the presence of B55α (Figure S1C). This interaction was specific for B55α because PHD2 did not bind in vitro-translated B55β, γ, or δ (Figure S1D). Thus, PHD2 interacts with PP2A specifically through B55α.
Figure 2.

PP2A/B55α Specifically Binds and Dephosphorylates PHD2 in S125
(A) Schematic of the PP2A holoenzyme. Subunits A (scaffold subunit) and C (catalytic subunit) form a complex that can combine with different regulatory B subunits responsible for the substrate and cell type specificity. B55α represents the α isoform of the family PR55.
(B) HEK293T cells were transfected with EV, B55α (FLAG-B55α), or PHD2 (FLAG-PHD2), and WCEs were analyzed by WB (right, WCE). 1 mg of EV or FLAG-B55α lysate was immunoprecipitated using anti-FLAG M2 beads to detect endogenous PHD2. 1 mg of EV or FLAG-PHD2 lysates was immunoprecipitated with anti-FLAG M2 beads to detect endogenous B55α.
(C) In vitro-translated pcDNA3/FLAG-PHD2 (FLAG-PHD2) or pcDNA3/FLAG (EV) was immunoprecipitated with anti-FLAG M2 beads after incubation with in vitro-translated B55α (HA-B55α), and immunocomplexes were detected by WB analysis.
(D and E) WCEs from DLD1 (D) or HT29 (E) were collected and immunoprecipitated with anti-B55α or anti-immunoglobulin G (IgG) as a control, and endogenous PHD2 in immunocomplexes was detected by WB analysis.
(F) WB of DLD1 cells transfected with either HIF1α or an HIF1α proline mutant (HIF1α-PP) and with siCTR or B55α (siB55α).
(G) WB of HEK293T cells transfected with an EV or PHD2 (WT or S125A), alone and in combination with B55α. After 24 hr, WCEs were analyzed by WB.
(H) In vitro phosphatase assay in which two synthetized peptides from PHD2 (WT or mutant sequence) and a positive control peptide were used as substrate of cell-isolated PP2A complex. The result indicates the absorbance released by free phosphate groups following the dephosphorylation reaction. NT, not treated.
(I and J) In vitro dephosphorylation assay where FLAG-PHD2 isolated from HEK293T cells was incubated alone or with immune-purified FLAG-B55α in dephosphorylation buffer (J). The anti-FLAG immunoprecipitation performed to isolate B55α shows the presence of PP2A/A and PP2A/C in the immunocomplexes (I). The phosphorylation status of PHD2 was detected by WB using a phospho-specific antibody (phospho-S125).
(K and L) DLD1 cells were transfected with siCTRL, or siB55α, or siP70S6K in triplicate. Total proteins were extracted, and liquid chromatography (LC)/MS was performed. Phosphorylated and non-phosphorylated PHD2 were absolutely quantified using parallel-reaction monitoring (PRM) and stable isotope-labeled (SIL) reference peptides of known concentrations (K). WB of the samples was performed as a control (L).
All WBs and immunoprecipitations were repeated three times on independent biological replicates. The graphs show mean ± SEM. See also Figure S2.
We then assessed the effect of this interaction on PHD2 activity with respect to HIF1α stabilization. Co-expression of B55α prevented the degradation of HIF1α induced by PHD2WT but failed to regulate the activity of PHD2S125A, indicating that PP2A/B55α acts specifically on S125 (Figure S1E). Only PHD2, but not PHD1 or PHD3, activity was increased by the administration of the PP2A inhibitor LB100, pointing to the specific relevance of this post-translational modification for PHD2 but not for the other family members (Figure S1F). Supporting the inhibitory effect of PP2A/B55α on PHD2-mediated HIF1α degradation, silencing of B55α in HEK293T cells could reduce the levels of wild-type HIF1α, but it did not have any effect on the HIF1α mutant (HIF1α-PP and also HIF1αP402A/P564G), where P402 and P564 (normally hydroxylated by PHD2) were replaced by alanine and glycine, respectively (Figure 2F; Table S3). Proving the direct effect of PP2A/B55α on PHD2 phosphorylation, B55α overexpression could reduce the phosphorylation of PHD2WT on S125, whereas phosphorylation of PHD2S125A was undetectable under these conditions (Figure 2G; Table S3). A phosphatase assay showed that PP2A/B55α induced dephosphorylation of a PHD2-derived peptide in S125 (or of a standard peptide used as a positive control) but not of the mutated form (Figure 2H). This reaction was prevented by the PP2A inhibitor okadaic acid (OA) (Figure 2H). To confirm this observation, recombinant PHD2WT was dephosphorylated at S125 in the presence of purified B55α-containing PP2A complex (Figures 2I and 2J; Table S3). Similarly, phosphorylation of endogenous PHD2 was increased by silencing of B55α and decreased by silencing of P70S6K (Figure 2K), whereas total PHD2 levels were not affected (Figure 2L; Table S3). Altogether, these data demonstrate that PHD2 is dephosphorylated on S125 by PP2A/B55α and phosphorylated by the kinase P70S6K.
Release of PP2A/B55α Activity in Hypoxia Leads to PHD2 Dephosphorylation and Enhanced HIF1α Accumulation and Activity
To understand the relevance of PHD2 dephosphorylation in hypoxia, we exposed HT29 and DLD1 cells to low oxygen tensions; i.e., 1%, a concentration that still allows HIF hydroxylation by PHD2 (Berra et al., 2003; Figures 3A and 3B; Table S4). Under this condition, B55α knockdown prevented hypoxic HIF1α accumulation and activity in a PHD2-dependent manner (Figures 3A–3C; Table S4). Vice versa, degradation of HIF1α or Luc-ODDD in hypoxia could be achieved by overexpressing PHD2, but this process was prevented by co-expression of exogenous B55α (Figures S2A and S2B). These data demonstrate that, in hypoxia, PP2A/B55α contributes to HIF1α stabilization by dephosphorylating PHD2. Indeed, in a time-course fashion, we show that the peak of HIF1α occurs earlier in the presence of B55α than in its absence (Figure 3D) and that this event is associated with dephosphorylation of endogenous PHD2 already after exposure to hypoxia for 4 hr and, more robustly, at 16 hr (Figure 3E). Of interest, this dephosphorylation correlates with a progressive increase of PP2A activity, strongly reduced by siB55α or OA as control (Figure 3F). These data indicate a hypoxic molecular flow that, starting from the increase in PP2A/B55α activity, allows the decrease in PHD2 phosphorylation and, thus, HIF1α stabilization. Noteworthy is that, along the same time course, a progressive decrease of phosphorylated P70S6K occurs, partly antagonized by siB55α (Figure 3D). To further ascertain the temporal link between mTOR and P70S6K and PP2A, HIF1α accumulation was analyzed following reactivation of the mTOR pathway by silencing the hypoxia-induced mTOR inhibitor REDD1 (Brugarolas et al., 2004, Sofer et al., 2005). REDD1 silencing reduced HIF1α levels under hypoxic conditions, confirming that inhibition of mTOR signaling in hypoxia is favoring HIF1α stabilization (Figure 3G). B55α silencing also reduced HIF1α accumulation, and combination of both REDD1 and B55α knockdown had an additive effect (Figure 3G), supporting the idea that inhibition of mTOR/P70S6K-mediated PHD2 phosphorylation and activation of B55α are simultaneous events, both required for full accumulation of HIF1α in hypoxia.
Figure 3.

Hypoxia Blocks mTOR and Releases PP2A/B55α Activity to Dephosphorylate PHD2 and Increase HIF1α Protein Levels and Activity
(A and B) HT29 (A) or DLD1 (B) cells were transiently transfected with siCTR. siB55α, or siPHD2, alone or in combination. After 24 hr, cells were incubated either in normoxia (NRX, 21% O2) or hypoxia (HPX, 1% O2) for 16 hr, and WCEs were analyzed by WB.
(C) DLD1 cells were stably silenced for control, B55α, PHD2, or both (shCTR, shB55α, shPHD2, and shPHD2∣shB55α, respectively). These cells were then transiently transfected with a hypoxia-response element (HRE)-Luc reporter and incubated for 16 hr in normoxia or hypoxia. Cells were then lysed, and luciferase activity was measured and normalized for protein concentration.
(D) WB of DLD1 cells transiently transfected with siCTR siB55α and incubated in normoxia or in hypoxia for the indicated time. The graph represents quantification of three independent experiments.
(E) DLD1 cells were incubated in normoxia or hypoxia for the indicated time in the presence of a phosphate-free medium containing 1 mCi of [32P]orthophosphoric acid (NEN)/mL. WCEs were collected and immunoprecipitated with anti-PHD2 antibody. After blotting, the membrane was exposed to a Kodak phosphor imaging screen overnight. The graph shows the quantification and mean of two independent experiments.
(F) Measurement of the enzymatic activity of PP2A/B55α from WCEs of DLD1 cells incubated in normoxia (CTRL) and hypoxia for the indicated time or transfected with siB55α and incubated in hypoxia for 16 hr. OA and silencing of B55α siB55α were used as negative controls.
(G) WB of DLD1 cells transiently transfected with siCTR, siB55α, or REDD1 (siREDD1) alone or in combination and incubated either in normoxia or hypoxia for 16 hr.
(H) Measurement of the enzymatic activity of PP2A/B55α from WCE of DLD1 cells untreated (Mock) or incubated with 200 nM Torin2 and 1 μM Rapamycin for 16 hr.
(I) HEK393T cells were transfected with siCTR, siB55α, or siP70, alone or in combination. After 16 hr, cells were exposed to hypoxia for 4 hr, and WCEs were analyzed by WB.
All WBs were repeated three times on independent biological replicates. ∗p < 0.05 versus all other conditions under NRX in (C), versus 0 hr + 32P in (E), versus all conditions in (F), and versus Mock in (H); #p < 0.05 versus all other conditions under HPX in (C) and versus 0 hr and 4 hr + 32P in (E). The graphs show mean ± SEM. See also Figure S2.
Next we investigated the mechanism(s) underlying PP2A activation. Several reports have shown that mTOR blockade releases PP2A activity (Cianfanelli et al., 2015, Hartley and Cooper, 2002, Peterson et al., 1999), and it is widely accepted that the mTOR pathway is inhibited by hypoxia (Sofer et al., 2005). Accordingly, our experiments showed progressive P70S6K deactivation in hypoxia (Figure 3D). We therefore measured PP2A/B55α activity in the presence of the mTOR blockers Torin2 or Rapamycin. Consistent with our hypothesis, we could observe a great increase in PP2A activity with both inhibitors (Figure 3H). Conversely, reactivation of mTOR signaling in hypoxia by REDD1 silencing prevented the activation of PP2A (Figure S2C). To further ascertain the involvement of P70S6K in this loop, we analyzed the effect of P70S6K or B55α silencing alone or in combination. Because activation of P70S6K was nearly abolished after 24 hr of hypoxic conditions (Figure 3D), experiments were performed at 4 hr of hypoxia; silencing of P70S6K or B55α oppositely regulated HIF1α levels, as already previously observed. Interestingly, combined P70S6K and B55α knockdown caused a further increase in HIF1α, indicating that silencing of P70S6K prevails over the loss of B55α/PP2A activity (Figure 3I). In summary, inactivation of the mTOR/P70S6K pathway by REDD1/hypoxia leads to increased PP2A function, PHD2 dephosphorylation, and, thus, HIF1α stabilization.
HIF1α Stabilization by PP2A/B55α Promotes Colorectal Cancer Cell Survival via Autophagy in a PHD2-Dependent Manner
In hypoxia, HIF1α stabilization promotes cancer cell survival by initiating autophagy, a process that requires transcriptional induction of BNIP3 and BNIP3L, leading to tumor progression (Mazure and Pouysségur, 2009). We thus speculated that PHD2 regulation by B55α might somehow modify cell viability in normoxia and/or in hypoxia. To explore this possibility, DLD1 cells stably knocked down for PHD2 or B55α, alone or in combination, were exposed to 21% or 1% oxygen. When exposed to hypoxia, cells depleted for B55α showed a significant increase in cell death compared with control cells, as assessed by measuring terminal deoxynucleotidyl transferase dUTP nick end labeling (TUNEL) staining or cleaved Poly(ADP-ribose) polymerase (PARP). Simultaneous depletion of PHD2 was able to rescue the increased cell death, indicating that B55α requires PHD2 to elicit its effect (Figures 4A and 4B; Table S5). The proliferation rate and cell cycle were both comparable under all conditions tested, either normoxia or hypoxia (Figures S3A–S3C). We then wondered whether B55α could promote hypoxic cell survival via autophagy. Hypoxic exposure of DLD1 control cells for 16 hr induced the autophagy markers BNIP3 and BNIP3L; however, B55α silencing prevented this upregulation. Concomitant depletion of PHD2 and B55α restored BNIP3 and BNIP3L levels back to the control level, supporting the idea of a PHD2-dependent role of B55α in hypoxia-induced autophagy (Figures 4C and 4D). To assess the influence of B55α in this process, we measured the autophagic substrates p62 and LC3B, which are, respectively, degraded and induced during autophagy. Under hypoxia, p62 halved and LC3B doubled in control cells, but B55α knockdown partially prevented this process in a PHD2-dependent manner (Figure 4E; Figure S3D; Table S5). To assess the link between autophagy and survival in hypoxia, DLD1 cells were silenced for B55α, for the autophagy-mediator Atg5 (Pyo et al., 2005), or for both (Figures S3E and S3F). In hypoxia, each silencing alone caused increased cell death and a reduction in LC3-II levels compared with the control, but combined knockdown of B55α and Atg5 was not synergic, suggesting that B55α exerts its mechanism of action on the same pathway of Atg5 (Figure 4F; Figure S3G).
Figure 4.

Silencing of B55α Induces Increased Apoptosis in Hypoxia in a PHD2-Dependent Manner
(A and B) DLD1 cells stably silenced for control, B55α, PHD2, or both (shCTR, shB55α, shPHD2, and shPHD2∣shB55α, respectively) were cultured in normoxia or hypoxia for 96 hr (A) or 72 hr (B). Apoptosis was assessed by TUNEL staining (ApopTag) (A) or PARP cleavage (B).
(C and D) DLD1 cells stably silenced as in (A) were cultured in normoxia and in hypoxia for 16 hr. BNIP3 (C) and BNIP3L (D) mRNA levels were assessed by qRT-PCR.
(E) DLD1 cells stably silenced as in (A) were cultured in normoxia or hypoxia for 48 hr, and WCEs were analyzed by WB.
(F) DLD1 cells stably silenced for control, B55α, Atg5, or both (shCTR, shB55α, shAtg5, and shAtg5∣shB55α, respectively) were cultured in normoxia or hypoxia for 96 hr. Apoptosis was assessed by TUNEL staining.
(G–I) DLD1 cells stably silenced for control (shCTR) or B55α (shB55α) were transduced with lentiviral vectors to stably express an empty vector or a hydroxylation-insensitive HIF1α (HIF1α-PP) (G). The cells were then cultured in normoxia or hypoxia for 96 hr, and apoptosis was assessed by TUNEL staining (H). The same cells were exposed to hypoxia for 48 hr, and WCEs were analyzed by WB (I).
All WBs were repeated three times on independent biological replicates. ∗p < 0.05 versus all other conditions in (A), (C), (D), and (H) and versus shCTR in (F). The graphs show mean ± SEM. See also Figure S3.
To assess whether the effect of B55α knockdown on hypoxia-induced autophagy was mediated by a reduction in HIF1α levels, B55α-silenced and control cells were stably transfected with HIF1αP402A/P564G, a HIF1α double proline mutant insensitive to PHD-dependent degradation (Figure 4G; Table S5). As above, exposure to hypoxia promoted cell survival in control cells but much less in B55α-silenced cells; this phenotype was rescued upon concomitant overexpression of HIF1αP402A/P564G (Figure 4H). Consistently, HIF1αP402A/P564G overexpression also rescued the decrease in LC3-II levels observed upon B55α depletion (Figure 4I; Table S5). Thus, the pro-apoptotic effect seen after B55α silencing is dependent on a decrease in HIF1α levels because of sustained PHD2 activity under hypoxia.
PP2A/B55α Promotes Colorectal Cancer Growth in a PHD2-Dependent Manner
To elucidate the meaning of the B55α-PHD2 axis on tumorigenesis, we performed a focus-forming assay and a soft agar assay reflecting, respectively, the ability of cancer cells to bypass contact inhibition and to grow in the absence of adhesion. In both assays, uncontrolled growth led to increased oxygen consumption (Figure S4A; Leontieva et al., 2014). B55α silencing resulted in a significant reduction in colony size and number compared with the scrambled control and to PHD2 silencing (Figures 5A–5C; Figures S4B–S4D). This effect was rescued when B55α and PHD2 were concomitantly knocked down (Figures 5A–5C; Figures S4B–S4D), confirming that B55α works as a negative modulator of PHD2. Overexpression of undegradable HIF1αP402A/P564G abrogated the decrease in colony size and density caused by B55α knockdown but did not affect the growth of control cells (Figures 5D–5F). To link the reduction in focus formation to impairment of the autophagic pathway, we measured colony size and numbers following single or combined knockdown of B55α and Atg5. Each silencing was equally effective in inhibiting colony formation, but the combined knockdown of B55α and Atg5 was not synergic, suggesting that autophagy-induced cancer cell survival by B55α unleashes its tumorigenic potential (Figures 5G–5I).
Figure 5.

PP2A/B55α Promotes Colorectal Cancer Growth in a PHD2-Dependent Manner
(A–I) Focus formation assay with DLD1 cells stably silenced for control, B55α, PHD2, or both (shCTR, shB55α, shPHD2, and shPHD2∣shB55α, respectively) (A–C), with DLD1 shCTR and shB55α stably transduced with an empty vector or a hydroxylation-insensitive HIF1α (EV, shB55α, HIF1α, and shB55α∣HIF1α) (D–F), or with DLD1 cells stably silenced for control, B55α, Atg5 or both (shCTR, shB55α, and shAtg5, shAtg5∣shB55α, respectively) (G–I). Representative images from one of three independent experiments are shown (A, D, and G). The graphs show the size (B, E, and H) and total number (C, F, and I) of colonies per well.
(J and K) In vivo growth curves of xenograft tumors derived by subcutaneous injection in nude mice of HT29 (J) or DLD1 (K) cells stably silenced for control, B55α, PHD2, or both (shCTR, shB55α, shPHD2, and shPHD2∣shB55α, respectively).
(L and M) Tumor weights of HT29 (L) or DLD1 (M) cells 24 or 23 days after tumor cell injection, respectively.
(N) Morphometric quantification of DLD1 tumor sections stained for ApopTag showing apoptosis in the PIMO-positive area of the tumor.
(O) Morphometric quantification of DLD1 tumor sections stained for LC3 and PIMO, showing autophagy in hypoxic areas of the tumor. The data combine two or three independent experiments using seven or eight mice per condition in each experiment.
(P) WB analysis for HIF1α and PHD2 from control HT29 (guide RNA [gRNA]CTRL) and HT29 cells knocked out for PHD2 by means of a gRNAPHD2 and then reconstituted with a lentiviral vector encoding PHD2WT, PHD2S125A, and PHD2S125D or an EV.
(Q) In vivo growth curve of xenograft tumors derived by subcutaneous injection into nude mice of PHD2 knockout HT29 cells (gRNAPHD2) stably expressing PHD2WT, PHD2S125A, and PHD2S125D. The data combine two independent experiments using six mice per condition in each experiment. The WB was repeated twice.
∗p < 0.05 versus all other conditions; #p < 0.05 versus PHD2S125A. The graphs show mean ± SEM. See also Figure S4.
In vivo, silencing of B55α in DLD1 or HT29 cells subcutaneously injected into nude mice resulted in the formation of smaller tumors. This effect was PHD2-dependent because concomitant silencing of PHD2 prevented it, whereas PHD2 knockdown alone did not affect cancer growth (Figures 5J–5M). In line with our in vitro experiments, compared with the control, cell death and autophagy in the hypoxic (pimonidazole-positive) niches of the tumor were, respectively, increased and reduced upon B55α silencing but rescued by combined knockdown of B55α and PHD2; PHD2 silencing alone did not affect either parameters (Figures 5N and 5O). Conversely, cancer cell proliferation was not significantly affected (Figure S4E). In addition, stromal component such as leukocyte infiltration and blood vessel density were similar under all experimental conditions (Figures S4F and S4G). Overall, these findings indicate that PP2A/B55α plays a pro-tumoral role by inactivating PHD2.
By using CRIPSR/Cas9, we generated PHD2 KO HT29 cells (Figure S4H) that were then reconstituted with either PHD2WT, PHD2S125A, or PHD2S125D. These cell lines showed different levels of HIF1α according to our previous in vitro data, with PHD2S125A and PHD2S125D being, respectively, less and more active than the wild-type isoform (Figure 5P). In vivo, HT29 cells expressing PHD2S125D showed a significant reduction in tumor growth compared with cells expressing PHD2S125A; PHD2WT-expressing cells displayed, instead, an intermediate phenotype (Figure 5Q). In sum, PHD2S125D mutant mimics B55α silencing, both of which have an antitumor effect.
Finally, we collected tumor tissues and normal counterparts from CRC patients, and B55α, HIF1α, and REDD1 protein levels were analyzed by western blot. Compared with normal colon, all tumor samples displayed increased protein levels of HIF1α, B55α, and REDD1 (Figures 6A–6D). Importantly, targeted mass spectrometry revealed that the fraction of phospho-S125 in cancerous colon tissue was about 60% decreased compared with healthy colon (Figure 6E; Figures S5A and S5B). Consistent with the induction of PHD2 by HIF1 itself (Fong and Takeda, 2008), the total amount of PHD2 was slightly higher in the tumor compared with normal tissue, although this difference did not reach significance (Figure 6F). Overall, these observations highlight the relevance of B55α-PP2A signaling in the regulation of PHD2 phosphorylation and HIF1α accumulation in CRC.
Figure 6.

Evidence of the B55α-PHD2-HIF1α Axis in Colorectal Cancer Patients
(A–D) WB analysis (A) and quantification of B55α (B), HIF1α (C) and REDD1 (D) protein levels in normal or tumor colorectal cancer tissues from ten colorectal cancer patients. Vinculin was used as a loading control.
(E and F) LC/MS-based quantification of phosphorylated S125 over total PHD2 ratios in healthy versus colorectal cancer tissues using targeted PRM and SIL reference peptides. The fraction of S125 phosphorylation on total PHD2 in healthy tissue is normalized to 1 (E). Total PHD2 levels are shown in (F). ∗∗p < 0.01 versus the other condition. The graphs show mean ± SEM. See also Figure S5.
(G) Schematic of the pathways controlling the phosphorylation status of PHD2 on S125 and the levels of HIF1α. The mTOR downstream kinase P70S6K is responsible for the direct phosphorylation of PHD2. Instead, PP2A/B55α is responsible for the direct dephosphorylation, leading to a partial inactivation of PHD2 even when oxygen is not limiting. In hypoxia, the mTOR pathway is inhibited, and, as a consequence, PP2A/B55α activity is liberated. It follows that P70S6K is blocked by both PP2A and by the inhibition of mTOR. The enzymatic release of PP2A/B55α and the inhibition of P70S6K lead to complete dephosphorylation of PHD2 on S125, resulting in the overall reduction of its activity and accumulation of HIF1α. After stabilization, HIF1α promotes hypoxic cell survival via autophagy and fosters tumor growth.
According to our model, it follows that, subsequent to an mTOR block in hypoxia, not only the phosphorylation of PHD2 by P70S6K is inhibited but PP2A/B55α activity is also liberated (Hartley and Cooper, 2002, Peterson et al., 1999, Roberts et al., 2014). Interestingly, B55α silencing prevents P70S6K inactivation, indicating that the phosphorylation and dephosphorylation machineries of PHD2 are mutually exclusive. As a consequence, increased dephosphorylation on S125 results in impaired enzymatic activity of PHD2. Consequently, HIF1α accumulates and favors cancer cell survival and tumor growth (Figure 6G).
Discussion
PHD2 is the main regulator of HIF1α, one of the key responders to hypoxia, and broadly expressed in tumors (Keith et al., 2011). Although it is generally accepted that oxygen is the most important determinant of PHD2 activity, here we investigate the possible involvement of oxygen-independent, post-translational modification of PHD2. We find that the phosphorylation status of PHD2 is important for efficient control of HIF1 levels. The kinase P70S6K and the phosphatase PP2A/B55α directly phosphorylate and dephosphorylate PHD2 on S125. When S125 is mutated to alanine, PHD2 shows an impaired ability to degrade HIF1α or an ODDD luciferase fusion protein, which is associated with a reduction of OH-HIF1α, indicating a crucial role of S125 phosphorylation in modulating PHD2 activity.
The mechanism by which this phosphorylation modifies PHD2 activity remains to be elucidated. Indeed, S125 is a residue located at the N terminus of the protein and does not involve its catalytic domain. Moreover, although others have shown that phosphorylation on PHD1 S130 by CDK1 affects the binding affinity of PHD1 for HIF1α (Ortmann et al., 2016), the phosphorylation status of PHD2 on S125 does not affect the interaction between PHD2 and HIF1α (data not shown). Therefore, this phosphorylation site might be relevant for the affinity of PHD2 for oxygen and/or cosubstrates or for other partners, such as LIMD1 or von Hippel-Lindau (VHL) (Foxler et al., 2012).
In hypoxia, mTOR inhibition prohibits P70S6K activity, which, in turn, unleashes PP2A/B55α signaling. The downregulation of P70S6K, a kinase targeting PHD2, and the mutual upregulation of PP2A/B55α phosphatase activity lead to dephosphorylation and partial inactivation of PHD2, ultimately promoting HIF1α stabilization (Figure 6G). These data therefore indicate a hypoxic regulatory flow that starts with downregulation of P70S6K activity and moves to the activation of PP2A/B55α. The combined action of these processes potentiates/accelerates the inactivation of PHD2 during hypoxia, leading to HIF1α stabilization. Furthermore, HIF1α, by promoting REDD1 transcription (Brugarolas et al., 2004), contributes to mTOR inactivation, thus enforcing a positive feedback loop that promotes survival of hypoxic tumor cells.
With these data, we add a further piece to the crosstalk between mTOR and HIF1α. It has been reported that the mTOR pathway controls HIF1α protein synthesis in normoxia (Brugarolas et al., 2004, Hudson et al., 2002). Here we explain how HIF1α can be stabilized under low oxygen availability or nutrient starvation (Nishimoto et al., 2014), two conditions that turn off the mTOR pathway. Accordingly, REDD1 blockade and subsequent mTOR activation have been linked to an antitumoral response, and REDD1 overexpression has been described in CRC as well as in several other tumor types (Chang et al., 2009, Jia et al., 2014, Kucejova et al., 2011) (http://www.cbioportal.org/). It is reasonable that these tumors are highly hypoxic, and REDD1 overexpression upregulates hypoxia-induced genes (Brugarolas et al., 2004). In the opposite scenario, in normoxic cells, active mTOR/P70S6K increases HIF1α translation, but PHD2 activity is promoted as well so that, ultimately, excessive HIF activation is prevented.
According to our model, HIF1α stabilization by PP2A will initiate an adaptive response, allowing cells to survive the hostile conditions that characterize the tumor microenvironment (Keith et al., 2011). Although autophagy in cancer has been associated with opposing functions (Mathew et al., 2007, Shchors et al., 2015), autophagy in CRC cells has been shown to be pro-survival following amino acid starvation (Sato et al., 2007). Here we demonstrate that hypoxia is able to trigger autophagic survival through stabilization of HIF1α levels, which requires PHD2 dephosphorylation by PP2A/B55α. In this way, the protective role of HIF1α is cell-autonomous and not due to the indirect effect of this pathway on the tumor stroma, such as via vascular endothelial growth factor (VEGF) production and blood vessel formation (Tsuzuki et al., 2000). However, prolonged activation of the autophagic process would lead to excessive self-eating with consequent induction of cell death (Liu and Levine, 2015). Transcriptional induction of PHD2 upon chronic hypoxia (Epstein et al., 2001) will overrule the inhibition of PHD2 by PP2A, bringing HIF1α to lower levels and turning off autophagy. In this scenario, a post-translational modification represents the fastest way for the cell to survive.
It has already been shown that B55α is induced in cancer cells at both the transcript and protein levels when the key metabolite glutamine becomes limited or upon DNA damage (Kalev et al., 2012). The ability of B55α silencing to abate the neoplastic features of HT29 and DLD1 cells in vitro and in vivo indicates that B55α can have a pro-survival, tumor-promoting role in colorectal cancer, supported by our study in a small cohort of CRC patients and by recent data showing that, of all the B subunits, only B55α is specifically upregulated in CRC human samples (Gilan et al., 2015). Another study has reported a significant association between expression of HIF1α and CRC staging, involvement of lymph nodes, and liver metastases, resulting in an inverse correlation between HIF1α levels and overall survival (Cao et al., 2009). Because we have shown that HIF1α levels positively correlate with B55α because of its negative modulation of PHD2, we suggest that targeting B55α might serve as a promising therapeutic approach for CRC, especially to tackle tumors overexpressing HIF1α. So far, the pan-PP2A inhibitor okadaic acid has been shown to promote tumor growth and is associated with adverse reactions (Bialojan and Takai, 1988). This is due to the pleiotropic and multifunctional role of 100 combinations of the PP2A holoenzyme. Based on our observation, we speculate that a molecule capable of blocking B55α or, even more specifically, the interaction between B55α and PHD2, might display higher selectivity with an univocal anti-tumor effect and, likely, lower toxicity.
At this stage, our study provides insights into how, in the context of CRC, a specific post-translational modification of PHD2 can promptly activate a survival response by controlling HIF1α in an oxygen-independent manner, thus extending the role of PHD2 beyond its initially recognized function as an oxygen sensor.
Experimental Procedures
More detailed methods can be found in the Supplemental Experimental Procedures.
Cell Culture and Transfections
HEK293T, DLD1, and HT29 cell lines were routinely cultured in DMEM (Gibco) supplemented with 10% heat-inactivated fetal bovine serum (FBS, Gibco), 2 mM glutamine (Life Technologies), and 100 units/mL penicillin and 100 μg/mL streptomycin (Life Technologies). Cells were maintained in a humidified incubator at 37°C and 5% CO2. For hypoxia experiments, cells were incubated in a hypoxic glovebox (37°C, 5% CO2, 1% O2) for the indicated times. Transfections were performed with Lipofectamine 2000 transfection reagent or Lipofectamine RNAiMax (Life Technologies) according to the manufacturer’s instructions.
Phosphatase Assay
Phosphatase assays were performed by using DuoSet IC-human/mouse/rat active PP2A (R&D Systems) according to the manufacturer’s instructions. 100 μg of whole-cell extract from DLD1 cells was added to PP2A antibody-coated wells. Recombinant PHD2 peptide (amino acids [aa] 113–130) synthetized by Pepscan and the positive control (serine/threonine phosphatase substrate I, part 842098) were used as phosphatase substrates.
Kinase Assay
The purified wild-type or mutant PHD2-FLAGM2 proteins (100 ng) were incubated in kinase buffer (25 mM 3-Morpholinopropane-1-sulfonic acid (MOPS) [pH 7.2], 25 mM MgCl2, 5 mM EGTA, 2 mM EDTA, 250 μM DTT, and 6 mM β-glycerophosphate) in the presence of active P70S6K (4 ng/μL, SignalChem), 250 μM ATP, and 2 μCi γ-32P-ATP (PerkinElmer). After 20-min incubation at 30°C, samples were denaturated by incubating with 4× SDS sample buffer at 95°C for 10 min and separated by 10% SDS-PAGE. Thereafter, the gel was blotted onto a nitrocellulose membrane, and the membrane was exposed to a Kodak phosphor imaging screen overnight. Autoradiography was detected with MolecularImager FX using Quantity One software (all from Bio-Rad). Afterward, the total proteins were detected by using an antibody against PHD2.
Focus Formation and Soft Agar Assay
For the focus formation assay, DLD1 cells were plated at 2 × 10³ cells/well on a 6-well cell culture plate and cultured for 10 days. The cultured cells were stained and fixed with 0.5% crystal violet in a fixating solution containing 10% acetic acid and 10% methanol in water. For the soft agar assay, 103 DLD1 cells were suspended in 2 mL of 0.5% (w/v) agar containing DMEM/10% fetal bovine serum on a 1% (w/v) agar solution in 24-well plates. Colonies appeared microscopically after 10 days and were visible to the naked eye after 15–20 days of incubation.
Xenograft Tumors
DLD1 and HT29 cells were harvested, and single-cell suspensions of 3 – 106 cells in 200 μL of PBS were injected subcutaneously into the right flanks of nude mice. Tumor volumes were measured three times a week with a caliper and calculated using the following formula: V = π × [d2 × D] / 6, where d is the minor tumor axis and D is the major tumor axis. All the experimental procedures were approved by the Institutional Animal Care and Research Advisory Committee of the KU Leuven.
CRC Patient Selection
For this study, ten patients diagnosed with CRC who underwent surgical resection were selected. This study was approved by the institutional ethical commission at the University Hospital of Leuven, Belgium.
Statistics
All statistical analyses were performed using GraphPad Prism software. Statistical significance was calculated by two-tailed unpaired t test on two experimental conditions or two-way ANOVA when more than two groups were compared, with p < 0.05 considered statistically significant. Western blots and immunoprecipitations are representative of three independent experiments. Focus formation assays, qRT-PCR, luciferase assays, and phosphatase assays are representative of three independent biological experiments where each experiment was done by three technical replicates. All graphs show mean values ± SEM.
Author Contributions
G.D.C. performed experimental design, all experiments, acquisition of data and analysis, and interpretation of all data and wrote the manuscript. S.T.C. performed the western blot experiments. S.L., R.P.Z., and A.S. performed the mass spectrometry (MS) analysis on cells and tumor samples. S.D. performed the initial interaction study by MS. M.D.M. designed the CRISPR/Cas9 experiment. M.E. performed the histological stainings and analysis. D.M. and T.K. performed the in vitro kinase assays. H.P. provided clinical samples. K.G. performed the MS on PHD2 to identify the phosphorylation sites. F.M. conducted scientific direction. M.M. performed experimental design, analyzed of data, conducted scientific direction, and wrote the manuscript.
Acknowledgments
The authors thank B. Meeusen, G. Manzella, and J. Serneels for technical assistance and A. Sablina and T. Acker for sharing plasmids and reagents. This work was supported by grants from ERANET (OxyUC, G0D8115N), FWO (1505611N00), Stichting Tegen Kanker (2010-169), Bundesministerium für Bildung und Forschung, and the Ministerium für Innovation, Wissenschaft und Forschung des Landes Nordrhein-Westfalen. G.D.C. is supported by a Pegasus FWO-Marie Curie fellowship (1211413N), M.E. by DFG (EH 472/1-1), and S.D. by VLK (EVDS and 419.052.173). M.M. received an ERC starting grant (OxyMO, 308459).
Published: February 14, 2017
Footnotes
Supplemental Information includes Supplemental Experimental Procedures, five figures, and five tables and can be found with this article online at http://dx.doi.org/10.1016/j.celrep.2017.01.051.
Supplemental Information
References
- Appelhoff R.J., Tian Y.M., Raval R.R., Turley H., Harris A.L., Pugh C.W., Ratcliffe P.J., Gleadle J.M. Differential function of the prolyl hydroxylases PHD1, PHD2, and PHD3 in the regulation of hypoxia-inducible factor. J. Biol. Chem. 2004;279:38458–38465. doi: 10.1074/jbc.M406026200. [DOI] [PubMed] [Google Scholar]
- Berra E., Benizri E., Ginouvès A., Volmat V., Roux D., Pouysségur J. HIF prolyl-hydroxylase 2 is the key oxygen sensor setting low steady-state levels of HIF-1alpha in normoxia. EMBO J. 2003;22:4082–4090. doi: 10.1093/emboj/cdg392. [DOI] [PMC free article] [PubMed] [Google Scholar]
- Bialojan C., Takai A. Inhibitory effect of a marine-sponge toxin, okadaic acid, on protein phosphatases. Specificity and kinetics. Biochem. J. 1988;256:283–290. doi: 10.1042/bj2560283. [DOI] [PMC free article] [PubMed] [Google Scholar]
- Brugarolas J., Lei K., Hurley R.L., Manning B.D., Reiling J.H., Hafen E., Witters L.A., Ellisen L.W., Kaelin W.G., Jr. Regulation of mTOR function in response to hypoxia by REDD1 and the TSC1/TSC2 tumor suppressor complex. Genes Dev. 2004;18:2893–2904. doi: 10.1101/gad.1256804. [DOI] [PMC free article] [PubMed] [Google Scholar]
- Cao D., Hou M., Guan Y.S., Jiang M., Yang Y., Gou H.F. Expression of HIF-1alpha and VEGF in colorectal cancer: association with clinical outcomes and prognostic implications. BMC Cancer. 2009;9:432. doi: 10.1186/1471-2407-9-432. [DOI] [PMC free article] [PubMed] [Google Scholar]
- Chan D.A., Sutphin P.D., Yen S.E., Giaccia A.J. Coordinate regulation of the oxygen-dependent degradation domains of hypoxia-inducible factor 1 alpha. Mol. Cell. Biol. 2005;25:6415–6426. doi: 10.1128/MCB.25.15.6415-6426.2005. [DOI] [PMC free article] [PubMed] [Google Scholar]
- Chang B., Liu G., Yang G., Mercado-Uribe I., Huang M., Liu J. REDD1 is required for RAS-mediated transformation of human ovarian epithelial cells. Cell Cycle. 2009;8:780–786. doi: 10.4161/cc.8.5.7887. [DOI] [PubMed] [Google Scholar]
- Cianfanelli V., Fuoco C., Lorente M., Salazar M., Quondamatteo F., Gherardini P.F., De Zio D., Nazio F., Antonioli M., D’Orazio M. AMBRA1 links autophagy to cell proliferation and tumorigenesis by promoting c-Myc dephosphorylation and degradation. Nat. Cell Biol. 2015;17:20–30. doi: 10.1038/ncb3072. [DOI] [PMC free article] [PubMed] [Google Scholar]
- De Bock K., Mazzone M., Carmeliet P. Antiangiogenic therapy, hypoxia, and metastasis: risky liaisons, or not? Nat. Rev. Clin. Oncol. 2011;8:393–404. doi: 10.1038/nrclinonc.2011.83. [DOI] [PubMed] [Google Scholar]
- Epstein A.C., Gleadle J.M., McNeill L.A., Hewitson K.S., O’Rourke J., Mole D.R., Mukherji M., Metzen E., Wilson M.I., Dhanda A. C. elegans EGL-9 and mammalian homologs define a family of dioxygenases that regulate HIF by prolyl hydroxylation. Cell. 2001;107:43–54. doi: 10.1016/s0092-8674(01)00507-4. [DOI] [PubMed] [Google Scholar]
- Fong G.H., Takeda K. Role and regulation of prolyl hydroxylase domain proteins. Cell Death Differ. 2008;15:635–641. doi: 10.1038/cdd.2008.10. [DOI] [PubMed] [Google Scholar]
- Foxler D.E., Bridge K.S., James V., Webb T.M., Mee M., Wong S.C., Feng Y., Constantin-Teodosiu D., Petursdottir T.E., Bjornsson J. The LIMD1 protein bridges an association between the prolyl hydroxylases and VHL to repress HIF-1 activity. Nat. Cell Biol. 2012;14:201–208. doi: 10.1038/ncb2424. [DOI] [PubMed] [Google Scholar]
- Gilan O., Diesch J., Amalia M., Jastrzebski K., Chueh A.C., Verrills N.M., Pearson R.B., Mariadason J.M., Tulchinsky E., Hannan R.D., Dhillon A.S. PR55α-containing protein phosphatase 2A complexes promote cancer cell migration and invasion through regulation of AP-1 transcriptional activity. Oncogene. 2015;34:1340. doi: 10.1038/onc.2014.460. [DOI] [PubMed] [Google Scholar]
- Ginouvès A., Ilc K., Macías N., Pouysségur J., Berra E. PHDs overactivation during chronic hypoxia “desensitizes” HIFalpha and protects cells from necrosis. Proc. Natl. Acad. Sci. USA. 2008;105:4745–4750. doi: 10.1073/pnas.0705680105. [DOI] [PMC free article] [PubMed] [Google Scholar]
- Hartley D., Cooper G.M. Role of mTOR in the degradation of IRS-1: regulation of PP2A activity. J. Cell. Biochem. 2002;85:304–314. doi: 10.1002/jcb.10135. [DOI] [PubMed] [Google Scholar]
- Hudson C.C., Liu M., Chiang G.G., Otterness D.M., Loomis D.C., Kaper F., Giaccia A.J., Abraham R.T. Regulation of hypoxia-inducible factor 1alpha expression and function by the mammalian target of rapamycin. Mol. Cell. Biol. 2002;22:7004–7014. doi: 10.1128/MCB.22.20.7004-7014.2002. [DOI] [PMC free article] [PubMed] [Google Scholar]
- Jia W., Chang B., Sun L., Zhu H., Pang L., Tao L., Zou H., Du J., Dong Y., Qi Y. REDD1 and p-AKT over-expression may predict poor prognosis in ovarian cancer. Int. J. Clin. Exp. Pathol. 2014;7:5940–5949. [PMC free article] [PubMed] [Google Scholar]
- Jokilehto T., Jaakkola P.M. The role of HIF prolyl hydroxylases in tumour growth. J. Cell. Mol. Med. 2010;14:758–770. doi: 10.1111/j.1582-4934.2010.01030.x. [DOI] [PMC free article] [PubMed] [Google Scholar]
- Kalev P., Simicek M., Vazquez I., Munck S., Chen L., Soin T., Danda N., Chen W., Sablina A. Loss of PPP2R2A inhibits homologous recombination DNA repair and predicts tumor sensitivity to PARP inhibition. Cancer Res. 2012;72:6414–6424. doi: 10.1158/0008-5472.CAN-12-1667. [DOI] [PubMed] [Google Scholar]
- Keith B., Johnson R.S., Simon M.C. HIF1α and HIF2α: sibling rivalry in hypoxic tumour growth and progression. Nat. Rev. Cancer. 2011;12:9–22. doi: 10.1038/nrc3183. [DOI] [PMC free article] [PubMed] [Google Scholar]
- Kucejova B., Peña-Llopis S., Yamasaki T., Sivanand S., Tran T.A., Alexander S., Wolff N.C., Lotan Y., Xie X.J., Kabbani W. Interplay between pVHL and mTORC1 pathways in clear-cell renal cell carcinoma. Mol. Cancer Res. 2011;9:1255–1265. doi: 10.1158/1541-7786.MCR-11-0302. [DOI] [PMC free article] [PubMed] [Google Scholar]
- Leontieva O.V., Demidenko Z.N., Blagosklonny M.V. Contact inhibition and high cell density deactivate the mammalian target of rapamycin pathway, thus suppressing the senescence program. Proc. Natl. Acad. Sci. USA. 2014;111:8832–8837. doi: 10.1073/pnas.1405723111. [DOI] [PMC free article] [PubMed] [Google Scholar]
- Liu Y., Levine B. Autosis and autophagic cell death: the dark side of autophagy. Cell Death Differ. 2015;22:367–376. doi: 10.1038/cdd.2014.143. [DOI] [PMC free article] [PubMed] [Google Scholar]
- Mathew R., Karantza-Wadsworth V., White E. Role of autophagy in cancer. Nat. Rev. Cancer. 2007;7:961–967. doi: 10.1038/nrc2254. [DOI] [PMC free article] [PubMed] [Google Scholar]
- Mazure N.M., Pouysségur J. Atypical BH3-domains of BNIP3 and BNIP3L lead to autophagy in hypoxia. Autophagy. 2009;5:868–869. doi: 10.4161/auto.9042. [DOI] [PubMed] [Google Scholar]
- Nishimoto A., Kugimiya N., Hosoyama T., Enoki T., Li T.S., Hamano K. HIF-1α activation under glucose deprivation plays a central role in the acquisition of anti-apoptosis in human colon cancer cells. Int. J. Oncol. 2014;44:2077–2084. doi: 10.3892/ijo.2014.2367. [DOI] [PubMed] [Google Scholar]
- Núñez-O’Mara A., Gerpe-Pita A., Pozo S., Carlevaris O., Urzelai B., Lopitz-Otsoa F., Rodríguez M.S., Berra E. PHD3-SUMO conjugation represses HIF1 transcriptional activity independently of PHD3 catalytic activity. J. Cell Sci. 2015;128:40–49. doi: 10.1242/jcs.151514. [DOI] [PubMed] [Google Scholar]
- Ortmann B., Bensaddek D., Carvalhal S., Moser S.C., Mudie S., Griffis E.R., Swedlow J.R., Lamond A.I., Rocha S. CDK-dependent phosphorylation of PHD1 on serine 130 alters its substrate preference in cells. J. Cell Sci. 2016;129:191–205. doi: 10.1242/jcs.179911. [DOI] [PMC free article] [PubMed] [Google Scholar]
- Pan Y., Mansfield K.D., Bertozzi C.C., Rudenko V., Chan D.A., Giaccia A.J., Simon M.C. Multiple factors affecting cellular redox status and energy metabolism modulate hypoxia-inducible factor prolyl hydroxylase activity in vivo and in vitro. Mol. Cell. Biol. 2007;27:912–925. doi: 10.1128/MCB.01223-06. [DOI] [PMC free article] [PubMed] [Google Scholar]
- Peterson R.T., Desai B.N., Hardwick J.S., Schreiber S.L. Protein phosphatase 2A interacts with the 70-kDa S6 kinase and is activated by inhibition of FKBP12-rapamycinassociated protein. Proc. Natl. Acad. Sci. USA. 1999;96:4438–4442. doi: 10.1073/pnas.96.8.4438. [DOI] [PMC free article] [PubMed] [Google Scholar]
- Pyo J.O., Jang M.H., Kwon Y.K., Lee H.J., Jun J.I., Woo H.N., Cho D.H., Choi B., Lee H., Kim J.H. Essential roles of Atg5 and FADD in autophagic cell death: dissection of autophagic cell death into vacuole formation and cell death. J. Biol. Chem. 2005;280:20722–20729. doi: 10.1074/jbc.M413934200. [DOI] [PubMed] [Google Scholar]
- Roberts D.J., Tan-Sah V.P., Ding E.Y., Smith J.M., Miyamoto S. Hexokinase-II positively regulates glucose starvation-induced autophagy through TORC1 inhibition. Mol. Cell. 2014;53:521–533. doi: 10.1016/j.molcel.2013.12.019. [DOI] [PMC free article] [PubMed] [Google Scholar]
- Sato K., Tsuchihara K., Fujii S., Sugiyama M., Goya T., Atomi Y., Ueno T., Ochiai A., Esumi H. Autophagy is activated in colorectal cancer cells and contributes to the tolerance to nutrient deprivation. Cancer Res. 2007;67:9677–9684. doi: 10.1158/0008-5472.CAN-07-1462. [DOI] [PubMed] [Google Scholar]
- Seshacharyulu P., Pandey P., Datta K., Batra S.K. Phosphatase: PP2A structural importance, regulation and its aberrant expression in cancer. Cancer Lett. 2013;335:9–18. doi: 10.1016/j.canlet.2013.02.036. [DOI] [PMC free article] [PubMed] [Google Scholar]
- Shchors K., Massaras A., Hanahan D. Dual Targeting of the Autophagic Regulatory Circuitry in Gliomas with Repurposed Drugs Elicits Cell-Lethal Autophagy and Therapeutic Benefit. Cancer Cell. 2015;28:456–471. doi: 10.1016/j.ccell.2015.08.012. [DOI] [PubMed] [Google Scholar]
- Sofer A., Lei K., Johannessen C.M., Ellisen L.W. Regulation of mTOR and cell growth in response to energy stress by REDD1. Mol. Cell. Biol. 2005;25:5834–5845. doi: 10.1128/MCB.25.14.5834-5845.2005. [DOI] [PMC free article] [PubMed] [Google Scholar]
- Stolze I.P., Tian Y.M., Appelhoff R.J., Turley H., Wykoff C.C., Gleadle J.M., Ratcliffe P.J. Genetic analysis of the role of the asparaginyl hydroxylase factor inhibiting hypoxia-inducible factor (FIH) in regulating hypoxia-inducible factor (HIF) transcriptional target genes [corrected] J. Biol. Chem. 2004;279:42719–42725. doi: 10.1074/jbc.M406713200. [DOI] [PubMed] [Google Scholar]
- Tsuzuki Y., Fukumura D., Oosthuyse B., Koike C., Carmeliet P., Jain R.K. Vascular endothelial growth factor (VEGF) modulation by targeting hypoxia-inducible factor-1alpha--> hypoxia response element--> VEGF cascade differentially regulates vascular response and growth rate in tumors. Cancer Res. 2000;60:6248–6252. [PubMed] [Google Scholar]
Associated Data
This section collects any data citations, data availability statements, or supplementary materials included in this article.