

Summary
Measurements of flow velocities at the level of individual arterial vessels and sinusoidal capillaries are crucial for understanding the dynamics of hematopoietic stem and progenitor cell homing in the bone marrow vasculature. We have developed two complementary intravital two-photon imaging approaches to determine blood flow dynamics and velocities in multiple vessel segments by capturing the motion of red blood cells. High-resolution spatiotemporal measurements through a cranial window to determine short-time dynamics of flowing blood cells and repetitive centerline scans were used to obtain a detailed flow-profile map with hemodynamic parameters. In addition, we observed the homing of individual hematopoietic stem and progenitor cells and obtained detailed information on their homing behavior. With our imaging setup, we determined flow patterns at cellular resolution, blood flow velocities and wall shear stress in small arterial vessels and highly branched sinusoidal capillaries, and the cellular dynamics of hematopoietic stem and progenitor cell homing.
Keywords: intravital imaging, deep tissue imaging, bone marrow, microvasculature, blood flow velocities, wall shear stress, hematopoietic parameters, hematopoietic stem cell, stem cell homing
Graphical Abstract
Highlights
-
•
Detailed 3D reconstruction of the calvarial bone marrow microvasculature
-
•
Blood flow dynamics at cellular resolution in bone microvessels
-
•
Detailed flow map with hemodynamic parameters in arteries and highly branched sinusoids
-
•
Cellular dynamics of HSPC homing to bone marrow sinusoids
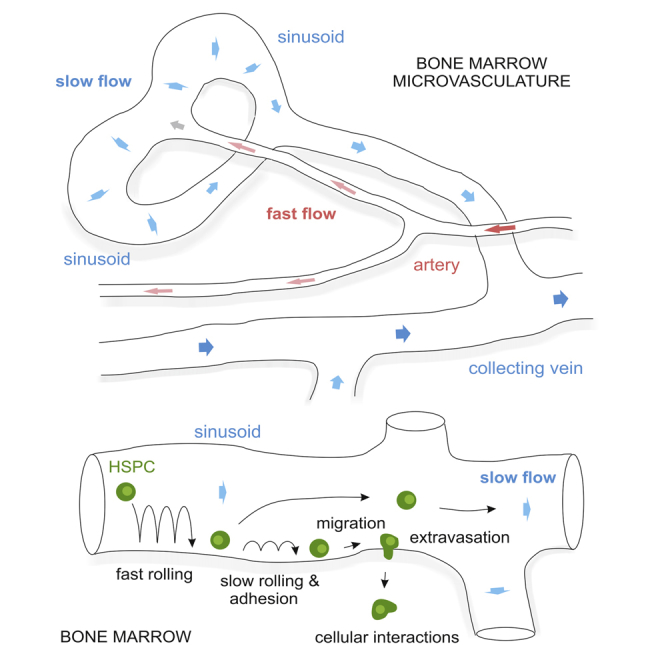
Bixel et al. use intravital two-photon imaging to determine blood flow patterns at cellular resolution and hemodynamic parameters in individual arterial vessels and sinusoidal capillaries in the bone marrow microvasculature. They report detailed information on the dynamics of hematopoietic stem and progenitor cell homing to highly branched bone marrow sinusoids.
Introduction
Bone marrow (BM) is the principle site of postnatal hematopoiesis and requires a specialized microenvironment, the hematopoietic niche, which controls the maintenance and self-renewal of hematopoietic stem cells (Boulais and Frenette, 2015, Ding et al., 2012, Kopp et al., 2009, Morrison and Scadden, 2014, Zhang et al., 2003). Deeper insight into the functional structures of the BM strongly depends on a better understanding of the blood vessel microarchitecture and the blood flow dynamics in the various vessel types within the BM cavity.
The BM microvasculature forms a complex and irregular network of interconnecting sinusoidal microvessels, which are located within the BM cavities of both long and flat bones (Kusumbe et al., 2014, Lassailly et al., 2013, Li et al., 2009). The thin-walled sinusoidal vessels are highly specialized capillaries with a wide lumen, a discontinuous basement membrane and fenestrations that facilitate trafficking of cells and soluble factors between the blood and the BM compartment (Abboud, 1995, Aoki and Tavassoli, 1981, Rafii et al., 1997). Arterioles that branch from larger arteries control the blood flow into the BM microvascular compartment. In long bone, these small-diameter vessels progressively transform into wider vessels and connect to a highly branched and irregular network of sinusoidal capillaries (Kunisaki et al., 2013, Kusumbe et al., 2014, Nombela-Arrieta et al., 2013).
The functional organization and the blood flow dynamics within the different vessel types in the BM have remained poorly understood due to technical challenges associated with in vivo high-resolution imaging in the intact bone (Köhler et al., 2009, Xie et al., 2009). As an optically dense, highly scattering tissue, intact bone is difficult to access with intravital imaging techniques. In vivo imaging of the tibia requires surgical procedures including removal of muscle tissue and thinning of the outer bone layer (Köhler et al., 2009), resulting in acute and chronic inflammatory reactions of the tissue. Intravital microscopy of the calvarium, the frontoparietal bone of the skull, is currently the most established noninvasive method to study dynamic cellular behavior and blood flow in the BM compartment (Köhler et al., 2009, Lo Celso et al., 2009a, Lo Celso et al., 2011). Direct imaging and real-time recording is feasible through the thin layer of cortical bone without surgical manipulation of the underlying tissue (Mazo et al., 1998). Although the BM microvasculature of the calvarium reveals structural differences compared to long bone, it was recently shown to be fully functional with respect to hematopoietic stem cell homeostasis, homing, and reconstitution (Lassailly et al., 2013).
Previous studies have suggested that local oxygen tension determines the location of hematopoietic stem cells (HSCs) in the BM compartment (Ellis et al., 2011, Parmar et al., 2007, Simsek et al., 2010, Takubo et al., 2010). Hypoxia seems to play a fundamental role in regulating stem cell function by maintaining stem cells in a quiescent state (Eliasson and Jönsson, 2010, Nombela-Arrieta and Silberstein, 2014). The microvascular density in the BM, however, was found to be a poor indicator for regions of low oxygen (Nombela-Arrieta et al., 2013, Spencer et al., 2014).
Here, we have studied the influence of the irregular and complex network of arterial vessels and interconnecting sinusoidal capillaries on blood flow in the calvarial BM microvasculature by direct in vivo measurements of red blood cell (RBC) flow dynamics and velocities at the level of individual vessel segments. Furthermore, we have used single-cell resolution intravital microscopy to analyze the impact of blood flow on hematopoietic stem and progenitor cell (HSPC) homing behavior and have monitored the cellular dynamics of the initial phase of this multistep process in the BM microvasculature.
Results
Two-Photon Imaging of the Bone Marrow Microvasculature
For in vivo two-photon microscopy, we constructed a custom-made mouse imaging setup with a head immobilization device to eliminate movement artifacts during imaging (Figure 1A). A titanium ring designed to fit the hole of the skull holder was glued on top of a chronic cranial window (Figure 1B). We imaged the calvarial BM microvasculature of GFP+ transgenic mice (Flk1-GFP) (Xu et al., 2010) showing GFP+ (green) endothelium in arterial and sinusoidal BM vessels. Calcified bone was visualized by second-harmonic generation (SHG, blue) imaging of collagen fibers. BM cavities appear dark except for GFP+ microvasculature, as cells of the hematopoietic system have not been labeled. Cross-sections through frontal bones identified BM cavities of different size as well as bone vessels residing in tube-like cavities in the compact and cancellous bone (Figure 1C). When imaged through a chronic cranial window, GFP+ vessels of small caliber were found in upper layers of the outer compact bone (Figures 1D and 1E). A dense network of collagen fibers was seen in this region, visible as strong SHG signals, which excluded small speckles, presumably the cell bodies of osteocytes and the space around blood vessels. At deeper layers (90–180 μm), irregularly shaped BM cavities opened up showing interconnected sinusoidal capillaries of variable diameter (10–50 μm) (Figures 1F–1H and 1J; Movie S1). The inner layer of the compact bone was detected at a depth of 180–250 μm (Figure 1I).
Figure 1.

Experimental Setup and Procedure for Intravital Imaging of the Skull BM Microvasculature
(A) Custom-made mouse imaging setup with a head immobilization device using a titanium ring glued on the mouse skull and a skull holder fixed on a custom-made plate. The skull holder eliminates movement artifacts during imaging.
(B) The skin (s) is removed over the circular area of interest. Both a 6-mm round glass coverslip (cs) and a titanium fixation ring (fr) are mounted on the skull (sk) with dental acrylic (da). A circular area inside the ring (typically ∼3–4 mm in diameter) can be visualized using two-photon laser imaging reaching an imaging depth of ∼250–300 μm, bone marrow (bm), calcified bone (b).
(C) Cross-section showing GFP+ (green) endothelium and SHG+ (blue) bone tissue in calvarium (frontoparietal bone) of Flk1-GFP transgenic mice.
(D–I) Representative xy images collected at different imaging depths showing bone vessels in the outer compact bone (D and E), sinusoidal capillaries in the BM cavities with trabecular bone (F–H), and inner compact bone with few bone vessels (I).
(J) Image showing maximum intensity projection of GFP+ bone vessels and BM sinusoidal capillaries. Corresponding 3D representation is shown in Movie S1.
(K) Schematic showing curved shape of calvarial bone with compact bone (cp), trabecular bone (tb), and BM cavities (bmc).
The precise organization of the calvarial BM vasculature at high resolution has remained incompletely understood due to technical difficulties caused by the calcified and matrix-rich properties of bone. Confocal microscopy is of limited use because of the need to image through the strongly scattering outer compact bone into the BM cavities containing microvessels. Sections can only partially represent key features of complex 3D tissue architecture, since the curvature results in ring-shaped tissue sections (Figure 1K). Imaging the intact calvarium is also complicated by the curved shape leaving areas out of focus of the imaging plane (Figure 1K). Furthermore, immunostaining is limited due to poor accessibility of antibodies to the narrow cavities of the calvarial bone tissue.
Using tile scans and deep z stacks from intact the skull, we obtained a detailed 3D reconstruction of the calvarial BM microvasculature (Figure S1A). Long and comparably thin (<10 μm) arteries consistently branch into two downstream arterial vessels after 313 ± 170 μm (36 vessel segments, n = 4 animals). Arterial vessels preferentially connect to sinusoidal capillaries of wider lumen in proximity of the endosteal surface forming bulb-shaped terminal BM compartments. Sinusoidal vessels located within the BM cavities were irregular in shape and displayed a highly variable pattern of multiple interconnecting side branches (Figure S1) with an average length of 122 ± 61 μm (90 vessel segments, n = 4 animals).
In addition, we visualized BM arterial vessels and sinusoidal capillaries using GFP+ transgenic mice (Flk1-GFP or Efnb2-GFP [Davy and Soriano, 2007]) and intravenous injection of anti-Endomucin (Emcn) or anti-CD31 antibodies conjugated to Alexa Fluor 594 (Figure 2). Different types of BM microvessels could be distinguished in the calvarium after immunostaining with these specific cell-surface markers. Flk1-GFP+ endothelial cells (ECs) of the highly branched sinusoidal vasculature were strongly positive for Emcn, whereas arteries displayed only weak labeling (Figures 2A, 2C, and 2D). Arterial but not sinusoidal ECs were positive for Efnb2-GFP, a knockin expressing nuclear H2B-GFP fusion protein under the control of the arterial gene Efnb2 (Figures 2B and 2G). Arteries also displayed strong CD31 staining, which was comparably weak in Efnb2-GFP-negative sinusoidal capillaries (Figures 2B, 2F, and 2G). Calcified bone and dark marrow cavities were visualized using SHG. The SHG signals of a single plane through the estimated center of the marrow cavities are shown, since merged images are not suitable to display structural details (Figures 2E and 2H).
Figure 2.

Identification of Bone Vessel Subtypes in the BM Compartment with Arterial and Sinusoidal Vessel Markers
(A) Maximum intensity projection of tile scans showing interconnecting network of Emcn+ arterial vessels and sinusoidal capillaries.
(B) Maximum intensity projection of tile scans showing CD31hi (red) GFP+ (green) arterioles and CD31low sinusoids of Efnb2-GFP mouse calvarium.
(C) Emcnlow arteriole (arrowhead) connects to Emcnhi sinusoidal capillaries (arrows).
(D) Both arterioles (arrowhead) and sinusoidal capillaries (arrows) are GFP+ (green) in Flk1-GFP mice.
(F and G) CD31hi (red) Efnb2-GFP+ (green) arterioles (arrowheads) connect to BM microdomains formed by interconnecting CD31low sinusoidal capillaries (arrows).
(E and H) SHG signals (blue) indicate bone tissue surrounding the BM cavities. Note that one single plane for SHG is shown. Due to the curved shape of the skull SHG planes were slightly tilted.
Blood Flow Dynamics in Arterial and Sinusoidal Bone Marrow Vessels
To better understand the blood flow dynamics in the various types of BM vessels, we performed direct in vivo real-time measurements of RBC flow at the level of individual vessel segments. Intravital imaging of RBC motion in the BM microvasculature is feasible through a thin layer of bone without surgical manipulation using transgenic reporter mice and intravenous injection of TexasRed-dextran. RBCs exclude the dextran dye and appear as dark objects in the fluorescently labeled plasma (Shih et al., 2012). Multiple real-time movies of individual segments were recorded to investigate the short-time dynamics of RBCs flowing through BM arterial vessels and sinusoidal capillaries. RBC flow was captured at cellular level using high-resolution spatiotemporal measurements (Figure 3).
Figure 3.

Microvascular Blood Flow Dynamics in the BM Compartment
(A) In vivo two-photon imaging of arterial vessels and sinusoidal capillaries using intravenously injected TexasRed dextran (red) and real-time movies of regional microvascular blood flow dynamics (boxed areas 1–4).
(B–E) Blood flow dynamics in arterial vessel and down-stream sinusoidal vessel segments were recorded (B). Representative image sequences of vessel segments 1–4; boxed areas in (A) are shown in (C)–(E).
Arrowheads (A) and arrows (B) indicate direction of blood flow. Corresponding real-time movies are shown in Movies S2, S3, and S4. Data are from one representative animal, n = 4 animals.
In arterial vessels, we observed rapid flow of a stack of tightly packed RBCs (Figure 3B; Movie S2). At their distal end, arteries progressively transform into wider post-arterial capillaries, which connect to the sinusoidal vessel compartment. The flow pattern of RBC changed dramatically and became turbulent when arterial vessels reached these vessels segments of wider lumen. Curved vessels segments reinforced this effect leading to a quick disintegration of RBC stacks and considerably slower flow speed (Figures 3C and 3D; Movie S3). Not all vessels of small diameter were arterial vessels. Sinusoidal capillary beds contained very thin side branches, which carried little flow so that RBC movement was very slow (Figure 3E; Movie S4).
Blood flow dynamics in the BM vasculature were also analyzed with a larger imaging area and single-plane recordings. While cellular resolution was not achieved, blood flow in arteries and the downstream capillaries were captured simultaneously (Movie S5). The arterial vessel with rapid RBC flow connected terminally to post-arterial capillaries (not contained in the imaging plane shown) and finally to a network of sinusoidal capillaries. Downstream sinusoidal capillaries show bulk RBC flow with random motions at lower speed, also collecting blood from neighboring interconnecting sinusoids (Movie S5). Overall, we observed that RBC flow through the BM microvasculature was very variable with strong spatial differences and temporal fluctuation.
Blood Flow Profile in Bone Marrow Microvessels
To obtain a more detailed view on blood flow dynamics and real-time RBC velocities, repetitive centerline scans were performed after intravenous injection of fluorescently labeled dextran to determine flow velocities (Shih et al., 2012) in various individual vessel segments in the BM compartment (Figure 4A). Arterial vessels were identified by EC-specific expression of GFP using Efnb2-GFP transgenic mice (Figure 4B). Blood flow velocities in 22 selected vessels segments were determined and assembled to a flow profile map (Figures 4C and 4D). A region within the BM microenvironment was selected, which allowed the simultaneous imaging of blood flow velocities in arterial vessels with few side branches, in downstream post-arterial, intermediate, and sinusoidal capillaries, and in veins collecting blood from the networks of neighboring sinusoids. GFP+ arterial vessels with diameters <10 μm showed rapid blood flow with velocities in the range of 2.0–2.5 mm/s (segments 1–3). Velocities in downstream post-arterial (segments 4–6, 1.0–1.7 mm/s) and intermediate capillaries (segments 7 and 8, 0.5 mm/s) dropped to 0.2–0.8 mm/s in sinusoidal capillaries (segments 9–11 and 14–19). Frequently, vessel segments in the sinusoidal network were found to have stationary RBC flow, as seen in Figure 4C (segments 12 and 13). Sinusoids finally drained into a larger collecting venule of a diameter of 20–25 μm, which showed flow velocities of 0.5–0.8 mm/s (segments 20–22).
Figure 4.

Microvascular Blood Flow Profile in the BM Compartment
(A and B) In vivo two-photon imaging of the BM compartment showing the microarchitecture of blood vessels (red) and GFP+ arterial vessels (green) in Efnb2-GFP mice.
(C and D) Microvascular blood flow velocities of depicted vessel segments were determined using repetitive line-scans. Note that arterial vessels of small caliber (segments 1–3) progressively transform into post-arterial (segments 4–6), intermediate (segments 7 and 8), and thin-walled sinusoidal capillaries with a wider lumen (segments 9–19). Sinusoidal capillaries finally drain blood into a larger collecting venule (segments 20–22). Arrowheads point to cells adhering to the endothelium (C). Color coding in (D): red, arterial vessel; light red, post-arterial vessel; gray, intermediate capillary; light blue, sinusoidal capillaries, blue, collecting vein. Bars represent mean values ± SD of one representative animal, 10–22 vessels segments per animal, n = 4 animals.
Similar blood flow measurements were performed in a terminal BM compartment with microvessels located in cavities distal to the superior sagittal sinus (Figure 5). A long artery (diameter <10 μm, 1.3–1.5 mm/s, segments 1 and 2) branched at its distal end into a post-arterial (0.8 mm/s, segment 4) and intermediate capillary (0.4 mm/s, segment 4). These vessels progressively transform into wider sinusoidal capillaries, which distribute blood flow into the sinusoidal vasculature. With an approximate vessel diameter of 15–40 μm, blood flow slowed down considerably in these vessels showing values in the range of 0.07–0.26 mm/s (segments 5–9). Blood flow velocities in the highly branched and irregular network of sinusoidal capillaries (diameter: 8–20 μm, segments 10–16) were in the range of 0.08–0.25 mm/s (Figure 5E). Calcified bone visualized by SHG signals confirmed that arteries terminate in proximity of the endosteal surface, whereas sinusoidal capillaries reside within BM cavities (Figures 5A and 5B).
Figure 5.

Microvascular Blood Flow Profile of a Terminal BM Compartment
(A and C) In vivo two-photon imaging of a terminal BM compartment showing an arterial and post-arterial vessel (segments 1–3) connecting to an intermediate capillary (segment 4) that drains into a sinusoidal capillary (segments 6 and 7) and an interconnected network of downstream sinusoidal capillaries (segments 8–16) visualized by intravenous (i.v.) injection of TexasRed-dextran (red). GFP+ (green) labels the endothelium in Flk1-GFP transgenic mice.
(B) SHG signals (blue) indicate calcified bone tissue surrounding the BM cavities.
(D) Schematic showing principle of line-scan measurements for blood flow measurements (top). Representative line scans from six vessel segments (bottom).
(E and F) Blood flow velocities (E) and RBC volume flow (F) of 16 vessel segments indicated in (C). Color coding in (E) and (F): red, arterial vessel; light red, post-arterial vessel; gray, intermediate capillary; light blue, sinusoidal capillary; blue, collecting vein. Bars represent mean values ± SD from one representative animal, 11–16 vessels segments per animal, n = 4 animals.
Volume flow ( = flux) of RBC was calculated based on flow velocities, vessel diameter, and RBC densities (Figure 5F; Table S1). Line scans identified individual microvessels with highly variable RBC densities resulting in strong differences in RBC flow rates (Figure 5D). In arteries, post-arterial, intermediate, and directly adjacent sinusoidal capillaries (segments 1–9), RBC flux remained tentatively high with values ranging from 10 to 30 pL/s (RBC flow densities: 52%–78%) indicating that the bulk flow is directed through the outer vessel loop (segments 1–9) close to the endosteal surface (Figure 5F). In contrast, the network of downstream sinusoidal capillaries (segments 10–16) showed significantly lower RBC flux due to lower RBC densities (13%–55%) and vessel diameters of 8–20 μm. Most interestingly, some downstream sinusoidal capillaries showed very little RBC flux (Figures 5D and 5F, segments 10 and 11), and in other regions blood flow was undetectable (data not shown). Most interestingly, in few sinusoidal vessels (segments 6, 7, 10, and 13) wall shear stress was below 1 dyn/cm2 (Table S1) facilitating cell attachment. In fact, stationary cells (dark round cells) were preferentially observed in these regions adhering to the luminal endothelium (Figure 5C).
To provide quantified data across different types of BM vessels, despite the complexity and heterogeneity of the calvarial vasculature, we calculated average hemodynamic parameters including shear rates and wall shear stress in arterial vessels, post-arterial, intermediate, and downstream sinusoidal capillaries derived from multiple BM cavities and animals (Table 1). Arterial vessels typically showed flow velocities of 2.0 ± 0.6 mm/s. Blood flow dropped by an order of magnitude in connecting post-arterial and intermediate capillaries to reach values of 0.23 ± 0.22 mm/s in downstream sinusoids. Along with blood flow, wall shear stress was reduced substantially in sinusoidal capillaries (diameter 21 ± 11 μm; 2.9 ± 2.7 dyn/cm2) relative to arterial vessels and post-arterial capillaries (diameter <10 μm), which showed values of 66 ± 16 dyn/cm2 and 35 ± 12 dyn/cm2, respectively. Connecting intermediate capillaries (diameter 11 ± 2 μm) showed wall shear stress of 14 ± 5 μm (Table 1).
Table 1.
Dimensions and Hemodynamic Parameters across Different BM Microvessels
| Vessel Segments (n) | Diameter (μm) | Velocity (mm/s) | RBC Density (%) | RBC Flux pL/s | Viscosity (cP) | Shear Rate (1/s) | Shear Stress (dyn/cm2) | |
|---|---|---|---|---|---|---|---|---|
| Arterial vessel | 9 | 8.0 ± 1.0 (6.9–9.6) | 1.95 ± 0.57 (1.19–2.34) | 73 ± 6 (60–79) | 39.3 ± 22.0 (14.1–25.7) | 3.4 ± 0.2 (3.0–3.6) | 1921 ± 417 (1245 – 2569) | 65.5 ± 16.0 (40.3 – 86.3) |
| Post-arterial capillaries | 5 | 7.8 ± 1.0 (7.1–9.4) | 1.10 ± 0.31 (0.79–1.6) | 62 ± 17 (44–78) | 16.4 ± 6.3 (8.9–21.4) | 3.1 ± 0.5 (2.5–3.5) | 1150 ± 409 (672 – 1766) | 34.6 ± 12.3 (23.8 – 55.6) |
| Intermediate capillaries | 6 | 11.2 ± 1.9 (8.8–16.9) | 0.66 ± 0.18 (0.44–0.89) | 58 ± 16 (38–70) | 15.8 ± 10.9 (6.8–34.0) | 3.0 ± 0.5 (2.3–3.5) | 484 ± 126 (323 – 667) | 14.2 ± 4.7 (10.5 – 22.0) |
| Sinusoidal capillaries | 31 | 21.1 ± 10.7 (9.3–46.2) | 0.23 ± 0.22 (0.07–0.69) | 44 ± 18 (13–75) | 13.6 ± 13.4 (0.6–47.0) | 2.5 ± 0.5 (1.8–3.5) | 119 ± 114 (3 – 339) | 2.9 ± 2.7 (0.06 – 11.1) |
To visualize blood flow TexasRed dextran was intravenously injected, and RBCs were recorded during their passage through the BM microvasculature. Luminal diameters, RBC velocities, and RBC density were determined, and RBC flux, shear rates, and, with estimated viscosities, wall shear stress were calculated. Numbers shown are mean values ± SD, ranges are shown in parentheses, and 51 vessel segments were analyzed from five animals.
Dynamics of HSPC Homing to Bone Marrow Vessels
To better understand the dynamics of HSPC homing to the BM microvasculature and the influence of blood flow and shear stress on this process, we used high-resolution intravital two-photon microscopy to analyze the behavior of these cells during their passage through the BM vasculature. A combination of multiple cell-surface markers was used to highly enrich HSPCs isolated from total BM cells of long bones (Figure S2). Since all methods of cell isolation described so far can only enrich for HSCs, we refer to HSPCs to account for any progenitor cell contamination. We used HSPC transplantation to study the dynamic interactions of HSPCs with the BM microvasculature (Lo Celso et al., 2009a). The isolated cells were labeled with PKH67, a fluorescent membrane linker that was successfully used before to study HSC engraftment in recipient BM (Askenasy and Farkas, 2002). Lineage-depleted fluorescently labeled HSPCs were intravenously injected together with directly conjugated Emcn antibodies to visualize the endothelium of BM microvessels. The dynamic behavior of individual HSPCs was recorded using real-time imaging at 15 min to 3 hr and at 24 hr after HSPC injection.
We observed considerable variability in the HSPC rolling fraction in irregularly shaped BM sinusoids, while no homing events were detected in arterial vessels. HSPC tracks often showed intervals of rolling and transient adhesion with mean velocities of 15.1 ± 8.3 μm/s. Maximum rolling velocities were in the range of 40–80 μm/s (Figures 6A, 6B, 6G, and S3A; Movie S6). A second HSPC fraction showed slow rolling behavior in the range of 5–15 μm/s that frequently resulted in firm adhesion of HSPC on the luminal surface of sinusoidal capillaries (mean velocities: 2.4 ± 1.2 μm/s, Figures 6A, 6C, and 6G; Movie S7). After firm adhesion, HSPC often migrated at slow speed on the luminal side of sinusoids with mean velocities of 0.16 ± 0.33 μm/s (Figures 6A, 6D, and 6G; Movie S8). Eventually, slowly rolling and adhering HSPCs transmigrated across the BM sinusoidal endothelium. The passage of HSPC through the BM endothelium is very rare and transient. We captured this event in our study twice and observed another HSPC after extravasation close to a sinusoid (Figures 6E, Movie S9, and S3C). The process was initiated by a single protrusion that projected through the endothelial lining. Within ∼1.5 min, the HSPC translocated its cell body from a luminal to a perivascular position to reach the marrow cavity where it stayed in close proximity to the vessel wall and showed active cellular protrusions (Figure 6E; Movie S9).
Figure 6.

Homing of HSPCs to BM Sinusoidal Capillaries
(A) Micrograph showing velocities of individual HSPC tracks during rolling and transient adhesion, slow rolling and adhesion, slow migration, and transmigration 0.5–3 hr after intravenous injection of fluorescently labeled HSPCs. After 24 hr, HSPC reside in the BM cavity in proximity to sinusoidal capillaries. Zoom-in view is on the right.
(B–D) Velocity-time graphs of two representative tracks for rolling and transient adhesion (B, T1 and T2 in A showing slow rolling and adhesion; C, T3 and T4 in A showing slow rolling and adhesion; D, T5 and T6 in A showing slow migration). Bars represent mean values ± SD, 15 vessels segments were analyzed from n = 7 animals.
(E and F) HSPC transmigration and local cellular interaction in the BM compartment. (E) Fluorescently labeled BM lineage-depleted HSPC (green) transmigrated across the Enmc+ endothelium of BM sinusoids (red) after rolling and a short adhesion phase as visualized by in vivo two-photon imaging; time in minutes (Movie S9). Red arrowheads follow luminal adhering HSPC to a perivascular position close to the sinusoidal endothelium. Yellow arrowheads point toward adhering or slowly migrating HSPCs. Note that transmigration event is initiated by a single protrusion that projects through the endothelium. Within ∼1.5 min, the HSPC translocates its cell body through the endothelium to a perivascular position in the BM cavity. Note that two transmigration events from two animals are reported (Figure S3C). (F) Several HSPCs (green) reside in the BM compartment in close proximity to Enmc+ sinusoidal capillaries (red). Most HSPCs reside stationary or migrate very slowly and show local cell membrane protrusions behavior (arrows) indicating active cell interactions; time is in minutes (Movie S10).
(G) Schematic illustrating the multistep process of HSPC homing with mean velocities for individual steps. Bars represent mean values ± SD, 15 vessels segments were analyzed from n = 7 animals.
The majority of HSPCs that successfully arrived at the marrow cavity remained stationary or migrated at very slow speed (mean velocities: 0.018 ± 0.009 μm/s), as documented by real-time imaging 24 hr after HSPC injection (Figure 6A). We observed that these HSPCs frequently extended transient protrusions (Figure 6F; Movie S10). Taken together, these data highlight key aspects of dynamic HSPC behavior during homing into the BM cavity.
Discussion
The functional organization and blood flow dynamics in different types of vascular structures in the BM compartment have remained poorly understood due to technical challenges associated with in vivo high-resolution imaging of intact bone (Köhler et al., 2009, Xie et al., 2009). The key advantages of intravital two-photon imaging of the calvarium through a chronic cranial window are, besides its minimal invasiveness, the possibility of reaching high spatial and temporal resolution with imaging depths up to 300 μm allowing the analysis of the dynamic cellular behavior in the BM compartment (Lo Celso et al., 2009a, Lo Celso et al., 2011). The microarchitecture of different types of vascular structures can be directly visualized using transgenic fluorescent reporter mice or intravenous injection of directly conjugated antibodies. Simultaneous detection of collagen fibers by SHG microscopy identifies calcified bone tissue and dark BM cavities (Lo Celso et al., 2009a).
To optically access the BM cavities in long bone, alternative approaches have been used, which remove part of the compact bone and replace it with a glass coverslip (Askenasy and Farkas, 2002) or mechanically thinnen the outer layer of the compact bone resulting in better light penetration (Köhler et al., 2009). Both procedures include major surgical steps that can trigger inflammatory responses and disturb tissue microarchitecture. Other approaches use ex vivo real-time imaging technologies to trace the homing of transplanted GFP-expressing hematopoietic stem cells in femur (Xie et al., 2009), but the absence of blood flow could influence the homing and proliferation behavior. Current imaging technologies (Nombela-Arrieta et al., 2013), including deep imaging of BM using optically cleared long bones (Acar et al., 2015), allow a comprehensive quantitative analysis of HSPC distribution in BM cavities but do not address the dynamics of HSPC homing.
Early studies from Mazo et al. (1998) investigated the rolling interactions of a hematopoietic progenitor cell line in BM sinusoids of the mouse calvarium in vivo. More recent and refined imaging approaches made use of high resolution in vivo two-photon imaging and fluorescently labeled HSPCs. Nevertheless, imaging depth remained limited to ∼150 μm below the surface restricting imaging to the upper half of the calvarial flat bone (Fujisaki et al., 2011, Lo Celso et al., 2009a, Lo Celso et al., 2009b). Direct in vivo measurements of local oxygen tension in the calvarial BM uncovered unpredicted heterogeneities in local oxygen tension with lowest concentrations found in peri-sinusoidal regions (Spencer et al., 2014). Microvascular density only poorly indicates regions of low oxygen in BM, presumably because high vessel density not necessarily correlates with high perfusion of individual vessel segments (Nombela-Arrieta et al., 2013, Spencer et al., 2014). In fact, we observed highly variable RBC flow densities in BM with few sinusoidal capillaries showing barely any RBC flow providing a possible explanation why peri-sinusoidal areas show low oxygen tension (Spencer et al., 2014).
In most tissues, the vasculature shows a hierarchical organization with arteries branching into smaller arterioles giving rise to a network of capillaries, which, in turn, connect to venules and veins. In contrast, the organization of the BM vasculature is more complex and much less hierarchical. Besides, the micromorphology of sinusoidal capillaries depends on the localization within the skull with regard to the central superior sagittal sinusoid (Lassailly et al., 2013, Lo Celso et al., 2009a). Our own real-time imaging data show a highly variable RBC flow pattern with strong temporal and spatial fluctuations preferentially in downstream sinusoidal capillaries. In arterial vessels and post-arterial capillaries, flow velocities and wall shear stress compare well with findings in arterioles of other vascular beds (Pries et al., 1995) and with in vitro model predictions (Pries et al., 1990). Sinusoidal capillaries, however, show flow velocities and wall shear stress that were by an order of magnitude lower than in capillaries and venules of other vascular beds (Pries et al., 1992, Pries et al., 1995, Pries and Secomb, 2008). Shear stress has a critical influence on rolling behavior of various cell types on the endothelium and values above 2–3 dyn/cm2 strongly reduce the rolling cell fraction (Ando et al., 1994, Mueller et al., 2006). Moreover, low densities of flowing RBCs locally reduce blood viscosity and thereby wall shear stress. Consequently, these areas within the BM microvasculature are sites, which might facilitate cell trafficking in the BM compartment, such as HSPC and cancer cell homing and immune cell trafficking. Thus, our intravital imaging approach could have important applications in other research areas, e.g., cancer research and immunology.
To prove that sinusoids are preferred sites of HSPC homing due to low blood flow velocities and low wall shear rates, we studied the dynamic interactions between ex vivo PKH67-labeled lineage-depleted BM cells and the BM endothelium of non-irradiated recipient mice. Unmanipulated animals show steady-state hematopoiesis and allow studying the endogenous role of cellular and extracellular components in HSPC homing (Heazlewood et al., 2014). BM ablation by irradiation is unquestionably important when engraftment and long-term repopulation by transplanted cells are studied (Mazo et al., 2011) but leads to extensive changes in the BM microarchitecture, precluding insights into physiological HSPC homing (Lo Celso et al., 2011, Mazo et al., 2002).
We monitored the cellular dynamics with a focus on early events of this multi-step process, including HSPC rolling and adhesion in BM sinusoids, and thereby obtained detailed information on HSPC track velocities. While HSPC rolling, transient adhesion, slow rolling resulting in firm adhesion, and slow luminal migration were frequently observed, HSPC transmigration was very rare consistent with the low rate and transient nature of HSPC homing into the BM vasculature (Massberg et al., 2007, Wright et al., 2001). Due to this fact, key aspects of HSPC transmigration have remained elusive until recently. Itkin et al. (2016) captured two HSPC transmigration events in vivo albeit with little temporal resolution. Our imaging setup offers a significantly improved frame rate that allowed capturing HSPC protrusion formation and subsequent translocation of the cell body through the endothelial monolayer.
Our methodology can be applied to long-term studies of HSPC dynamics and proliferation over days and weeks, since intravital two-photon imaging through a chronic cranial window allows repeated imaging of the same site (Fuhrmann et al., 2007, Holtmaat et al., 2009, Shih et al., 2012). As described previously (Lo Celso et al., 2011), labeled HSPCs injected into non-irradiated recipients do not proliferate and were detected weeks after transplantation, whereas cells injected into irradiated recipients undergo cell division and dilute the label to undetectable levels within few days. We monitored the dynamic interactions of HSPC in the BM cavity 24 hr after transplantation and observed that HSPC mainly remained stationary and interacted actively with the BM environment.
In summary, our methodology for direct in vivo measurement of blood flow dynamics and RBC velocities at the level of individual arterial vessels and sinusoidal capillaries together with the possibility to study HSPC interactions with the endothelium at cellular resolution will greatly improve our understanding of the cellular and molecular mechanisms governing HSPC homing to the BM.
Experimental Procedures
Two-Photon Imaging Setup
We used a TriM Scope II multi photon system from LaVision BioTec to visualize immune labeling and SHG generated by collagen in the bone. The setup is a single-beam instrument with an upright Olympus BX51 WI microscope stand that is equipped with high sensitive non-descanned detectors close to the objective lens. The TriM Scope II is fitted with a Coherent Scientific Chameleon Ultra II Ti:Sapphire laser and a Coherent Chameleon Compact optical parametric oscillator (OPO). A 20× infrared (IR) objective lens (Olympus XLUMPlanFL; numerical aperture [NA] 1.0) with a working distance of 2.0 mm was used. The microscope is equipped with a pair of x-y galvanometric mirrors used to scan at a scanning speed of up to 1,200 lines/s. The maximal laser power (850 nm) on the object was 10–20 mW at superficial areas and 80–100 mW when imaging at large depths. Dichromatic mirrors and band pass filters spectrally separate the emitted light before the signal is detected using attached photomultiplier tubes (PMTs; Hamamatsu H67080-01 (blue channel), and H67080-20 (green and red channels). The following detection channels were used: red (560–680 nm), green (475–575 nm), and blue (370–470 nm). 3D images were acquired and processed with LaVision BioTec ImSpector Pro.
Construction of Composite Images
We obtained stitched 3D images of BM microvasculature by labeling the vasculature using GFP+ transgenic mice (Flk1-GFP [Xu et al., 2010] and ephrinb2-GFP [Davy and Soriano, 2007]) and by intravenously injecting Enmc (clone V.5C7) (Morgan et al., 1999) or CD31 (clone 390) antibodies conjugated to Alexa Fluor 594. 3D stacks (470 × 470 μm, 4 × 3 stacks, up to 80 planes with step size of 2–4 μm) were recorded with 20% overlap using the microscope acquisition software. Image processing and stitching of high resolution 3D images were obtained using ImageJ (open source NIH software, https://imagej.nih.gov/ij using the stitching plugin) to obtain 3D overview images with a typical size of 1,500 × 1,200 × 150 μm.
Animals
All animal experiments were conducted in accordance with German guidelines and were approved by the relevant authorities (LANUV, Recklinghausen). For the experiments, mice of both sexes were used, although the majority of experiments were done with female mice. Mice used were between 8 and 12 weeks old unless stated otherwise.
Animal Preparation
We used a chronic cranial window to provide clear optical access to bone and BM microvessels of the skull (Holtmaat et al., 2009, Shih et al., 2012). A schematic of the cranial window construction and fixation of the mouse using the head immobilization device is shown in Figure 1A. C57BL/6J mice were anesthetized with a combination of ketamine/xylazine. A circular incision was made in the scalp to expose the underlying dorsal skull surface. A round glass coverslip with a hanging drop of sterile PBS was placed on the area of interest and fixed with dental acrylic. A custom-designed titanium ring was glued on top, which allows fixation using a head immobilization device to eliminate movement artifacts. Implantation of a glass coverslip on the dorsal skull surface is a minimal invasive surgery leaving the calvarial bone and BM vasculature fully intact. Dexamethason was used to prevent inflammatory responses (Holtmaat et al., 2009, Shih et al., 2012). For intravital imaging, we used ketamine/xylazine for anesthesia, which is widely used for intravital imaging and HSPC homing (Lo Celso et al., 2011, Mazo et al., 1998, Scott et al., 2014). Mice were kept on a 37°C heat pad to keep the body temperature constant (Holtmaat et al., 2009), and physical condition was frequently controlled by observing the breathing frequency and overall condition of the mice.
For immunofluorescence imaging, Enmc and CD31 antibodies were conjugated to Alexa Fluor 594 according to manufacturer’s protocols. Labeled Enmc or CD31 antibodies (0.5–1 mg/kg) were injected into mice through the tail vein. One hour after antibody injection, high-resolution images were obtained through the intact mouse skull in vivo or in vitro using whole skulls fixed in 4% paraformaldehyde (PFA)/PBS.
Blood Flow Measurements
For in vivo imaging of blood flow dynamics at cellular resolution in BM microvessels TexasRed-dextran (70,000 molecular weight [MW], Molecular Probes) was injected into mice through the tail. The dextran dye labels the blood plasma but is excluded from RBCs, which appear as dark objects moving against a bright fluorescent background allowing to record dynamic movements of RBCs in the different types of BM vessels (Shih et al., 2012).
Real-time movies were recorded to visualize blood flow dynamics by using a small region of interests (45 × 20 μm) with a short acquisition frame rate (0.15 s, 600 frames) to capture images of a depicted vessel segment at cellular resolution. Real-time movies were recorded at multiple sites and assigned to the corresponding vessel segments in of an overview 3D image. Overview real-time movies (370 × 190 μm, acquisition frame rate: 2.3 s, 50 frames) allow to animate blood flow dynamics in different types of vessels in the BM compartment.
Blood flow velocities in BM vessels were determined using centerline scans (Shih et al., 2012). Blood vessel segments were repetitively scanned (500 lines) along the length of the center of a depicted vessel to measure the speed of RBCs. A line-scan rate of 0.5–2 kHz is typically required for accurate sampling of RBC movement. Linear scan data are plotted as a space-time image with individual scan lines stacked on each other. When sampled at sufficient rate, moving RBCs will appear as diagonal streaks, and the slope of the streak is related to the RBC velocity (Shih et al., 2012). In very fast flowing vessels, the streaks will become horizontal, and velocity data cannot be extracted. Stationary flow is recognized by vertical streaks. Up to 20–25 individual vessel segments were measured in random order. To ensure flow velocities remained constant, we measured selected vessels twice at different time points, i.e., at the beginning and end of an experiment. Time limitations are continuous dye leakage preferentially out of sinusoids and active dye uptake by perivascular macrophages situated in proximity to sinusoids. Overview images were therefore captured at the beginning of an imaging session. Dextran dyes of higher molecular weight allow prolonged imaging.
We used a python script implemented in the acquisition software to export velocity data of single RBC streaks. To determine flow velocities of a selected vessel segments slopes of mind, ten representative streaks acquired at two different scan rates were exported, and mean values were calculated.
Flux ( = volume flow) of RBC was calculated from velocity data, vessel diameters, and RBC densities as follows: flux = (π/8) × velocity × (diameter)2 × density. The RBC densities were estimated from the density of dark lines (reflecting individual RBCs) obtained from lines scans (Figure 6D). The following formulas were used to calculate shear rate and shear stress: shear rate = (8 × velocity) / diameter; shear stress = shear rate × viscosity. Viscosities were estimated from blood viscosity (3.5 cP, 45% hematocrit), plasma viscosity (1.2 cP, lacking RBCs), and RBC density as follows: viscosity = 1.2 + (3 × RBC density), since changes in hematocrit (proportion of blood volume that is occupied be RBCs) influences blood viscosity (Nichols and O’Rourke, 2011, Pries et al., 1992, Pries and Secomb, 2008)
Lineage Depletion and PKH Labeling of BM Cells
For enrichment of HSPCs, BM cells were isolated from femurs of 6- to 7-week-old C57BL/6J mice. Mice were sacrificed and femurs were collected (Kusumbe et al., 2015). BM cells were isolated by crushing femurs with mortar and pestle in Ca2+/Mg2+-free PBS containing 2% heat-inactivated bovine serum. The cells were drawn by passing through a 25G needle several times and filtered with a 70-μm filter. Single-cell suspension obtained was subjected to lineage depletion (MACS, Miltenyi Biotech) following the manufacturer’s instructions.
Lineage-depleted BM cells were labeled with cell membrane dyes PKH67 green fluorescent linker kit (Sigma). 5 × 10⁶ cells were washed once in DMEM and suspended in 1 mL of diluent solution C. 1 mL of PKH67 at 2 × 10⁻³ M in diluent C was added and mixed, and cells were incubated for 7 min at room temperature (RT). The dye was inactivated by adding 1 mL DMEM supplemented with 25% fetal calf serum. This mixture was centrifuged, and cells were washed twice and suspended in sterile ice-cold PBS.
Transplantation and Homing
An antibody labeling approach with directly coupled Alexa Fluor 594 was used to stain the endothelium due to lack of a suitable red-fluorescent reporter mouse line. We labeled HSPCs with PKH67, since HSPCs labeled with red fluorophores can hardly be distinguished from auto-fluorescent cells of unknown identity that reside in the BM (Lo Celso et al., 2011). 8- to 10-week-old C57BL/6J non-irradiated recipient mice with a chronic cranial window implanted the day before were intravenously injected with non-blocking monoclonal anti-Enmc antibodies conjugated to Alexa Fluor 594 (0.5–1 mg/kg) and 30 min later transplanted by intravenous injection with 2.5 × 10⁶ PKH67-labeled HSPCs into the tail vein. Immediately after transplantation, mice were used for intravital two-photon imaging (Hendrikx et al., 1996).
Velocities of individual HSPC tracks were exported from time-lapse movies using Manual Tracking with TrackMate (ImageJ). Velocity-time graphs of representative tracks and boxplots with average HSPC velocities were used to document track velocities. Clustering of track velocities around distinct values allowed grouping them in different categories.
Statistics
SigmaPlot was to calculate statistical significance and to design micrographs and boxplots. Bars represent mean values ±SD.
Author Contributions
M.G.B. designed and performed intravital two-photon experiments. A.P.K, S.K.R., and K.K.S. characterized and transplanted HSPCs. S.B. and D.V. provided directly conjugated antibodies. M.G.B. and R.H.A. directed the research project and wrote the manuscript.
Acknowledgments
We thank M. Fuhrmann for initial support with the chronic cranial window surgery, F. Winkler for sharing expertise on the mouse imaging setup with head immobilization using a titanium ring, M. Böttcher for providing a Phyton script for analyzing line-scan data for blood flow velocity measurements, and A. Medvinsky for kindly providing Flk1-GFP mice. Funding was provided by the Max Planck Society, the University of Münster, the DFG cluster of excellence “Cells in Motion,” and the European Research Council (AdG 339409 AngioBone).
Published: February 14, 2017
Footnotes
Supplemental Information includes three figures, one table, and ten movies and can be found with this article online at http://dx.doi.org/10.1016/j.celrep.2017.01.042.
Contributor Information
M. Gabriele Bixel, Email: mgbixel@mpi-muenster.mpg.de.
Ralf. H. Adams, Email: ralf.adams@mpi-muenster.mpg.de.
Supplemental Information
3D representation of bone vessels in the outer compact bone, sinusoidal vessels in the bone marrow cavities with trabecular bone and inner compact bone with few bone vessels. GFP+, vasculature; SHG, bone tissue; step size z=4 ì.
Blood flowing through an arterial vessel in the BM compartment visualized by two-photon intravital imaging. The blood serum (red) was labeled by intravenous injection with TexasRed-dextran (Figure 3B). Note that tightly packed erythrocyte staples move regularly through the vessel segment. Occasionally the packing is less dense leaving a small gap between neighboring staples.
Blood flow through an early sinusoidal capillary in the BM compartment visualized by two-photon intravital imaging. The blood serum (red) was labeled by intravenous injection with TexasRed-dextran (Figure 3C). Note the irregular flow pattern of erythrocytes in the curved vessels segment.
Blood flow through a sinusoidal capillary in the BM compartment visualized by two-photon intravital imaging. The blood serum (red) was labeled by intravenous injection with TexasRed-dextran (Figure 3E). Note that only occasionally individual erythrocytes flow through this vessel segment.
Blood flow was animated simultaneously in the microvasculature of the BM compartment showing an arterial vessel (in the lower middle of the screen) with rapid blood flow connecting to post-arterial vessels into a network of interconnecting sinusoids of wider vessel lumen, slower blood flow and turbulent flow pattern. The blood serum (red) was labeled by intravenous injection with TexasRed-dextran. Calcified bone was visualized by SHG (blue).
Two-photon intravital imaging of fluorescently labeled BM lineage-depleted HSPC (green) rolling and transiently adhering on Enmc+ labeled BM sinusoidal capillaries (red). HSPC were intravenously injected and imaged for their homing in different types of BM vessels after 0.5-3 h. Rolling velocities of representative HSPC are in the range 40-80 ìa/sec. SHG signal (blue) indicates bone tissue.
Two-photon intravital imaging of fluorescently labeled BM lineage-depleted HSPC (green) rolling slowly and subsequently adhering to Enmc+ labeled BM sinusoids (red). HSPC were intravenously injected and imaged for their homing in different types of BM vessels after 0.5-3 h. Rolling velocities of representative HSPC are in the range 5-15 ìr/sec. SHG signal (blue) indicates bone tissue. Note that slow rolling is frequently followed by adhesion of HSPC on Enmc+ BM sinusoids.
Two-photon intravital imaging of fluorescently labeled BM lineage-depleted HSPC (green) caught at a branch point of Enmc+ labeled BM sinusoidal vessels (red) starts slowly migrating on the luminal vessel surface. HSPC were intravenously injected and imaged for their homing in different types of BM vessels after 0.5-3 h. SHG signal (blue) indicates bone tissue. Note a second HSPC is transiently adhering on the same site, but continues rolling in a different vessel segment.
Two-photon intravital imaging of fluorescently labeled BM lineage-depleted HSPC (green) in Enmc+ labeled BM sinusoidal capillaries (red). Note the slowly rolling HSPC that adheres in close proximity to an already adhering HSPC. After a short adhesion the newly arrived HSPC forms a protrusion that projects through the endothelial layer of the sinusoidal capillary. Within ∼1.5 min the HSPC transmigrates and remains in close proximity to the vessel wall. The perivascular located cell barely migrates, but shows active cell protrusions with the environment including the endothelial lining. SHG signal (blue) indicates bone tissue.
Two-photon intravital imaging of fluorescently labeled BM lineage-depleted HSPC (green) 24 h after intravenous injection. HSPC left the Enmc+ labeled BM sinusoidal capillaries (red) and reside in proximity of to the sinusoids in the BM cavity. The majority of cells hardly migrate (mean migration speed: 63±34 μm/h), but show active protrusions indicating lively cell interactions with the environment. SHG signal (blue) indicates bone tissue.
References
- Abboud C.N. Human bone marrow microvascular endothelial cells: Elusive cells with unique structural and functional properties. Exp. Hematol. 1995;23:1–3. [PubMed] [Google Scholar]
- Acar M., Kocherlakota K.S., Murphy M.M., Peyer J.G., Oguro H., Inra C.N., Jaiyeola C., Zhao Z., Luby-Phelps K., Morrison S.J. Deep imaging of bone marrow shows non-dividing stem cells are mainly perisinusoidal. Nature. 2015;526:126–130. doi: 10.1038/nature15250. [DOI] [PMC free article] [PubMed] [Google Scholar]
- Ando J., Tsuboi H., Korenaga R., Takada Y., Toyama-Sorimachi N., Miyasaka M., Kamiya A. Shear stress inhibits adhesion of cultured mouse endothelial cells to lymphocytes by downregulating VCAM-1 expression. Am. J. Physiol. 1994;267:C679–C687. doi: 10.1152/ajpcell.1994.267.3.C679. [DOI] [PubMed] [Google Scholar]
- Aoki M., Tavassoli M. Identification of microfilaments in marrow sinus endothelial cells: Their possible role in cell egress. J. Ultrastruct. Res. 1981;74:255–258. doi: 10.1016/s0022-5320(81)80116-5. [DOI] [PubMed] [Google Scholar]
- Askenasy N., Farkas D.L. Optical imaging of PKH-labeled hematopoietic cells in recipient bone marrow in vivo. Stem Cells. 2002;20:501–513. doi: 10.1634/stemcells.20-6-501. [DOI] [PubMed] [Google Scholar]
- Boulais P.E., Frenette P.S. Making sense of hematopoietic stem cell niches. Blood. 2015;125:2621–2629. doi: 10.1182/blood-2014-09-570192. [DOI] [PMC free article] [PubMed] [Google Scholar]
- Davy A., Soriano P. Ephrin-B2 forward signaling regulates somite patterning and neural crest cell development. Dev. Biol. 2007;304:182–193. doi: 10.1016/j.ydbio.2006.12.028. [DOI] [PMC free article] [PubMed] [Google Scholar]
- Ding L., Saunders T.L., Enikolopov G., Morrison S.J. Endothelial and perivascular cells maintain haematopoietic stem cells. Nature. 2012;481:457–462. doi: 10.1038/nature10783. [DOI] [PMC free article] [PubMed] [Google Scholar]
- Eliasson P., Jönsson J.I. The hematopoietic stem cell niche: Low in oxygen but a nice place to be. J. Cell. Physiol. 2010;222:17–22. doi: 10.1002/jcp.21908. [DOI] [PubMed] [Google Scholar]
- Ellis S.L., Grassinger J., Jones A., Borg J., Camenisch T., Haylock D., Bertoncello I., Nilsson S.K. The relationship between bone, hemopoietic stem cells, and vasculature. Blood. 2011;118:1516–1524. doi: 10.1182/blood-2010-08-303800. [DOI] [PubMed] [Google Scholar]
- Fuhrmann M., Mitteregger G., Kretzschmar H., Herms J. Dendritic pathology in prion disease starts at the synaptic spine. J. Neurosci. 2007;27:6224–6233. doi: 10.1523/JNEUROSCI.5062-06.2007. [DOI] [PMC free article] [PubMed] [Google Scholar]
- Fujisaki J., Wu J., Carlson A.L., Silberstein L., Putheti P., Larocca R., Gao W., Saito T.I., Lo Celso C., Tsuyuzaki H. In vivo imaging of Treg cells providing immune privilege to the haematopoietic stem-cell niche. Nature. 2011;474:216–219. doi: 10.1038/nature10160. [DOI] [PMC free article] [PubMed] [Google Scholar]
- Heazlewood S.Y., Oteiza A., Cao H., Nilsson S.K. Analyzing hematopoietic stem cell homing, lodgment, and engraftment to better understand the bone marrow niche. Ann. N Y Acad. Sci. 2014;1310:119–128. doi: 10.1111/nyas.12329. [DOI] [PubMed] [Google Scholar]
- Hendrikx P.J., Martens C.M., Hagenbeek A., Keij J.F., Visser J.W. Homing of fluorescently labeled murine hematopoietic stem cells. Exp. Hematol. 1996;24:129–140. [PubMed] [Google Scholar]
- Holtmaat A., Bonhoeffer T., Chow D.K., Chuckowree J., De Paola V., Hofer S.B., Hübener M., Keck T., Knott G., Lee W.C. Long-term, high-resolution imaging in the mouse neocortex through a chronic cranial window. Nat. Protoc. 2009;4:1128–1144. doi: 10.1038/nprot.2009.89. [DOI] [PMC free article] [PubMed] [Google Scholar]
- Itkin T., Gur-Cohen S., Spencer J.A., Schajnovitz A., Ramasamy S.K., Kusumbe A.P., Ledergor G., Jung Y., Milo I., Poulos M.G. Distinct bone marrow blood vessels differentially regulate haematopoiesis. Nature. 2016;532:323–328. doi: 10.1038/nature17624. [DOI] [PMC free article] [PubMed] [Google Scholar]
- Köhler A., Schmithorst V., Filippi M.D., Ryan M.A., Daria D., Gunzer M., Geiger H. Altered cellular dynamics and endosteal location of aged early hematopoietic progenitor cells revealed by time-lapse intravital imaging in long bones. Blood. 2009;114:290–298. doi: 10.1182/blood-2008-12-195644. [DOI] [PMC free article] [PubMed] [Google Scholar]
- Kopp H.G., Hooper A.T., Avecilla S.T., Rafii S. Functional heterogeneity of the bone marrow vascular niche. Ann. N Y Acad. Sci. 2009;1176:47–54. doi: 10.1111/j.1749-6632.2009.04964.x. [DOI] [PMC free article] [PubMed] [Google Scholar]
- Kunisaki Y., Bruns I., Scheiermann C., Ahmed J., Pinho S., Zhang D., Mizoguchi T., Wei Q., Lucas D., Ito K. Arteriolar niches maintain haematopoietic stem cell quiescence. Nature. 2013;502:637–643. doi: 10.1038/nature12612. [DOI] [PMC free article] [PubMed] [Google Scholar]
- Kusumbe A.P., Ramasamy S.K., Adams R.H. Coupling of angiogenesis and osteogenesis by a specific vessel subtype in bone. Nature. 2014;507:323–328. doi: 10.1038/nature13145. [DOI] [PMC free article] [PubMed] [Google Scholar]
- Kusumbe A.P., Ramasamy S.K., Starsichova A., Adams R.H. Sample preparation for high-resolution 3D confocal imaging of mouse skeletal tissue. Nat. Protoc. 2015;10:1904–1914. doi: 10.1038/nprot.2015.125. [DOI] [PubMed] [Google Scholar]
- Lassailly F., Foster K., Lopez-Onieva L., Currie E., Bonnet D. Multimodal imaging reveals structural and functional heterogeneity in different bone marrow compartments: Functional implications on hematopoietic stem cells. Blood. 2013;122:1730–1740. doi: 10.1182/blood-2012-11-467498. [DOI] [PubMed] [Google Scholar]
- Li X.M., Hu Z., Jorgenson M.L., Slayton W.B. High levels of acetylated low-density lipoprotein uptake and low tyrosine kinase with immunoglobulin and epidermal growth factor homology domains-2 (Tie2) promoter activity distinguish sinusoids from other vessel types in murine bone marrow. Circulation. 2009;120:1910–1918. doi: 10.1161/CIRCULATIONAHA.109.871574. [DOI] [PMC free article] [PubMed] [Google Scholar]
- Lo Celso C., Fleming H.E., Wu J.W., Zhao C.X., Miake-Lye S., Fujisaki J., Côté D., Rowe D.W., Lin C.P., Scadden D.T. Live-animal tracking of individual haematopoietic stem/progenitor cells in their niche. Nature. 2009;457:92–96. doi: 10.1038/nature07434. [DOI] [PMC free article] [PubMed] [Google Scholar]
- Lo Celso C., Wu J.W., Lin C.P. In vivo imaging of hematopoietic stem cells and their microenvironment. J. Biophotonics. 2009;2:619–631. doi: 10.1002/jbio.200910072. [DOI] [PubMed] [Google Scholar]
- Lo Celso C., Lin C.P., Scadden D.T. In vivo imaging of transplanted hematopoietic stem and progenitor cells in mouse calvarium bone marrow. Nat. Protoc. 2011;6:1–14. doi: 10.1038/nprot.2010.168. [DOI] [PMC free article] [PubMed] [Google Scholar]
- Massberg S., Schaerli P., Knezevic-Maramica I., Köllnberger M., Tubo N., Moseman E.A., Huff I.V., Junt T., Wagers A.J., Mazo I.B., von Andrian U.H. Immunosurveillance by hematopoietic progenitor cells trafficking through blood, lymph, and peripheral tissues. Cell. 2007;131:994–1008. doi: 10.1016/j.cell.2007.09.047. [DOI] [PMC free article] [PubMed] [Google Scholar]
- Mazo I.B., Gutierrez-Ramos J.C., Frenette P.S., Hynes R.O., Wagner D.D., von Andrian U.H. Hematopoietic progenitor cell rolling in bone marrow microvessels: Parallel contributions by endothelial selectins and vascular cell adhesion molecule 1. J. Exp. Med. 1998;188:465–474. doi: 10.1084/jem.188.3.465. [DOI] [PMC free article] [PubMed] [Google Scholar]
- Mazo I.B., Quackenbush E.J., Lowe J.B., von Andrian U.H. Total body irradiation causes profound changes in endothelial traffic molecules for hematopoietic progenitor cell recruitment to bone marrow. Blood. 2002;99:4182–4191. doi: 10.1182/blood.v99.11.4182. [DOI] [PubMed] [Google Scholar]
- Mazo I.B., Massberg S., von Andrian U.H. Hematopoietic stem and progenitor cell trafficking. Trends Immunol. 2011;32:493–503. doi: 10.1016/j.it.2011.06.011. [DOI] [PMC free article] [PubMed] [Google Scholar]
- Morgan S.M., Samulowitz U., Darley L., Simmons D.L., Vestweber D. Biochemical characterization and molecular cloning of a novel endothelial-specific sialomucin. Blood. 1999;93:165–175. [PubMed] [Google Scholar]
- Morrison S.J., Scadden D.T. The bone marrow niche for haematopoietic stem cells. Nature. 2014;505:327–334. doi: 10.1038/nature12984. [DOI] [PMC free article] [PubMed] [Google Scholar]
- Mueller F.J., Serobyan N., Schraufstatter I.U., DiScipio R., Wakeman D., Loring J.F., Snyder E.Y., Khaldoyanidi S.K. Adhesive interactions between human neural stem cells and inflamed human vascular endothelium are mediated by integrins. Stem Cells. 2006;24:2367–2372. doi: 10.1634/stemcells.2005-0568. [DOI] [PMC free article] [PubMed] [Google Scholar]
- Nichols W.W., O’Rourke M.F. Sixth Edition. CRC Press; 2011. McDonald’s Blood Flow in Arteries. Theoretical, Experimental and Clinical Principles. [Google Scholar]
- Nombela-Arrieta C., Silberstein L.E. The science behind the hypoxic niche of hematopoietic stem and progenitors. Hematology. 2014;2014:542–547. doi: 10.1182/asheducation-2014.1.542. [DOI] [PubMed] [Google Scholar]
- Nombela-Arrieta C., Pivarnik G., Winkel B., Canty K.J., Harley B., Mahoney J.E., Park S.Y., Lu J., Protopopov A., Silberstein L.E. Quantitative imaging of haematopoietic stem and progenitor cell localization and hypoxic status in the bone marrow microenvironment. Nat. Cell Biol. 2013;15:533–543. doi: 10.1038/ncb2730. [DOI] [PMC free article] [PubMed] [Google Scholar]
- Parmar K., Mauch P., Vergilio J.A., Sackstein R., Down J.D. Distribution of hematopoietic stem cells in the bone marrow according to regional hypoxia. Proc. Natl. Acad. Sci. USA. 2007;104:5431–5436. doi: 10.1073/pnas.0701152104. [DOI] [PMC free article] [PubMed] [Google Scholar]
- Pries A.R., Secomb T.W. Blood flow in microvascular networks A2 - Tuma, Ronald F. In: Durán W.N., Ley K., editors. Second Edition. Chapter 1. Academic Press; 2008. pp. 3–36. (Microcirculation). [Google Scholar]
- Pries A.R., Secomb T.W., Gaehtgens P., Gross J.F. Blood flow in microvascular networks. Experiments and simulation. Circ. Res. 1990;67:826–834. doi: 10.1161/01.res.67.4.826. [DOI] [PubMed] [Google Scholar]
- Pries A.R., Neuhaus D., Gaehtgens P. Blood viscosity in tube flow: Dependence on diameter and hematocrit. Am. J. Physiol. 1992;263:H1770–H1778. doi: 10.1152/ajpheart.1992.263.6.H1770. [DOI] [PubMed] [Google Scholar]
- Pries A.R., Secomb T.W., Gaehtgens P. Design principles of vascular beds. Circ. Res. 1995;77:1017–1023. doi: 10.1161/01.res.77.5.1017. [DOI] [PubMed] [Google Scholar]
- Rafii S., Mohle R., Shapiro F., Frey B.M., Moore M.A. Regulation of hematopoiesis by microvascular endothelium. Leuk. Lymphoma. 1997;27:375–386. doi: 10.3109/10428199709058305. [DOI] [PubMed] [Google Scholar]
- Scott M.K., Akinduro O., Lo Celso C. In vivo 4-dimensional tracking of hematopoietic stem and progenitor cells in adult mouse calvarial bone marrow. J. Vis. Exp. 2014:e51683. doi: 10.3791/51683. [DOI] [PMC free article] [PubMed] [Google Scholar]
- Shih A.Y., Driscoll J.D., Drew P.J., Nishimura N., Schaffer C.B., Kleinfeld D. Two-photon microscopy as a tool to study blood flow and neurovascular coupling in the rodent brain. J. Cereb. Blood Flow Metab. 2012;32:1277–1309. doi: 10.1038/jcbfm.2011.196. [DOI] [PMC free article] [PubMed] [Google Scholar]
- Simsek T., Kocabas F., Zheng J., Deberardinis R.J., Mahmoud A.I., Olson E.N., Schneider J.W., Zhang C.C., Sadek H.A. The distinct metabolic profile of hematopoietic stem cells reflects their location in a hypoxic niche. Cell Stem Cell. 2010;7:380–390. doi: 10.1016/j.stem.2010.07.011. [DOI] [PMC free article] [PubMed] [Google Scholar]
- Spencer J.A., Ferraro F., Roussakis E., Klein A., Wu J., Runnels J.M., Zaher W., Mortensen L.J., Alt C., Turcotte R. Direct measurement of local oxygen concentration in the bone marrow of live animals. Nature. 2014;508:269–273. doi: 10.1038/nature13034. [DOI] [PMC free article] [PubMed] [Google Scholar]
- Takubo K., Goda N., Yamada W., Iriuchishima H., Ikeda E., Kubota Y., Shima H., Johnson R.S., Hirao A., Suematsu M., Suda T. Regulation of the HIF-1alpha level is essential for hematopoietic stem cells. Cell Stem Cell. 2010;7:391–402. doi: 10.1016/j.stem.2010.06.020. [DOI] [PubMed] [Google Scholar]
- Wright D.E., Wagers A.J., Gulati A.P., Johnson F.L., Weissman I.L. Physiological migration of hematopoietic stem and progenitor cells. Science. 2001;294:1933–1936. doi: 10.1126/science.1064081. [DOI] [PubMed] [Google Scholar]
- Xie Y., Yin T., Wiegraebe W., He X.C., Miller D., Stark D., Perko K., Alexander R., Schwartz J., Grindley J.C. Detection of functional haematopoietic stem cell niche using real-time imaging. Nature. 2009;457:97–101. doi: 10.1038/nature07639. [DOI] [PubMed] [Google Scholar]
- Xu Y., Yuan L., Mak J., Pardanaud L., Caunt M., Kasman I., Larrivée B., Del Toro R., Suchting S., Medvinsky A. Neuropilin-2 mediates VEGF-C-induced lymphatic sprouting together with VEGFR3. J. Cell Biol. 2010;188:115–130. doi: 10.1083/jcb.200903137. [DOI] [PMC free article] [PubMed] [Google Scholar]
- Zhang J., Niu C., Ye L., Huang H., He X., Tong W.G., Ross J., Haug J., Johnson T., Feng J.Q. Identification of the haematopoietic stem cell niche and control of the niche size. Nature. 2003;425:836–841. doi: 10.1038/nature02041. [DOI] [PubMed] [Google Scholar]
Associated Data
This section collects any data citations, data availability statements, or supplementary materials included in this article.
Supplementary Materials
3D representation of bone vessels in the outer compact bone, sinusoidal vessels in the bone marrow cavities with trabecular bone and inner compact bone with few bone vessels. GFP+, vasculature; SHG, bone tissue; step size z=4 ì.
Blood flowing through an arterial vessel in the BM compartment visualized by two-photon intravital imaging. The blood serum (red) was labeled by intravenous injection with TexasRed-dextran (Figure 3B). Note that tightly packed erythrocyte staples move regularly through the vessel segment. Occasionally the packing is less dense leaving a small gap between neighboring staples.
Blood flow through an early sinusoidal capillary in the BM compartment visualized by two-photon intravital imaging. The blood serum (red) was labeled by intravenous injection with TexasRed-dextran (Figure 3C). Note the irregular flow pattern of erythrocytes in the curved vessels segment.
Blood flow through a sinusoidal capillary in the BM compartment visualized by two-photon intravital imaging. The blood serum (red) was labeled by intravenous injection with TexasRed-dextran (Figure 3E). Note that only occasionally individual erythrocytes flow through this vessel segment.
Blood flow was animated simultaneously in the microvasculature of the BM compartment showing an arterial vessel (in the lower middle of the screen) with rapid blood flow connecting to post-arterial vessels into a network of interconnecting sinusoids of wider vessel lumen, slower blood flow and turbulent flow pattern. The blood serum (red) was labeled by intravenous injection with TexasRed-dextran. Calcified bone was visualized by SHG (blue).
Two-photon intravital imaging of fluorescently labeled BM lineage-depleted HSPC (green) rolling and transiently adhering on Enmc+ labeled BM sinusoidal capillaries (red). HSPC were intravenously injected and imaged for their homing in different types of BM vessels after 0.5-3 h. Rolling velocities of representative HSPC are in the range 40-80 ìa/sec. SHG signal (blue) indicates bone tissue.
Two-photon intravital imaging of fluorescently labeled BM lineage-depleted HSPC (green) rolling slowly and subsequently adhering to Enmc+ labeled BM sinusoids (red). HSPC were intravenously injected and imaged for their homing in different types of BM vessels after 0.5-3 h. Rolling velocities of representative HSPC are in the range 5-15 ìr/sec. SHG signal (blue) indicates bone tissue. Note that slow rolling is frequently followed by adhesion of HSPC on Enmc+ BM sinusoids.
Two-photon intravital imaging of fluorescently labeled BM lineage-depleted HSPC (green) caught at a branch point of Enmc+ labeled BM sinusoidal vessels (red) starts slowly migrating on the luminal vessel surface. HSPC were intravenously injected and imaged for their homing in different types of BM vessels after 0.5-3 h. SHG signal (blue) indicates bone tissue. Note a second HSPC is transiently adhering on the same site, but continues rolling in a different vessel segment.
Two-photon intravital imaging of fluorescently labeled BM lineage-depleted HSPC (green) in Enmc+ labeled BM sinusoidal capillaries (red). Note the slowly rolling HSPC that adheres in close proximity to an already adhering HSPC. After a short adhesion the newly arrived HSPC forms a protrusion that projects through the endothelial layer of the sinusoidal capillary. Within ∼1.5 min the HSPC transmigrates and remains in close proximity to the vessel wall. The perivascular located cell barely migrates, but shows active cell protrusions with the environment including the endothelial lining. SHG signal (blue) indicates bone tissue.
Two-photon intravital imaging of fluorescently labeled BM lineage-depleted HSPC (green) 24 h after intravenous injection. HSPC left the Enmc+ labeled BM sinusoidal capillaries (red) and reside in proximity of to the sinusoids in the BM cavity. The majority of cells hardly migrate (mean migration speed: 63±34 μm/h), but show active protrusions indicating lively cell interactions with the environment. SHG signal (blue) indicates bone tissue.