

Abstract
Objective pulmonary function (PF) evaluation is essential for the diagnosis, monitoring, and management of many pediatric respiratory diseases as seen in the emergency room, intensive care, and outpatient settings. In this paper, the development and testing of a new noninvasive PF instrument, pneuRIPTM, which utilizes respiratory inductance plethysmography (RIP) are discussed. The pneuRIPTM hardware includes a small circuit board that connects to the RIP bands and measures and wirelessly transmits the band inductance data to any designated wirelessly connected tablet. The software provides indices of respiratory work presented instantaneously in a user-friendly graphical user interface on the tablet. The system was tested with ten normal children and compared with an existing system, Respitrace (Sensormedics, Yorba Linda, CA), under normal and loaded breathing conditions. Under normal breathing, the percentage differences between the two systems were 2.9% for labored breathing index (LBI), 31.8% for phase angle (Φ), 4.8% for percentage rib cage (RC%), and 26.7% for respiratory rate (BPM). Under loaded breathing, the percentage differences between the two systems were 1.6% for LBI, 4.1% for Φ, 8.5% for RC%, and 52.7% for BPM. For LBI, Φ, and RC%, the two systems were in general agreement. For BPM the pneuRIPTM is shown to be more accurate than the respitrace when compared to manually counting the breaths: 13.2% versus 36.4% accuracy for normal breathing and 16.9% versus 60.7% accuracy for breathing under load, respectively.
Keywords: respiratory inductance plethysmography (RIP), noninvasive, tablet, pulmonary function
Introduction
Pulmonary complications are the most frequent problems that affect neonates and pediatric patients [1]. Studies show that wheezing occurs in nearly 40% of infants in the first three years of life [2], chronic cough occurs in nearly 13% of two-year-olds [3], viral acute respiratory illnesses occur in nearly 20% of infants in the first year of life [4], and that a very large percentage of all deaths worldwide is due to respiratory disorders [1,5]. Asthma in childhood is associated with considerable morbidity, reduced quality of life, and serious health and economic concern [6,7]. It is the leading cause of hospitalizations in children and represents a significant percentage of pediatric emergency department visits [7]. The management decisions for asthma are largely based on examination results, vital signs, pulse oximetry, and the child's and parents' subjective assessment, which often underestimate the severity of the disease [1,6,8]. Pulmonary function (PF) testing is a vital tool in the diagnosis and management of these pediatric respiratory diseases. Respiratory inductance plethysmography (RIP) and pneumotachography (PT) have been developed to analyze PF and tidal breathing in patients who are minimally cooperative because of their age or disease severity [9–11].
RIP is currently performed using the Respitrace system (Sensormedics, Yorba Linda, CA). Respitrace uses a cart-mounted, wired system that has changed little since 1991 [12]. The software provides limited instantaneous data and graphics that can be used to make clinical decisions. In this system, the inductive signals from bands worn around the rib cage (RC) and the abdomen (ABD) are treated mathematically, and the phase angle (Ø) is calculated between them. Phase angle and other indices define the work of breathing (WOB) parameters. The pattern of the breathing and only a few parameters can be viewed on the monitor during the test; a significant assessment of the study has to be done posthoc, off-line. This off-line analysis is time-consuming, lacks user friendliness, is imprecise, and limits timely clinical evaluation due to late analysis and therefore is ineffective in making treatment decisions. Thus, the RIP, when used with the Respitrace system, is of limited use in the clinic [12–14].
This paper presents the design of pneuRIPTM, which comprises a palm-sized hardware module and an iPad (Apple, Cupertino, CA) software application that computes and displays the WOB parameters instantaneously, right at the point-of-care. The pneuRIPTM system can wirelessly receive RIP data from the patient, display relevant data on the screen instantly, and has the potential to securely e-mail reports and graphics to other locations such as electronic medical records (EMR). This instant display of the respiratory rate in breaths per minute, phase angle, and labored breathing index is crucial for determining the severity of the pulmonary diseases and treatment options.
Methods
We describe the development and testing of a wireless PF analyzer (pneuRIP™) that uses RIP bands to monitor PF (Fig. 1). Variables include the labored breathing index (LBI), phase angle (Φ) between abdomen (ABD) and rib cage (RC), breaths per minute (BPM), and percentage of rib cage input (RC%). These four variables are calculated and displayed immediately on the app screen. Results of testing the system with ten children are presented.
Fig. 1.
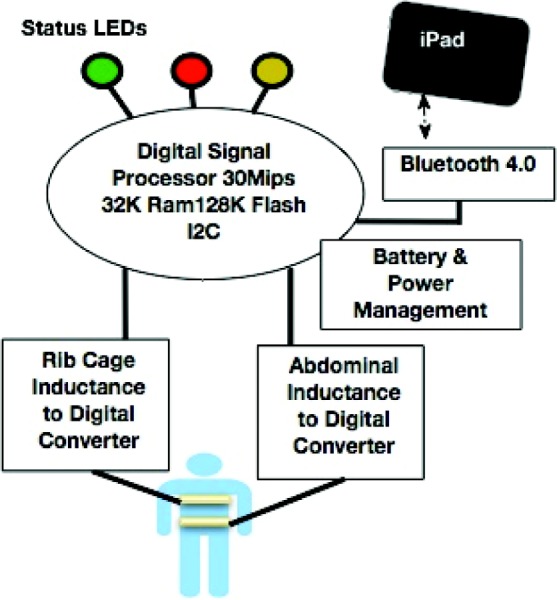
Schematic of pneuRIP™ operation
Hardware Design.
The design includes a circuit board that incorporates direct digitization of the inductance (no calibration) by a low-energy, high-performance embedded processor. It is connected to the RIP bands and collects and sends data on breathing patterns wirelessly to the iPad. The circuit board is mounted inside a plastic enclosure to allow wireless communication while providing protection to the circuitry and the user. The enclosure measures approximately 8 cm × 8 cm × 3 cm. It is made of lightweight acrylonitrile butadiene plastic and is printed on a Fortus (Stratasys, Eden Prairie, MN) 3D printing machine. Small polarized connectors that lock are used to connect the RIP bands to the circuit. The enclosure has clear labeling for each connector and light-emitting diode (LED) indicators advising use (Fig. 2).
Fig. 2.
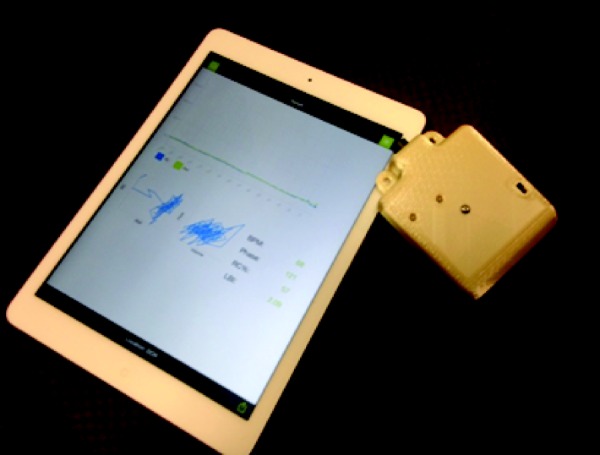
pneuRIP™ box shown with an iPad
The circuit consists of the following features that provide for a very stable, consistent sensor that does not suffer from measurement drift and requires no calibration:
Two analog acquisition channels, inductive–capacitive (LC) circuit, centered around 250 KHz and providing an excitation current of a few milliamps to the bands. The two tuned circuits (one for each band) are carefully separated in frequency to minimize crosstalk. The output from the LC circuit is fed to a low-power digital signal processor (DSP). A self-test circuit, in the form of on-board inductors, provides reliable and dependable operation.
The DSP implements different algorithms to filter the data, remove unwanted artifacts, further process, package the data, and present it to the radio frequency (RF) transmitter circuit. The DSP also takes care of power management and sundry control requirements such as on-board LED indicator used for status, Bluetooth connection, battery level, and proper connection of bands.
A nonvolatile memory stores measured and preprocessed data, so that once a connection is established to the iPad, the preconnection data are already available and transmitted to the iPad.
A self-contained battery (2 AA) powers the circuit and the bands; this lasts for many hours of continuous use and many months of “normal” use. There is no voltage generation and no electrical connection to the patient; therefore, it is inherently safe.
-
A wireless interface Bluetooth 4.0 (BLE) provides a quick connection (pairing) of 6 ms or less and uses low energy for prolonged battery life. It exceeds the bandwidth requirements for real-time data capture and analysis.
Custom-embedded software (firmware) programmed into the DSP performs the following operations:
It samples the signals from the RIP bands at 10 Hz.
It filters the digitized signal using a sequence of finite impulse response filtering algorithms, decimated in time to reduce the sampling rate and to remove extraneous noise.
It encodes the data and packages them before sending to a Bluetooth radio transmitter.
The software stores and keeps samples available in the nonvolatile memory when the Bluetooth is not connected, or in the event of a short transmission interruption, so that upon connection or reconnection, the samples can be transmitted ensuring no valuable data loss.
The firmware also monitors battery usage and is responsible for power management.
Software Design.
An iOS application is designed to connect to the monitor, download the data, compute, display, and share the information. The software continually scans for available devices within 100 feet. Once a device is detected and selected, the user has access to graphs and data updated in real time. The application also allows the user to modify the device name, set a location name, store patient data, and e-mail the data in the form of EDF+, CSV, and SQLite as an attachment. Signal processing to compute these parameters uses a combination of data windowing, finite impulse response filtering (FIR), and fast Fourier transforms (FFT). Judicious use of FFT and weighted averaging also improves the signal-to-noise ratio. The following respiratory indices are calculated and presented on the screen:
-
(1)Phase angle (Φ): The phase angle (Φ) between the rib cage (y) and abdomen (x) values is calculated by normalizing the signals over 20 samples
(1) -
(2)
Respiratory rate (breaths per minute): An FFT algorithm was used to generate the average magnitudes for each frequency of the abdomen and rib cage signal. From these calculations, an array is generated from which the largest value is selected, as well as amplitudes within 20% of this value. Finally, the weighted average is computed using indices of these values. This value is the frequency multiplied by 60 to obtain breaths per minute.
-
(3)Percentage rib cage (RC%): Again, FFT algorithm is used to generate the magnitudes for each frequency of the abdomen and rib cage signal. From this transformation, an array is generated that has a set of indices, and then the index is selected with the largest amplitude of both signals
(2) -
(4)Labored breathing index (LBI): Asynchronous breathing is less efficient than synchronous breathing. The LBI is an indication of the additional WOB when breathing is asynchronous. This estimation is calculated by summing the phase relation between ABD and RC values relative to their sum per unit of time [12]. The FFT of the signals generate the phase-magnitude relationship of the ABD and RC signal relative to the sum. From these calculations, an array is generated that has a set of indices from which we select the index with the largest amplitude
where P and Q are the trough and peak volumes for the ribcage and R and S1 are the trough and peak volumes for the abdomen. The denominator is the tidal volume.(3)
Finally, a summarized report for the entire study is provided (Fig. 3). The results shown in the report are based on the mean of selected breaths over 5–60 min (the study period can be varied). Artifactual breaths associated with movement artifacts and signal noise are filtered from the report information. In addition, means, percentage variance, graphics, and normative historic data are included in the report for comparison.
Fig. 3.
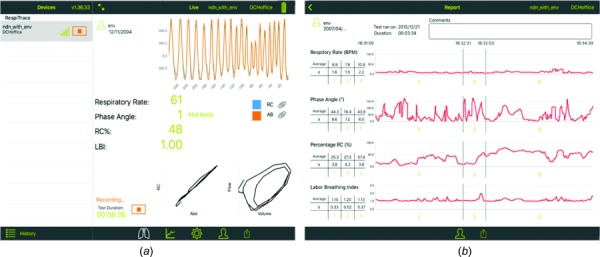
Screen shot of the iPad during data collection (a). Summary screen of the four respiratory indices generated after data collection on the iPad (b). The chart breaks up the data into three temporal segments and presents mean data for each segment of the data collection cycle.
Benchtop Testing.
Benchtop experiments were conducted to determine the reliability, sensitivity, and reproducibility of the circuitry and instrument design. This involved mounting the RIP bands on a laboratory-grade rocker/waver platform (Fig. 4). The tilt angles and speed were varied to simulate different breathing conditions. The test was conducted continuously over two days.
Fig. 4.
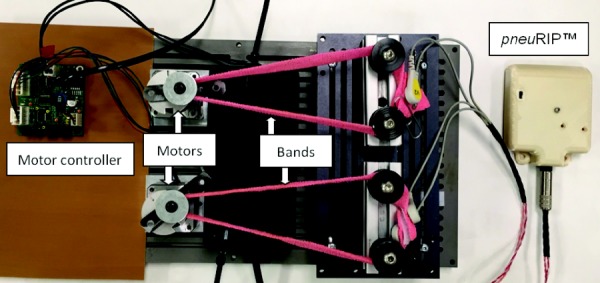
Benchtop test-bed that simulates calibrated breathing patterns. Motors show eccentric spools mounted on top to simulate breathing by changing length of bands.
Subject Testing.
After institutional review board (IRB) approval and consent, ten typically developing subjects (10–17 yr) were tested under normal breathing conditions and with an added resistive load. Testing was conducted to demonstrate (a) how the breathing indices of the new system compare with those of the existing respitrace system and (b) if the new system accurately differentiates between breathing under load and normal breathing conditions. Subjects were seated comfortably in a chair, and the bands were placed around them. The pneuRIP™ monitor was activated and they were asked to breathe normally for 3 min. The test was repeated while breathing under load. The load was an external bidirectional laminar resistive load (Hans Rudolph, Shawnee, KS) 20 cm H2O per liters per second provided to each subject, which was placed in the mouth. This was similar to breathing through a straw. Both conditions were repeated using the Respitrace system. The following variables were calculated: phase angle between RC and ABD, LBI, RC%, and BPM. The order of testing was randomized, and subjects were given about 5 min between tests so that breathing was normalized.
Results
Benchtop Testing.
Results for both the systems (pneuRIP™ and Respitrace) are in agreement at normal breathing frequencies and phase angles (Table 1). At low and high phase angles, and low and high breathing frequencies, pneuRIP™ displayed a much lower variance for the phase angle. Since mechanically there was negligible variation, pneuRIP™ is more accurate and consistent at higher and lower phase angles. Large phase angles are often found in children exhibiting respiratory distress, the symptoms pneuRIP™ is designed to measure.
Table 1.
Results of benchtop testing performed in the laboratory with both systems (pneuRIP™ and Respitrace) connected in turn to two motors that moved out of phase and at different speeds. Each band is connected to one motor. Both the pneuRIP™ and respitrace are compared with the reference signals provided by the motors. RC% = percentage rib cage, BPM = respiratory rate, breaths per minute; and LBI = labored breathing index.
|
Reference |
pneuRIP |
Respitrace |
pneuRIP |
Respitrace |
pneuRIP |
Respitrace |
pneuRIP |
Respitrace |
|||||||||
|---|---|---|---|---|---|---|---|---|---|---|---|---|---|---|---|---|---|
| Phase | BPM | Phase | Variance | phase | Variance | RC% | Variance | RC% | Variance | BPM | Variance | BPM | Variance | LBI | Variance | LBI | Variance |
| 0 | 15 | 2 | 0.18 | 3 | 0.42 | 53 | 0.00 | 55 | 0.00 | 15 | 0.00 | 15 | 0.00 | 1.00 | 0.00 | 1.00 | 0.00 |
| 0 | 25 | 2 | 0.13 | 2 | 1.63 | 53 | 0.00 | 41 | 0.00 | 25 | 0.00 | 25 | 0.12 | 1.00 | 0.00 | 1.00 | 0.00 |
| 0 | 50 | 2 | 0.18 | 3 | 5.72 | 53 | 0.00 | 41 | 0.00 | 50 | 0.00 | 50 | 0.10 | 1.00 | 0.00 | 1.00 | 0.00 |
| 0 | 80 | 1 | 0.22 | 4 | 7.96 | 53 | 0.12 | 41 | 0.25 | 80 | 0.00 | 80 | 0.95 | 1.00 | 0.00 | 1.00 | 0.00 |
| 0 | 120 | 0 | 0.49 | 7 | 26.59 | 54 | 0.20 | 42 | 0.29 | 120 | 0.00 | 120 | 2.63 | 1.00 | 0.00 | 1.00 | 0.00 |
| 5 | 15 | 3 | 0.21 | 1 | 33.70 | 51 | 0.00 | 54 | 0.00 | 15 | 0.00 | 15 | 1.08 | 1.00 | 0.00 | 1.00 | 0.00 |
| 5 | 25 | 3 | 0.09 | 1 | 0.81 | 51 | 0.00 | 54 | 0.00 | 25 | 0.00 | 25 | 0.06 | 1.00 | 0.00 | 1.00 | 0.00 |
| 5 | 50 | 2 | 0.22 | 2 | 3.64 | 51 | 0.00 | 54 | 0.00 | 50 | 0.00 | 50 | 0.10 | 1.00 | 0.00 | 1.00 | 0.00 |
| 5 | 80 | 2 | 0.39 | 4 | 8.61 | 51 | 0.15 | 54 | 0.02 | 80 | 0.00 | 80 | 0.96 | 1.00 | 0.00 | 1.00 | 0.00 |
| 5 | 120 | 2 | 0.85 | 6 | 19.68 | 51 | 0.17 | 54 | 0.10 | 120 | 0.00 | 120 | 2.60 | 1.00 | 0.00 | 1.00 | 0.00 |
| 15 | 15 | 16 | 0.00 | 15 | 1.05 | 52 | 0.00 | 54 | 0.04 | 15 | 0.00 | 15 | 0.04 | 1.01 | 0.00 | 1.00 | 0.00 |
| 15 | 25 | 16 | 0.43 | 15 | 1.34 | 52 | 0.00 | 54 | 0.00 | 25 | 0.00 | 25 | 0.01 | 1.01 | 0.00 | 1.00 | 0.00 |
| 15 | 50 | 16 | 0.19 | 15 | 6.38 | 52 | 0.07 | 54 | 0.15 | 50 | 0.00 | 50 | 0.10 | 1.01 | 0.00 | 1.00 | 0.00 |
| 15 | 80 | 15 | 0.38 | 16 | 19.79 | 52 | 0.03 | 55 | 0.22 | 80 | 0.00 | 80 | 0.97 | 1.01 | 0.00 | 1.00 | 0.00 |
| 15 | 120 | 15 | 0.79 | 15 | 50.07 | 52 | 0.00 | 55 | 0.17 | 120 | 0.02 | 120 | 2.66 | 1.01 | 0.00 | 1.00 | 0.00 |
| 30 | 15 | 34 | 0.00 | 31 | 0.88 | 51 | 0.00 | 54 | 0.25 | 15 | 0.00 | 15 | 0.00 | 1.05 | 0.00 | 1.00 | 0.00 |
| 30 | 25 | 34 | 0.23 | 31 | 1.55 | 51 | 0.09 | 55 | 0.24 | 25 | 0.00 | 25 | 0.01 | 1.05 | 0.00 | 1.00 | 0.00 |
| 30 | 50 | 33 | 0.10 | 31 | 6.01 | 51 | 0.07 | 55 | 0.30 | 50 | 0.00 | 50 | 0.10 | 1.04 | 0.00 | 1.00 | 0.00 |
| 30 | 80 | 33 | 0.10 | 32 | 23.04 | 51 | 0.21 | 56 | 0.32 | 80 | 0.00 | 80 | 0.96 | 1.04 | 0.00 | 1.00 | 0.00 |
| 30 | 120 | 32 | 0.54 | 31 | 50.87 | 52 | 0.15 | 56 | 0.62 | 120 | 0.00 | 120 | 2.69 | 1.04 | 0.00 | 1.00 | 0.00 |
| 60 | 15 | 59 | 0.00 | 60 | 0.40 | 52 | 0.00 | 56 | 4.06 | 15 | 0.00 | 15 | 0.11 | 1.15 | 0.00 | 1.10 | 0.00 |
| 60 | 25 | 59 | 0.13 | 60 | 1.63 | 51 | 0.12 | 56 | 1.28 | 25 | 0.00 | 25 | 0.10 | 1.15 | 0.00 | 1.10 | 0.00 |
| 60 | 50 | 58 | 0.34 | 60 | 6.03 | 52 | 0.10 | 57 | 0.87 | 50 | 0.00 | 50 | 0.10 | 1.15 | 0.00 | 1.10 | 0.00 |
| 60 | 80 | 58 | 0.21 | 61 | 18.38 | 52 | 0.00 | 58 | 1.00 | 80 | 0.00 | 80 | 0.96 | 1.14 | 0.00 | 1.10 | 0.00 |
| 60 | 120 | 57 | 0.69 | 59 | 39.85 | 52 | 0.18 | 59 | 2.04 | 120 | 0.00 | 120 | 2.67 | 1.14 | 0.00 | 1.10 | 0.00 |
Subject Testing.
The mean scores and standard deviations for the various conditions are presented in Fig. 5. The scores are averaged for all the subjects. Figure 5(a) shows the phase angle difference between the pneuRIP™ and Respitrace for the normal and loaded conditions. Under normal breathing, the percentage differences between the two systems were 2.9% for LBI, 31.8% for Φ, 4.8% for RC%, and 26.7% for BPM. Under loaded breathing, the percentage differences between the two systems were 1.6% for LBI, 4.1% for Φ, 8.5% for RC%, and 52.7% for BPM. For LBI, Φ, and RC%, the two systems were in general agreement. Results show that there is a significant (P < 0.01) phase lag between the chest and abdomen in the loaded condition (mean ± SD, 55.4 deg ± 11.8 deg, pneuRIP™, and 53.3 deg ± 8.7 deg, Respitrace). Also interestingly for the phase angle, there is a larger variation in the loaded condition as seen by the differences in standard deviation. Figure 5(b) is a comparison of the labored breathing index (LBI) and shows an equivalent increase in LBI in the loaded conditions for both systems. Figure 5(c) shows that there is no statistical difference for the two systems for RC%, which is expected. Figure 5(d) shows both systems and also shows the number of breaths counted manually from the raw data generated by the pneuRIP™ system (the BPM could not be calculated manually from the respitrace system as the raw data are not available). For BPM, the pneuRIPTM is shown to be more accurate than respitrace when compared to manually counting the breaths: 13.2% versus 36.4% for normal breathing and 16.9% versus 60.7% for breathing under load, respectively [Fig. 5(d)].
Fig. 5.
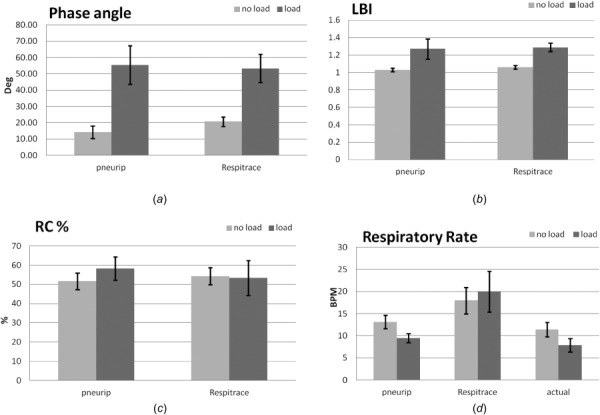
Summarized results comparing Respitrace and the pneuRIP™ system in subjects with and without respiratory load: (a) phase angle (degrees), (b) labored breathing index (LBI), (c) RC% contribution to tidal volume, and (d) respiratory rate (BPM). Note: the histograph for actual respiratory rate is measured by manual counting of breaths throughout each individual study from data generated by the pneuRIP™ system. P < 0.01 for load versus no load. Bars are shown with standard deviations.
Discussion
Pulmonary function (PF) testing and WOB indices are vital tools in the diagnosis of many pediatric respiratory diseases, as well as guiding pulmonary therapy [1,5,9–11]. These tests and indices are currently available only for patients on ventilators. However, with the recent trend in more noninvasive respiratory support, such as nasal continuous positive airway pressure (nCPAP) and high-flow therapy, in the intensive care unit [15], other hospital settings (outpatient clinic, emergency department, and postoperative follow-up), and home care, there is an unmet need for point-of-care (portable), noninvasive, instantaneous PF assessment in the neonatal/pediatric population. The noninvasive diagnostic instrumentation described here is not disease specific but will provide insight into the diagnosis of numerous respiratory disorders in keeping with the current trend in noninvasive respiratory support [15]. The pneuRIP™ approach provides useful diagnostic information similar to more invasive PF approaches but without the invasive and demanding requirements of PF diagnostic measurements (esophageal balloon or catheter placement, endotracheal tube placement, pneumotachography, and pressure transducer calibration).
As shown herein, it was possible to demonstrate normal PF [12] as well as increased WOB indices with loading instantaneously. As such, the pneuRIP™ noninvasive device may be useful in multiple settings, which include intensive care units, outpatient clinics, emergency departments, postoperative follow-up, and home care.
The pneuRIP™ samples the data and generates the four indices differently from the Respitrace system. Respitrace has a proprietary algorithm to determine the number of breaths analyzed. The data are then postprocessed to determine the indices. As can be seen from Fig. 5(d), the results are not always in agreement.
The pneuRIP™ has not been tested with patients yet; however, we have simulated labored breathing conditions by using resistive loads for the subjects to breathe through. This approach is a common practice in calibration of pulmonary diagnostic instrumentation used for research [16]. The software developed by the team could be offered as an app in the App Store, and newer versions of the software are automatically made available.
Conclusions
This paper details the development of a novel noninvasive respiratory system, pneuRIP™, which provides instantaneous measures of breathing indices on an iPad. This approach provides the data necessary for clinicians to diagnose and decide the severity of the disease and begin respective treatments. Further, the patient's breathing record, including WOB parameters, can be e-mailed to patient medical records. This software/hardware system is a significant improvement from the current RIP system, which provides data that are neither instantaneous nor direct and needs further analysis to derive the WOB indices. This existing system has limited usefulness in the clinic. Experiments in the laboratory and testing in subjects indicate the pneuRIP™ is as accurate as the existing system in three of the four indices and more accurate in the breathing rate.
Acknowledgment
Nemours Department of Biomedical Research, Creative Micro Designs (CMD), NIH COBRE P30GM114737.
Contributor Information
Tariq Rahman, Department of Biomedical Research and , Center for Pediatric Lung Research, , Nemours Biomedical Research, , Nemours/Alfred I. duPont Hospital for Children, , 1600 Rockland Road, PO Box 269, , Wilmington, DE 19803 , e-mail: trahman@nemours.org.
Ralph Page, Creative Micro Designs, Inc., , Newark, DE 19713 , e-mail: rp@cmdfab.com.
Christopher Page, Creative Micro Designs, Inc., , Newark, DE 19713 , e-mail: cp@cmdfab.com.
Jean-Remy Bonnefoy, Creative Micro Designs, Inc., , Newark, DE 19713 , e-mail: jb@cmdfab.com.
Tim Cox, Department of Biomedical Research and , Center for Pediatric Lung Research, , Nemours/Alfred I. duPont Hospital for Children, , 1600 Rockland Road, , Wilmington, DE 19803 , e-mail: tcox@nemours.org.
Thomas H. Shaffer, Department of Biomedical Research and , Center for Pediatric Lung Research, , Nemours/Alfred I. duPont Hospital for Children, , 1600 Rockland Road, , Wilmington, DE 19803 , e-mail: tshaffer@nemours.org
References
- [1]. Jacobus, C. , 2010, “ Noninvasive Monitoring,” Neonatal and Pediatric Respiratory Care, Walsh B. K., Czervinske M. P., and DiBlasi R. M., eds., Saunders Elsevier, St. Louis, MO, pp. 137–146. [Google Scholar]
- [2]. Martinez, F. D. , Wright, A. L. , Taussig, L. M. , Holberg, C. J. , Halonen, M. , and Morgan, W. J. , 1995, “ Asthma and Wheezing in the First Six Years of Life. The Group Health Medical Associates,” N. Engl. J. Med., 332(3), pp. 133–138. 10.1056/NEJM199501193320301 [DOI] [PubMed] [Google Scholar]
- [3]. Taussig, L. M. , and Helms, P. J. , 1996, “ Introduction,” Infant Respiratory Function Testing, Wiley-Liss, New York, pp. 1–18. [Google Scholar]
- [4]. Wright, A. L. , Taussig, L. M. , Ray, C. G. , Harrison, H. R. , and Holberg, C. J. , 1989, “ The Tucson Children's Respiratory Study—II: Lower Respiratory Tract Illness in the First Year of Life,” Am. J. Epidemiol., 129(6), pp. 1232–1246. 10.1155/2012/724139 [DOI] [PubMed] [Google Scholar]
- [5]. Fox, W. W. , and Shaffer, T. H. , 1982, “ Assessment of Pulmonary Function,” Beheman's Neonatal-Perinatal Medicine, Fanaroff A., and Martin R., eds., C.V. Mosby Co., St. Louis, MO, pp. 159–164. [Google Scholar]
- [6]. Schatz, M. , Rachelefsky, G. , and Krishnan, J. A. , “ Follow-Up After Acute Asthma Episodes: What Improves Future Outcomes?,” Proc. Am. Thorac. Soc., 6(4), pp. 386–393. 10.1513/pats.P09ST6 [DOI] [PubMed] [Google Scholar]
- [7]. Camargo, C. A., Jr. , Rachelefsky, G. , and Schatz, M. , 2009, “ Managing Asthma Exacerbations in the Emergency Department: Summary of the National Asthma Education and Prevention Program Expert Panel Report 3 Guidelines for the Management of Asthma Exacerbations,” Proc. Am. Thorac. Soc., 6(4), pp. 357–366. 10.1513/pats.P09ST2 [DOI] [PubMed] [Google Scholar]
- [8]. Basek, P. , Straub, D. , and Wildhaber, J. H. , 2005, “ Childhood Asthma and Wheezing Disorders,” Paediatric Pulmonary Function Testing (Progress in Respiratory Research Series), Hammer J., and Eber E., eds., Vol. 33, Karger, Basel, Switzerland, pp. 204–214. 10.1159/000083575 [DOI] [Google Scholar]
- [9]. Giordano, K. , Rodriguez, E. , Green, N. , Armani, M. , Richards, J. , Shaffer, T. H. , and Attia, M. W. , 2012, “ Pulmonary Function Tests in Emergency Department Pediatric Patients With Acute Wheezing/Asthma Exacerbation,” Pulm. Med., 129(6), p. 724139. 10.1155/2012/724139 [DOI] [PMC free article] [PubMed] [Google Scholar]
- [10]. Caro, C. G. , Butler, J. , and Dubois, A. B. , 1960, “ Some Effects of Restriction of Chest Cage Expansion on Pulmonary Function in Man: An Experimental Study,” J. Clin. Invest., 39(4), pp. 573–583. 10.1172/JCI104070 [DOI] [PMC free article] [PubMed] [Google Scholar]
- [11]. Bhatia, R. , Shaffer, T. H. , Hossain, J. , Fisher, A. O. , Horner, L. M. , Rodriguez, M. E. , Penfil, S. , and Theroux, M. C. , 2011, “ Surfactant Administration Prior to One Lung Ventilation: Physiological and Inflammatory Correlates in a Piglet Model,” Pediatr. Pulmonol., 46(11), pp. 1069–1078. 10.1002/ppul.21485 [DOI] [PMC free article] [PubMed] [Google Scholar]
- [12]. Allen, J. L. , Greenspan, J. S. , Deoras, K. S. , Keklikian, E. , Wolfson, M. R. , and Shaffer, T. H. , 1991, “ Interaction Between Chest Wall Motion and Lung Mechanics in Normal Infants and Infants With Bronchopulmonary Dysplasia,” Pediatr. Pulmonol., 11(1), pp. 37–43. 10.1002/ppul.1950110107 [DOI] [PubMed] [Google Scholar]
- [13]. de Jongh, B. E. , Locke, R. , Mackley, A. , Emberger, J. , Bostick, D. , Stefano, J. , Rodriguez, E. , and Shaffer, T. H. , 2014, “ Work of Breathing Indices in Infants With Respiratory Insufficiency Receiving High Flow Nasal Cannula and Nasal Continuous Positive Airway Pressure,” J. Perinatol., 34(1), pp. 27–32. 10.1038/jp.2013.120 [DOI] [PMC free article] [PubMed] [Google Scholar]
- [14]. Warren, R. H. , Horan, S. M. , and Robertson, P. K. , 1997, “ Chest Wall Motion in Preterm Infants Using Respiratory Inductive Plethysmography,” Eur. Respir. J., 10(10), pp. 2295–2300. 10.1183/09031936.97.10102295 [DOI] [PubMed] [Google Scholar]
- [15]. Shaffer, T. H. , Alapati, D. , Greenspan, J. S. , and Wolfson, M. R. , 2012, “ Neonatal Non-Invasive Respiratory Support: Physiological Implications,” Pediatr. Pulmonol., 47(9), pp. 837–847. 10.1002/ppul.22610 [DOI] [PMC free article] [PubMed] [Google Scholar]
- [16]. Comroe, J. H. , 1977, Physiology of Respiration, Year Book Medical, Chicago, IL. [Google Scholar]