Abstract
Bamboo is a ubiquitous monocotyledonous flowering plant and is a member of the true grass family Poaceae. In many parts of the world, it is widely used as a structural material especially in scaffolding and buildings. In spite of its wide use, there is no accepted methodology for standardizing a species of bamboo for a particular structural purpose. The task of developing structure–property correlations is complicated by the fact that bamboo is a hierarchical material whose structure at the nanoscopic level is not very well explored. However, we show that as far as stiffness is concerned, it is possible to obtain reliable estimates of important structural properties like the axial modulus from the knowledge of certain key elements of the microstructure. Stiffness of bamboo depends most sensitively on the size and arrangement of the fibre sheaths surrounding the vascular bundles and the arrangement of crystalline cellulose microfibrils in their secondary cell walls. For the species of bamboo studied in this work, we have quantitatively determined the radial gradation that the arrangement of fibres renders to the structure. The arrangement of the fibres gives bamboo a radially graded property variation across its cross section.
Keywords: bamboo, multiscale modelling, functionally graded material
1. Introduction
Bamboo, a member of the true grass family Poaceae, is a ubiquitous monocotyledonous flowering plant, of which there are over 75 genera and 1250 species [1]. Out of about 130 species of wild and cultivated bamboo occurring in India, 13 belonging to seven genera have been recommended by the National Bamboo Mission for use in various traditional and industrial applications (http://nbm.nic.in/Achievement/Handbook%20on%20Bamboo.pdf). A major use of some of these species is in construction and scaffolding. In fact, Bhalla et al. [2] have demonstrated that modern structural engineering principles can be used to design robust structures (e.g. a large shed adhering to established design norms for steel and concrete structures) with bamboo as the major structural element.
In their design, Bhalla et al. [2] have assumed that bamboo (in particular, the species Dendrocalamus giganteus) has a Young's modulus of , and tensile and compressive yield strengths of 120 and , respectively. While these values are impressive for a structural material (especially given that the density is about which results in a significantly higher strength to weight ratio compared with, say, steel; see also [3] for detailed comparisons), structure–property correlations for various species of bamboo are not very well developed. With a view to determine the mechanical stiffness and strength of bamboo, the recent works by Habibi et al. [4] and Dixon & Gibson [5] are noteworthy. For specific species of bamboo (Phyllostachys edulis in the former and Phyllostachys pubescens or Moso bamboo in the latter), the stiffness has been obtained quantitatively with due consideration to the distinctive microstructure of bamboo. In particular, as will also be seen from our results, the distribution of the vascular bundles and the fibre bundles around them, play an important role in determining the stiffness. Habibi et al. [4] also determine the fracture properties. Comparison between the overall stiffness from flexural tests on a number of different bamboo species has recently been done by Dixon et al. [6].
Detailed tests to determine mechanical properties of bamboo stem, which is known as culm, have been reported [7, 8]. Armandei et al. [9] have used frequency spectrum analysis on bamboo slices in bending mode to study the variation of its modulus of elasticity. However, the essential features of the bamboo microstructure that contribute to and determine its stiffness have not been clearly identified.
In this paper, we address this issue and attempt to identify the most important microstructural attributes that determine the mechanical stiffness of a bamboo culm, particularly in the axial direction. Although Liese [1] mentions that, compared to the large structural heterogeneity of the 20 000 timber species, the variations among the species of bamboo appear small, we believe that this work will help in identifying the species most suited to a particular structural need.
We show that in order to obtain a reliable estimate of the axial mechanical properties of a particular species of bamboo, knowledge of a small set of key parameters is sufficient. These include the areal distribution of fibres, average orientation angle of the cellulose microfibrils in the secondary cell walls of fibres and size distribution of the fibres. Apparent sweeping simplifications like ignoring the amorphous nature of a part of the cellulose, assuming approximate values of the stiffness of the amorphous non-cellulosic polysaccharides in the microfibrils, size distribution of the parenchyma cells, etc., do not seem to affect the stiffness estimate significantly.
2. Bamboo: a multiscale, hierarchical graded composite
2.1. Overall structure of bamboo culm
The bamboo culm is approximately cylindrical, thick walled shell (the cavity is called lacuna) with periodic transverse partitions called septa (figure 1a), whose purpose seems to be to prevent ovalization of the cross section during bending, thereby preventing Brazier buckling [10]. The cross section of culm, shown in figure 1b, has non-uniformly distributed vascular bundles, with higher areal concentration being close to the outer wall. As in the optical micrograph shown in figure 1c, the vascular bundles are easily distinguished by their dark sclerenchymatous cells against the lighter ground parenchyma. The vascular bundles are generally composed of two metaxylem vessels, phloem, protoxylem attached fibre sheaths and fibre bundles [1].
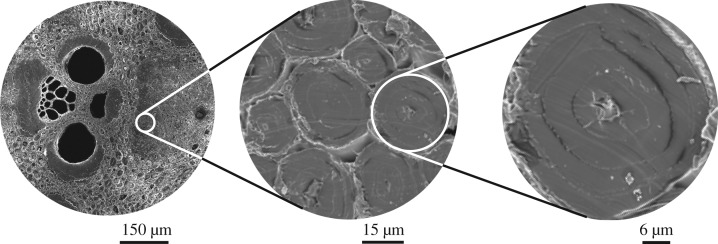
Figure 1.
Hierarchical microstructure of bamboo.
Appearance of the vascular bundles in a transverse section of bamboo varies between species. Grosser & Liese [11, 12] have identified four different types of vascular bundles in bamboo, distinguished by the number of vascular strands and the arrangement of supporting sclerenchyma cells. Although the type varies between basal and middle parts, as well as within a cross section, the species of bamboo studied here consists primarily of type IV vascular bundles. A typical example of a vascular bundle is shown in figure 1b. The vascular bundle contains the phloem with small, thin-walled sieve tubes and the metaxylem vessels.
From the point of view of stiffness, the most important elements of the vascular bundle are the fibres [13, 14], which form around of the sclerenchymatous tissue volume in the culm. Dark areas in figure 1b are fibre bundles that surround the conducting elements forming strengthening sheaths. These fibre bundles are composed of close-packed individual fibres (figure 2). Typical length scales of the various elements in the vascular bundle have been shown in figures 1 and 2.
Figure 2.
Hierarchical structure of a bamboo fibre.
As mentioned earlier, the structure and density of the vascular bundles change continuously from the inner edge to the periphery. Nearer to the periphery the bundles are smaller and denser. The structure of the fibres differs among the sheaths and from the inner edge to the periphery. Micrographs, showing the distributions of fibre bundles at the inner edge, mid-thickness and the periphery, are shown in figure 3. It should be noted that the fibres have an aspect ratio of 70–150.
Figure 3.
Cross-sectional micrographs show the gradation in the areal density of fibres in (a) inner, (b) middle and (c) outer parts of the cross section.
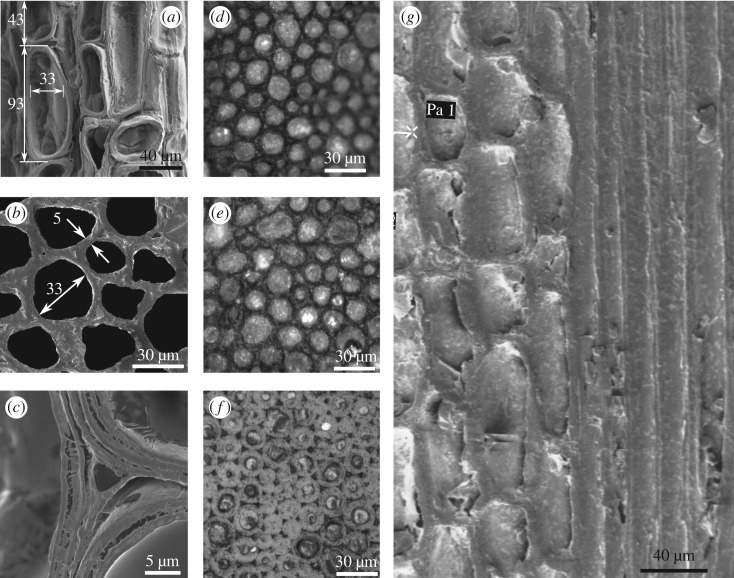
The ground tissue surrounding the vascular bundles is made up of parenchyma, whose percentage varies considerably within the cross section from almost at the inner edge to only at the periphery. Typical dimensions of the key features of these cells shown in figure 4 make it clear that the ground tissue resembles a soft open-cell foam with the vascular bundles, particularly the fibre sheaths, acting as reinforcements. Thus, bamboo is an apt example of a transversely isotropic, functionally graded composite material.
Figure 4.
(a) Longitudinal and (b) cross-sectional micrographs show typical dimensions of parenchyma cells, cell walls in the species Dendrocalamus strictus. The wall layers are clearly seen in (c). Images in (d–f) show the fibre sizes at inner, middle and outer locations, respectively. Longitudinal section in (g) has parenchyma with the embedded fibres resemble the arrangement of high aspect ratio hard phase in a soft matrix seen in many biological materials [15].
We note in passing that the longitudinal section shown in figure 4a,g showing the equiaxed parenchyma cells and the long fibres running through illustrates an important point about the microstructure of bamboo internodes. At the most elementary structural level, the microstructure is similar to the generic microstructure of biocomposites such as nacre and collagen [15, 16] and abalone nacre-inspired multilayered materials [17]. The generic microstructure consists of staggered stiffer elements (fibres in the case of bamboo, mineral platelets in collagen and many other bioinspired brick and mortar composites) with large aspect ratios in a soft matrix. It has been suggested [15] that the high stiffness of the structure is achieved by the high aspect ratio of the fibres while the soft parenchymatous matrix helps in load transfer between the fibres through shear. In another study on bioinspired brick and mortar composites, Wilbrink et al. [18] have provided scaling relationships between constituent properties and the uniaxial tensile response of synthetic brick and mortar composite materials inspired by nacre. All these models are helpful to understand the toughening mechanisms in many natural biocomposites like bamboo.
2.2. Finer structure of bamboo fibres
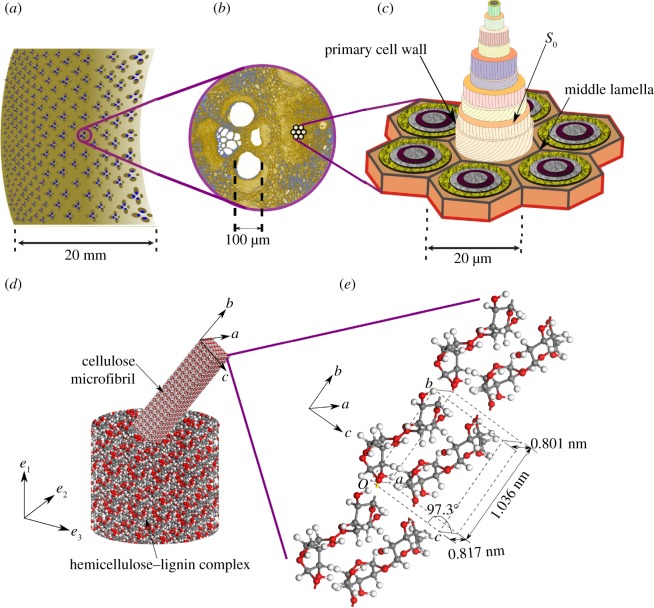
As noted earlier, the remarkable mechanical properties of bamboo are attributed to the closely packed fibres constituting the sheaths in the vascular bundles. At the microscopic level, detailed investigations by e.g. Tono & Ono [19] and Parameswaran & Liese [20] have shown that the walls of the fibres are composed of a large number of alternate thin and thick layers. The number of layers varies during the life of the plant [21] but mature fibres generally have 8–10 lamellae. Each layer has cellulose microfibrils oriented at various angles to the fibre axis surrounded by matrix of hemicellulose and lignin [22, 23]. The structure of the multilamellar secondary cell wall of a fibre has been presented by Parameswaran & Liese [24]. The structure is shown in figure 5. Starting from the middle lamella, the primary cell wall and a transition layer , the microfibril angles alternate between values close to in the thick lamella and in the thin ones.
Figure 5.
Anenlarged view of typical vascular bundle from a typical cross section in (a) is shown in (b). Orientation of cellulose microfibrils to the axial direction (according to Parameswaran & Liese [24]) in different lamellae of a fibre cell is shown in (c). An individual lamella in (c) is, in turn, a composite of largely single crystalline cellulose microfibrils in a lignin–hemicellulose complex (d). The reinforcing microfibrils are composed of cellulose chains with unit cell and orientation indicated in (e).
Like other biological materials such as wood, bone, nacre and deep-sea sponges, the hierarchical structure of bamboo extends all the way down to the nanoscale. However, our understanding of the detailed nanoscale structure of bamboo is incomplete. It is known that the major constituent of the lamella is cellulose formed by assembling glucose molecules into microfibrils that have either rectangular or hexagonal cross sections with approximate diameter of 3– [22]. If the hydrogen bonds between the hydroxyl groups in cellulose form in a particular order, crystalline regions result,1 while random hydrogen bonds lead to amorphous regions.
Recent molecular simulations have thrown some light on the structure of lignin and non-cellulosic polysaccharide complex surrounding the cellulose microfibrils and the mechanisms by which they bind to each other. The task is complicated by the fact that the phenolic macromolecule lignin has a large number of possible structures as it is naturally synthesized from the sub-units p-hydroxyphenyl, guaiacyl and syringyl following a large number of possible pathways [25]. The non-cellulosic polysaccharides or hemicelluloses act as storehouses of metabolizable energy and have also been shown to be involved in growth regulation and in signalling pathways associated with loss of cell wall integrity [26]. Habibi et al. [27] have also done steered molecular dynamics (MD) simulations of the cellulose surrounded by the hemicellulose–lignin complex in bamboo in an effort to better understand its viscoelastic properties.
Monoclonal antibodies coupled with fluorescent moieties, directed against cell wall polysaccharides, can specifically recognize epitopes that form small regions of the polysaccharide molecule. Thin sections of bamboo (about 1 μm in thickness), fixed and treated with a suitable antibody [28], when examined under a fluorescence microscope yield valuable information on the presence or absence of a particular polysaccharide.
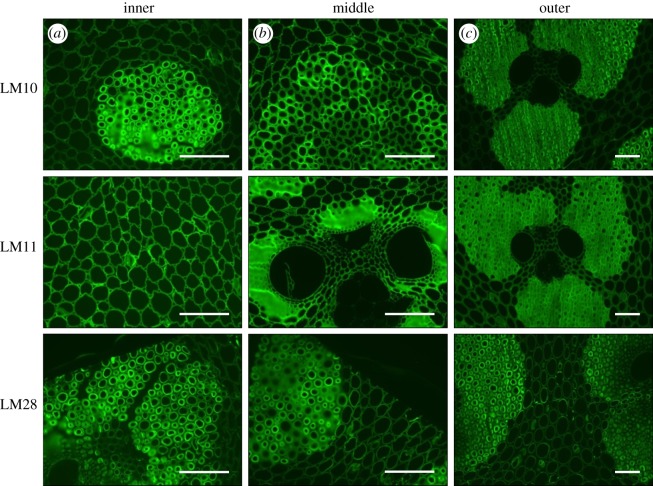
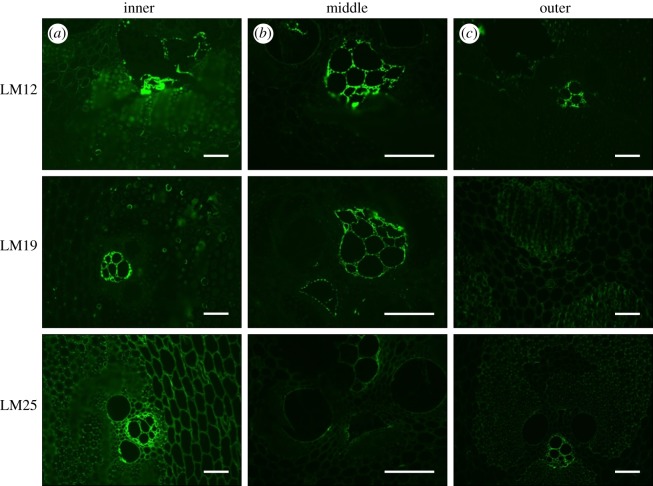
Figure 6a–c shows immunofluorescence images of transverse sections of bamboo labelled with antibodies to LM10 and LM11 xylan epitopes [29] and LM28 to a glucuronoxylan epitope [30]. Note that xylans are a group of hemicelluloses that are abundantly found in plant cell walls. All three antibodies detect xylan in inner, middle and outer parts, respectively, and show strong binding to cell walls of fibre cells. This indicates that the fibres have an abundance of different forms of xylans. On the other hand, probe molecules LM12, LM19 and LM25 [31] which are antibodies to feruloylated xylan, pectic homogalacturonan and xyloglucan, respectively, could detect these molecules close to the phloem walls only as shown in figure 7a–c.
Figure 6.
Immunofluorescence images of culm transverse sections labelled with xylan monoclonal antibodies LM10, LM11 and LM28 show strong detection of xylan in secondary cell walls of parenchyma and fibres. Scale bar, 100 μm.
Figure 7.
Immunofluorescence images of culm transverse sections labelled with xylan monoclonal antibodies LM12, LM19 and LM25 show detection of xylan close to the phloem walls only. Scale bar, .
As far as the fibres are concerned, these experiments seem to reveal an almost complete picture of the secondary cell wall structure. The thick secondary cell walls are lamellar with cellulose microfibrils oriented at alternately low and high angles to the axis. The cellulose microfibrils are surrounded by the lignin–hemicellulose complex in which the lignin molecules are cross-linked by xylan, arabinoxylan and glucuronoxylan. A schematic summarizing the structure of the fibre cell wall is included in figure 5.
It is believed that the axis of the cellulose unit cell (shown in figure 5) is oriented along the axis of the microfibrils [32, 33]. In X-ray diffraction (XRD), the strongest reflection comes from planes for . We also determined the crystallinity index (CI) or degree of crystallinity of cellulose in bamboo fibres to be approximately empirically as CI , where is the height of the peak at , which represents both crystalline and amorphous cellulose; and is the height of the minimum at , which represents the amorphous cellulose [34].
Binding between both crystalline and amorphous cellulose and the lignin–hemicellulose complex in bamboo fibre cell wall has recently been studied through MD simulations [22]. The simulations show that, owing to a higher van der Waals interaction, compared with any of the hemicelluloses, lignin adheres strongly to crystalline cellulose. However, the weakest links in the cellulose–lignin–hemicellulose network that makes up the secondary cell walls of the fibres are the interfaces between amorphous cellulose and the lignin–hemicellulose complex.
3. Experimental details, materials and methods
A bamboo culm of local variety (species Dendrocalamus strictus) was obtained from the botanical nursery, IIT Kanpur and aged in the open for eight weeks for natural seasoning. The sixth internode from bottom end of the culm (outer diameter , inner diameter and length ) was selected for all experimental studies reported herein.
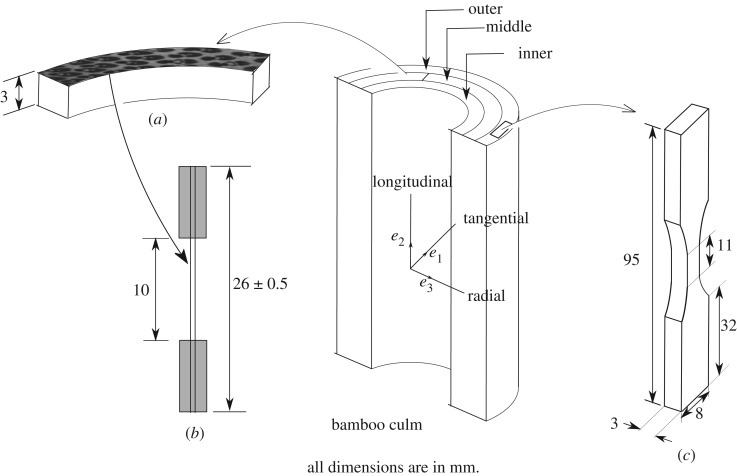
Basically, three kinds of samples were prepared from the internode. The cross section of the internode was divided approximately into three regions: inner, middle and outer. Semi-circular transverse slices of thickness were made from each region and polished with alumina for further use as shown in figure 8a. These were used mainly for electron microscopic studies.
Figure 8.
A bamboo culm shows the different test samples that are extracted from it.
As shown in figure 8b, following ASTM recommendations [35], tensile specimens were prepared with the length in the longitudinal direction and properties along the thickness representing those of the inner, middle and outer regions of the transverse cross section.
The third set of specimens (shown in figure 8c) was prepared to test the mechanical stiffness of the sclerenchymatous fibres. To this end, the semicircular slices were immersed in 10% NaOH solution for 24 h at room temperature to weaken the bonding between fibre bundles and the parenchymatous cells. It has been shown [8] that alkali treatment degrades the properties of the fibres and the concentration of the NaOH solution and the soaking time needs to be carefully adjusted, so that the matrix only is dissolved. Once the slices are taken out from NaOH solution and washed thoroughly with deionized water, the fibre bundles can be separated easily under a microscope. The extracted bundles were air-dried for 24 h and then cut into pieces in length, for testing in a microtensile set-up. The ends of dried bundles were bonded with epoxy resin to a frame made up of a hard paper.
Tension tests have been conducted on either a universal testing machine fitted with a load cell or, in cases where the anticipated loads were small, on a microtensile stage (Deben Microtest, UK) with a load cell. In all cases, the cross-head speeds were maintained at . In addition, we have used a nanoindentor (Hysitron Inc., USA) with in situ imaging function capable of applying indentation loads of the order of at selected locations on a material cross section.
Digital image correlation was used to monitor strains on samples during some of the tensile tests. The commercial software Vic-2D (Correlated Solutions, USA) was used for the measurement of displacements and strains on the sample surface. Further, an open source image processing software ImageJ (National Institute of Health, USA) was used to analyse micrographs obtained from the electron microscope, e.g. to determine the volume fraction of fibres on a cross section.
Results involving XRD were obtained using a powder X-ray diffractometer (Brucker AXS, USA) with a source. Also, results involving electron microscopy were obtained from a field emission scanning electron microscope (FESEM, Sigma, Zeiss, Germany).
4. The stiffness of a bamboo culm
On a macroscopic scale, bamboo is a long tapered beam made of a radially graded transversely isotropic material. The grading in the radial direction results from the graded areal distribution of stiff fibre sheaths (around the vascular bundles) which are surrounded by relatively softer foam-like parenchyma cells. The fibres in the sheaths, in turn, have secondary cell walls that have a lignin and hemicellulose matrix reinforced by extremely stiff and largely crystalline cellulose microfibrils. In their study on Moso bamboo (Phyllostachys pubescens), Liu et al. [36] have explored the relationship between fibre area and tensile properties. While assessing the usefulness of bamboo as a structural material, we need to first determine exactly how this hierarchical material design strategy contributes to the overall stiffness. The investigation is complicated by the fact that the structure and properties of the different constituents at different scales are not known. However, we show that there exists a smaller set of key parameters which enable us to reliably predict the overall mechanical properties of a bamboo culm.
4.1. Predicting stiffness of the fibres
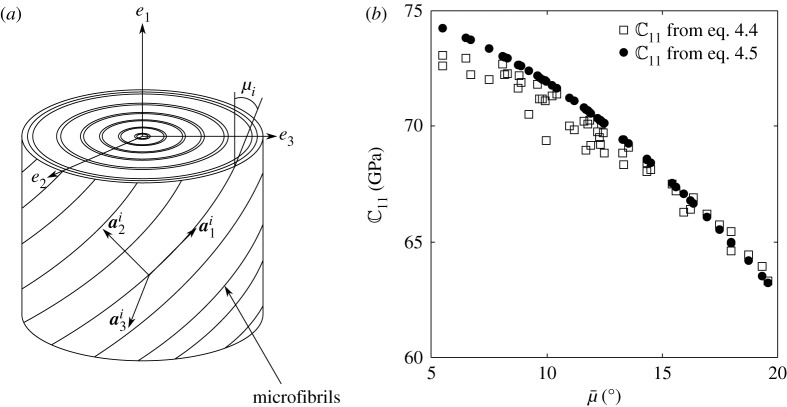
We start by systematically calculating the properties of individual fibres. As discussed earlier, the fibre wall is composed of cellulose microfibrils oriented at a particular angle in a lamella. The number and thickness of the lamellae and the orientation of the microfibrils in each vary but some commonalities have been pointed out. Electron microscopic studies by Parameswaran & Liese [24] (see also [19, 37]) have revealed that there are generally N = 5–8 alternately thick and thin lamellae (thicknesses denoted by ) in the secondary cell wall, with the orientations being close to = 2–5 and 85–90 in the thick and thin layers, respectively. The somewhat idealized lamellar structure is shown in figure 9a. The orientation of the cellulose microfibrils defines an axis , whereas the longitudinal axis is denoted by . The orientation angle of the microfibrils is .
Figure 9.
(a) Idealized multilamellar cell wall structure showing the axes defining the orientations of the microfibrils. (b) Comparison of the values of the overall axial Young's modulus of a fibre calculated using equations (4.4) and (4.5).
4.1.1. Fibre cell walls as fibre reinforced composites.
With the arrangement shown in figure 9a, each lamella, i, is transversely isotropic, with defining the plane of isotropy. The microfibril direction also coincides with the axis of the cellulose crystal. The lignin and hemicellulose complex surrounding the microfibrils is considered to be isotropic. Estimates of the moduli of lignin and hemicellulose, obtained from experimental [38–40] and atomistic simulations [22], are in the range 2–6.7 and 3.5–8.4 , respectively. Volume fractions of lignin and hemicellulose are and , respectively [41]. Simple rule of mixtures applied to the lignin–hemicellulose complex suggests a modulus of about . The Poisson's ratio is taken to be , whereas the volume fraction , so that the volume fraction of cellulose, .
Hashin [42] has derived bounds on the stiffness of transversely isotropic composites reinforced with transversely isotropic fibres. For a transversely isotropic material, given the Young's moduli and , shear moduli and , Poisson's ratios and , (where the superscripts A and T pertain to quantities in the axial and shear directions, respectively), and the transverse bulk modulus , the stiffness matrix (connecting the stress to the strain ) of the material of the ith lamella, in the system is given as
| 4.1 |
The modulus of crystalline cellulose has been obtained by several authors through atomistic simulations [43, 44]. The unit cell of cellulose is not exactly symmetrical in the and directions (figure 5c) but the moduli in these directions turn out to be only marginally different, indicating that the cellulose microfibrils themselves can be approximated as transversely isotropic entities. We have performed atomistic simulations on a single crystalline periodic box consisting of cellulose (monoclinic form) unit cells, using the commercial software Materials Studio. The obtained values for the moduli in the axial and transverse or directions are given by: , , and , where subscript c denotes cellulose. The Poisson's ratio . For the axial Young's modulus , which is much higher compared with the other moduli, values reported in the literature are in the range of 124–155 . In fact, crystalline cellulose microfibrils are comparable in stiffness to Kevlar.
The overall stiffnesses , and and axial Poisson's ratio defining the stiffness matrix of the ith lamella in the system is given by Hashin [42]:
| 4.2 |
For the properties of cellulose microfibrils (transversely isotropic) and lignin–hemicellulose complex (isotropic) chosen, the values of and are 74.3, 6.1, 2.1 and 0.19 , respectively. Note that the axial Poisson's ratio and Young's modulus are well approximated by the rule of mixtures, because the last terms in equations (4.2)(b) and (d) are, in view of the large mismatch in stiffness between cellulose and the lignin–hemicellulose complex, small. Also, the transverse shear and Young's moduli and Poisson's ratios are given by bounds (also derived by [42]) and, according to the properties chosen,
| 4.3 |
To estimate the stiffness of the multilamellar secondary cell wall of the fibres in the system, we take two heuristic approaches. Assume that the number of lamellae N ranges between four and eight. The thickness of lamella i is denoted by such that the total thickness is . It is known from microscopic studies on delignified fibres that the thick lamellae are about five times thicker than the thin ones (see [1, figure 46]). Total number N of alternate thick and thin lamellae with thickness ratio of 5 are generated with each lamella having a value of . The orientations of the microfibrils are chosen from a uniform random distribution such that, in the thin lamellae and in the thick ones .
In the first approach, stiffness of the multilamellar cell wall is then calculated using the simple rule of mixtures:
| 4.4 |
where is the transformation matrix between axis of the ith lamella and the global . is the Reuter matrix, which is given by
Note that denotes the effective stiffness matrix in the system of the entire fibre wall containing four to eight lamellae.
In the second approach, the overall stiffness is calculated using
| 4.5 |
where and are calculated using the average orientation of the microfibrils,
| 4.6 |
The motivation for the second approach comes from the fact that the average microfibril orientation is easily accessed through XRD or optical methods [32, 33, 45]. Indeed, the values of the component (the modulus in the axial direction) from several realizations performed with random values of N and , using equations (4.4) and (4.5) are compared in figure 9b. The average microfibril orientation, , has values between 5 and in our simulations (as also in reported experiments on bamboo, e.g. [46], and wood, e.g. [45]). The stiffness calculated using provides a reasonable bound to the overall modulus of the cell wall. In the subsequent discussions, unless otherwise mentioned, for the cell wall will be assumed to be calculated using equation (4.5).
4.1.2. The axial modulus through experiments.
The estimate for axial modulus obtained using equation (4.5) needs to be verified through experiments. Unfortunately, experimental determination of the mechanical properties of the cell wall is fraught with uncertainties (see [47] for a discussion of the issues involved). Here we have attempted two methods to verify if the estimates of stiffness that we determined theoretically in §4.1 are reasonable.
4.2. Tensile tests on fibre bundles
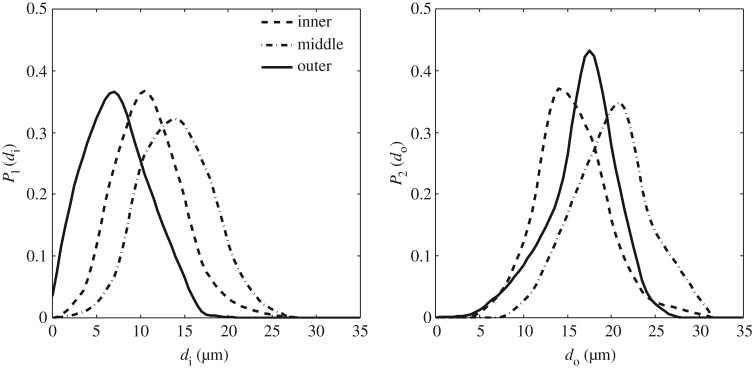
The process of separating the fibres from parenchyma (detailed in §3) does not produce a single fibre but a bundle. A bundle contains hundreds of fibres and moreover, the shape of the cross section of the fibres depends on the fibre bundles drawn from location of the sheath from which the bundle is extracted. In fact, dimensions of several fibres extracted from inner, outer and middle locations on the cross section allow us to determine the probabilities and (shown in figure 10a,b) of finding a fibre with inner diameter and outer diameter , respectively. Moreover, the fibres have different distributions of inner and outer diameters in the inner, outer and middle parts of the culm cross section; the fibres close to the outer region tend to have smaller inner diameters.
Figure 10.
Experimentally determined probability density functions and at inner, middle and outer locations on a cross section.
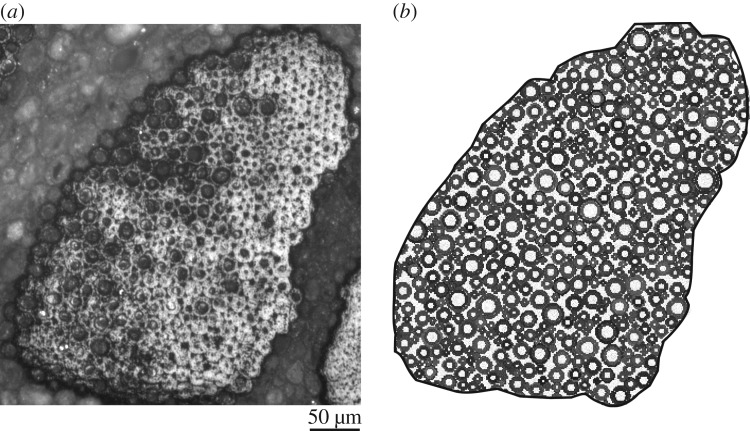
With the probability density functions at hand, using a standard algorithm for filling an arbitrary polygonal shape with circles, the irregular cross section of the bundle (e.g. the one shown in figure 11a) can be filled up with fibres having inner and outer diameters drawn from the distributions and . This ensures that the synthetic bundle thus generated will have the same distribution of fibre cross sections as a real bundle. The algorithm for choosing a random numbers x (with ) such that they follow a given probability density is as follows (see [48, figure 7.3.2]):
— Generate a trial value such that , where is uniform random number between 0 and 1.
— Choose a function that has finite area and for .
— Determine and corresponding to .
— Generate another uniform random number between 0 and .
— Accept the trial value only if .
Figure 11.
(a) Cross section of an extracted fibre bundle containing approximately 310 fibres. A synthetic bundle, containing 326 fibres, with and drawn from the distribution in figure 10 is shown in (b).
The micrograph in figure 11a shows the entire cross section of an extracted fibre bundle, whereas figure 11b shows the corresponding synthetic bundle generated by filling up the cross-sectional shape with circles.
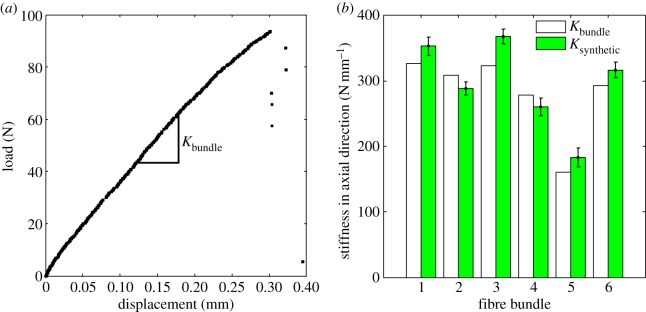
Several extracted fibre bundles are tested on the microtensile set-up. The bundles of length were gripped in the set-up with a gauge length . A typical force–displacement response is shown in figure 12a, from which, the slope can be easily determined. Note that the bundle cross section has close-packed fibres bonded together with lignin, which is an order of magnitude more compliant compared with the cell wall material. Moreover, the volume fraction of the binder in the cross section is small. This suggests that we can safely neglect the contribution of the binder material on the axial stiffness of the bundle. The effective stiffness of a synthetic bundle is thus determined simply as
| 4.7 |
where M is the number of fibres in the bundle, the annular cross-sectional area of fibre k and the average microfibril orientation angle (between 5 and ) randomly assigned to fibre k in the bundle. The axial modulus is obtained using equation (4.5).
Figure 12.
(a) Typical force–displacement response for tensile test on fibre bundle. Comparison between and for six representative bundles drawn from different locations on the cross section is shown in (b).
The above model, at first glance, looks over-simplified. However, as shown in figure 12b, the stiffnesses and are very close to each other for all the bundles tested. The fibre bundles in figure 12b are arranged such that samples 1 and 2 are from the inner part, 3 and 4 from middle and 5 and 6 are taken from the outer part. However, the diameter ranges (especially the range of the outer diameter) of the fibres do not show a strong distributional regularity. This is also evident from figure 10. Thus, the location of the fibre bundles does not seem to have a bearing on their stiffness as all bundles are constituted of fibres with almost identical distribution of inner and outer diameters. This result is remarkable given the fact that though a large number of factors are not known with certainty, knowledge of the average microfibril angle in the secondary cell walls, an estimate of the modulus of single crystalline cellulose and the size and shape distribution of the fibres in the cross section allows us to determine the axial modulus of a bamboo fibre quite closely. The radial variation in the axial modulus is primarily owing to the change in the fibre inner and outer diameter distribution.
4.3. Determination of stiffness through nano-indentation
Nano-indentation provides a quick and easy way of measuring mechanical properties of small volumes of materials in situ. Very low load, depth sensing indentation instruments are capable of making shallow indents as small as a few nanometres. The Young's modulus is typically measured during the recovery phase of the indentation, with the unloading process modelled as an elastic contact with a half space [49]. It has been shown by Oliver & Pharr [50] that the contact compliance is independent of the shape of the indenter and is given by:
| 4.8 |
where, the modulus is
| 4.9 |
for a substrate with isotropic properties. Here, L and h are the applied load and contact depth, whereas A is the projected contact area, obtained from the initial slope of the unloading curve [49]. For isotropic samples, this method of determining for the substrate works well.
However, because the secondary cell walls of the fibres are anisotropic, the modulus measured by nano-indentation is not simply the modulus in the direction of indentation [51, 52]. The modulus will have to be computed as [51]:
| 4.10 |
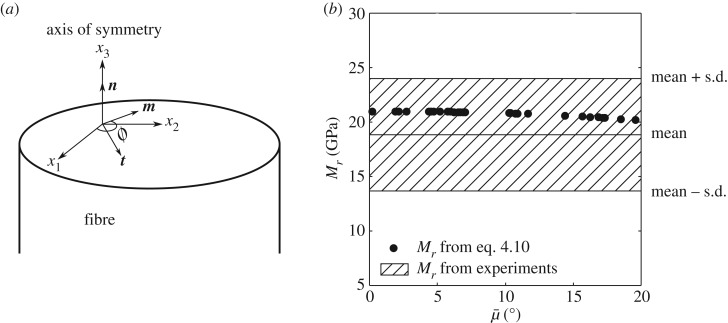
Barnett & Lothe [53] have derived the displacement Green's function for a point load applied on the boundary of an anisotropic half space. The tensor arises in the Green's function and is defined according to the reference systems shown in figure 13a. The anisotropic material stiffness is defined in the system, where, in our case, is along the fibre axis. The direction of indentation is normal to the surface, so that the direction cosines are simply . The unit vector lies on the surface, makes an angle θ with the axis and forms an orthonormal triad with and . Again, in the present case, happens to be along . Then, is defined as [51],
| 4.11 |
where ϕ is the angle between and . Here, we define, . The term on the right-hand side of equation (4.10) can be evaluated numerically given the tensor . Comparison between the computed values and those obtained by measuring directly from nano-indentation is presented in figure 13b.
Figure 13.
(a) The coordinate system and (, , ) vectors used to obtain estimates of the indentation modulus in equation (4.10). The variation of calculated indentation modulus with average microfibril orientation is shown in (b). The indentation moduli obtained from nano-indentation experiments are superposed.
The value of calculated from equation (4.10) decreases with . When is varied from 0 to , ranges between 19 and . For experimentally determined values of , the values of at the point of indentation cannot obtained. However, the experimentally determined value of the modulus lies between 10 and . The mean value of the experimentally obtained indentation modulus, shown in figure 13b, is from 30 different nano-indentations on walls of different fibres in different cross-sectional samples from a culm. Values at mean ± standard deviation of the experimental data have also been shown to provide a measure of the scatter.
4.4. Properties of parenchyma
In order to obtain the modulus of the secondary cell walls of parenchyma cells, we followed a procedure similar to that described in §4.1.1 for fibres. Cellulose forms of the parenchyma walls but the angle made by the cellulose microfibrils is much larger in parenchyma than in the fibres. The larger values of makes parenchyma cell walls much more compliant than fibres. We estimated that the average microfibril orientation angle is 30–35, which makes very low, ranging between 2 and only. The axial and indentation moduli for secondary cell walls of parenchyma and fibre cells are summarized in table 1 for the species of bamboo we tested. It can be expected that these values, dependent primarily on the average cellulose microfibril orientation, will also be good estimates for other species of bamboo.
Table 1.
The axial and indentation moduli for parenchyma and fibre cell walls.
| type of cell | axial modulus () | indentation modulus () |
|---|---|---|
| fibre | 15–29 | 8–31 |
| parenchyma | 3–7 | 2–6 |
4.5. Overall axial properties of bamboo culm
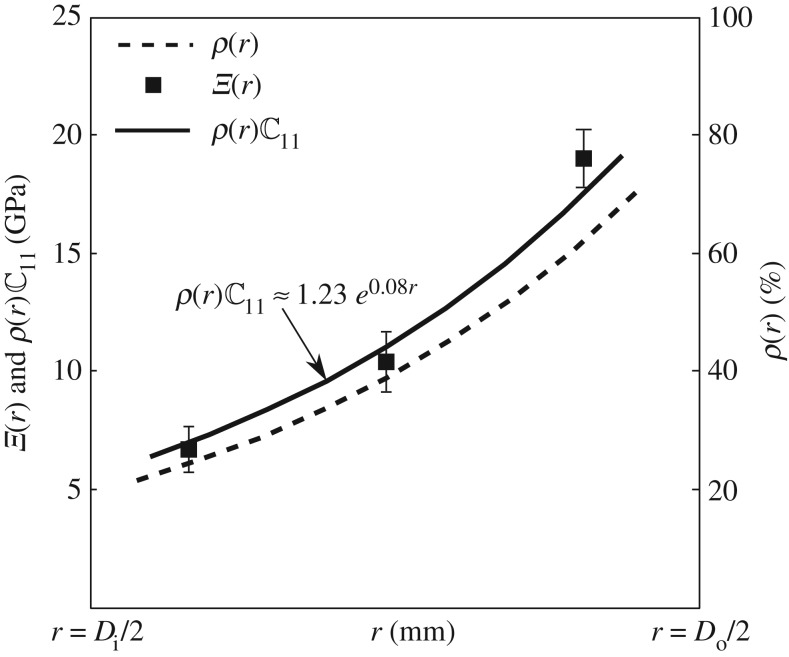
Radial variation of areal density of fibres on the cross section of a culm is shown by dotted lines in figure 14. As also shown by the micrographs in figure 3, the areal density increases sharply towards the outer part of the culm. Tensile tests have been conducted on several thick specimens with their gauge lengths aligned in the longitudinal direction (figure 8). The modulus obtained from these tests is also plotted on figure 14. Clearly, the overall axial modulus of the culm follows the variation of the areal density very closely. This implies that the overall modulus, at least in the axial direction, relies entirely on the stiffness of the fibres.
Figure 14.
The variation with radius r of the areal density of fibre clearly follows the variation in , which, in turn, is close to the experimentally obtained axial moduli shown by solid squares. (Note: and are inner and outer diameter of bamboo culm, respectively.)
Indeed, as shown in figure 14, if we calculate the overall modulus as , where is calculated using equation (4.5), it matches quite closely with what is measured from the tensile tests. The overall axial modulus does not depend significantly on the stiffness of the parenchyma cells.
These results can be compared with those of Habibi et al. [4] and Dixon & Gibson [5] obtained on other species of bamboo. In both these studies, the modulus was seen to depend on the distribution of fibres. In the latter case, Moso bamboo exhibited an average stiffness of about , but varied very little over the thickness. Habibi et al. [4] report a variation in stiffness from 10 to . Although the values of stiffness are comparable to the species characterized by us, we detect a stronger grading of the stiffness. Moreover, we also trace the origin of the stiffness to the stiffness of single crystal cellulose and the characteristic microfibril angle.
Overall axial modulus, in the final analysis, turns out to be deceptively simple to determine. We need to know the range of average microfibril orientation angles in the fibres and the areal distribution of the fibres over the cross section. Thus, and are the most important parameters that dictate the stiffness of bamboo and determining these hold the key to predicting the axial stiffness. Once determined (we have addressed the determination of the mean microfibril orientation in bamboo [46], and it has been determined for varied types of wood through different techniques [32, 33, 45]), assuming that the microfibrils are single crystalline cellulose , the overall axial modulus can be calculated in a straightforward manner. The hemicellulose–lignin complex surrounding the cellulose in the microfibrils and the foam-like parenchyma around the fibre bundles are too soft to play any significant role in determining stiffness. Note that this does in no way rule out the fact that the softer phases may have important functions in determining the toughness and arresting propagating cracks.
Thus, the culm turns out to be a naturally functionally graded material with axial stiffness varying as , with and .
5. Conclusion
We have studied the morphology and stiffness of a local variety of bamboo with a view to establish an implementable method of linking the former to the latter. We have shown that
The axial modulus of a bamboo internode can be estimated if we have reliable measures of (i) the average microfibril angle in the secondary cell walls of the sclerenchymatous fibres, (ii) areal distribution of the fibres, and (iii) size distribution of the fibres.
The estimates of stiffness obtained using simple ideas borrowed from the mechanics of composite materials have been tested against experiments both on bundles of fibres and samples drawn from the culm.
Bamboo is a radially graded, transversely isotropic composite material. For the species studied, axial modulus varies with radius as .
It should be noted that from a structural point of view, the various aspects of the microstructure are poorly understood. These include the role and exact properties of the soft foam-like parenchyma and hemicellulose–lignin complex surrounding the cellulose microfibrils in the sclerenchyma walls. While our study has shown that the axial stiffness is not strongly affected by our lack of knowledge in these aspects, their role in arresting fracture cannot be ruled out. This will be discussed in a forthcoming paper.
Acknowledgments
We thank Susan E. Marcus, Senior Research Laboratory Technician in School of Biology at University of Leeds, Leeds (UK) for carrying out the immunolabelling of the culm sections.
Footnotes
Both triclinic (α) or monoclinic (β) unit cells are possible, though the β structure is abundant in bamboo.
Ethics
This is original work and is part of PhD programme carried out at Indian Institute of Technology Kanpur. The biological samples have been obtained from the botanical nursery of the institute with prior permission. The immunofluorescence imaging and data analysis of cross sections have been carried out at Centre for Plant Sciences at University of Leeds, UK.
Data accessibility
Supporting data for this study can be accessed via the Dryad Digital Repository http://dx.doi.org/10.5061/dryad.5ch51 [54]. The supporting data contains (i) micrographs of bamboo microstructure other than those mentioned in the manuscript; (ii) immunofluorescence images of bamboo microstructure other than those mentioned in the manuscript (Initial−IC_bamboo_1406.pptx); (iii) data of XRD study and the calculations thereof (degree of crystallinity.xlsx); (iv) data used for generating probability density functions (ID_OD_Size_Distribution.xlsx); and (v) Matlab script for filling a circle (for_CIRC_shape.m) and an arbitrary-shaped polygon (for_any_shape.m) with circles.
Author's contributions
S.M. and S.B. conceived and designed the research. J.P.K. participated in immunofluorescence imaging and data analysis of cross sections. S.M. conducted experiments of mechanical characterization and simulation. S.M. and S.B. drafted the manuscript. All authors read and approved the manuscript.
Competing interests
We declare we have no competing interests.
Funding
We received no funding for this study.
References
- 1.Liese W. 1998. The anatomy of bamboo culms. Tech. Report. 18, International Network for Bamboo and Rattan.
- 2.Bhalla S, Gupta S, Sudhakar P, Suresh R. 2008. Bamboo as green alternative to concrete and steel for modern structures. J. Environ. Res. Dev. 3, 362–370. [Google Scholar]
- 3.Nogata F, Takahashi H. 1995. Intelligent functionally graded material: bamboo. Compos. Eng. 5, 743–751. (doi:10.1016/0961-9526(95)00037-N) [Google Scholar]
- 4.Habibi MK, Samaei AT, Gheshlaghi B, Lu J, Lu Y. 2015. Asymmetric flexural behavior from bamboo's functionally graded hierarchical structure: underlying mechanisms. Acta Biomater. 16, 178–186. (doi:10.1016/j.actbio.2015.01.038) [DOI] [PubMed] [Google Scholar]
- 5.Dixon PG, Gibson LJ. 2014. The structure and mechanics of Moso bamboo material. J. R. Soc. Interface 11, 20140321 (doi:10.1098/rsif.2014.0321) [DOI] [PMC free article] [PubMed] [Google Scholar]
- 6.Dixon P, Ahvenainen P, Aijazi A, Chen S, Lin S, Augusciak P, Borrega M, Svedström K, Gibson L. 2015. Comparison of the structure and flexural properties of Moso, Guadua and Tre Gai bamboo. Construct. Build. Mater. 90, 11–17. (doi:10.1016/j.conbuildmat.2015.04.042) [Google Scholar]
- 7.Amada S, Ichikawa Y, Munekata T, Nagase Y, Shimizu H. 1997. Fiber texture and mechanical graded structure of bamboo. Compos. Part B: Eng. 28, 13–20. (doi:10.1016/S1359-8368(96)00020-0) [Google Scholar]
- 8.Ray A, Mondal S, Das S, Ramachandrarao P. 2005. Bamboo: a functionally graded composite-correlation between microstructure and mechanical strength. J. Mater. Sci. 40, 5249–5253. (doi:10.1007/s10853-005-4419-9) [Google Scholar]
- 9.Armandei M, Darwish IF, Ghavami K. 2015. Experimental study on variation of mechanical properties of a cantilever beam of bamboo. Construct. Build. Mater. 101, 784–790. (doi:10.1016/j.conbuildmat.2015.10.078) [Google Scholar]
- 10.Schulgasser K, Witztum A. 1992. On the strength, stiffness and stability of tubular plant stems and leaves. J. Theor. Biol. 155, 497–515. (doi:10.1016/S0022-5193(05)80632-0) [Google Scholar]
- 11.Grosser D, Liese W. 1971. On the anatomy of Asian bamboos, with special reference to their vascular bundles. Wood Sci. Technol. 5, 290–312. (doi:10.1007/BF00365061) [Google Scholar]
- 12.Grosser D, Liese W. 1973. Present status and problems of bamboo classification. J. Arnold Arboretum 54, 293–308. [Google Scholar]
- 13.Low I, Che Z, Latella B. 2006. Mapping the structure, composition and mechanical properties of bamboo. J. Mater. Res. 21, 1969–1976. (doi:10.1557/jmr.2006.0238) [Google Scholar]
- 14.Habibi MK, Lu Y. 2014. Crack propagation in bamboo's hierarchical cellular structure. Nat. Sci. Rep. 4, 5598 (doi:10.1038/srep05598) [DOI] [PMC free article] [PubMed] [Google Scholar]
- 15.Gao H, Ji B, Jäger IL, Arzt E, Fratzl P. 2003. Materials become insensitive to flaws at nanoscale: lessons from nature. Proc. Natl Acad. Sci. USA 100, 5597–5600. (doi:10.1073/pnas.0631609100) [DOI] [PMC free article] [PubMed] [Google Scholar]
- 16.Jäger I, Fratzl P. 2000. Mineralized collagen fibrils: a mechanical model with a staggered arrangement of mineral particles. Biophys. J. 79, 1737–1746. (doi:10.1016/S0006-3495(00)76426-5) [DOI] [PMC free article] [PubMed] [Google Scholar]
- 17.Askarinejad S, Rahbar N. 2015. Toughening mechanisms in bioinspired multilayered materials. J. R. Soc. Interface 12, 20140855 (doi:10.1098/rsif.2014.0855) [DOI] [PMC free article] [PubMed] [Google Scholar]
- 18.Wilbrink DV, Utz M, Ritchie RO, Begley MR. 2010. Scaling of strength and ductility in bioinspired brick and mortar composites. Appl. Phys. Lett. 97, 193701–00. (doi:10.1063/1.3499294) [Google Scholar]
- 19.Tono I, Ono K. 1962. The layered structure and its morphological transformation by acid treatment. J. Jpn. Wood Res. Soc. 8, 245–249. [Google Scholar]
- 20.Parameswaran N, Liese W. 1980. Ultrastructural aspects of bamboo cells. Cellulose Chem. Technol. 14, 587–609. [Google Scholar]
- 21.Murphy R, Alvin K. 1992. Variation in fibre wall structure in bamboo. IAWA J. 13, 403–410. (doi:10.1163/22941932-90001296) [Google Scholar]
- 22.Youssefian S, Rahbar N. 2015. Molecular origin of strength and stiffness in bamboo fibrils. Nat. Sci. Rep. 5, 11116–00 (doi:10.1038/srep11116) [DOI] [PMC free article] [PubMed] [Google Scholar]
- 23.Wegst UG, Bai H, Saiz E, Tomsia AP, Ritchie RO. 2015. Bioinspired structural materials. Nat. Mater. 14, 23–36. (doi:10.1038/nmat4089) [DOI] [PubMed] [Google Scholar]
- 24.Parameswaran N, Liese W. 1976. On the fine structure of bamboo fibres. Wood Sci. Technol. 10, 231–246. (doi:10.1007/BF00350830) [Google Scholar]
- 25.Sakakibara A. 1980. A structural model of softwood lignin. Wood Sci. Technol. 14, 89–100. (doi:10.1007/BF00584038) [Google Scholar]
- 26.Burton RA, Gidley MJ, Fincher GB. 2010. Heterogeneity in the chemistry, structure and function of plant cell walls. Nat. Chem. Biol. 6, 724–732. (doi:10.1038/nchembio.439) [DOI] [PubMed] [Google Scholar]
- 27.Habibi MK, Tam L, Lau D, Lu Y. 2016. Viscoelastic damping behavior of structural bamboo material and its microstructural origins. Mech. Mater. 97, 184–198. (doi:10.1016/j.mechmat.2016.03.002) [Google Scholar]
- 28.Hervé C, Marcus SE, Knox JP. 2011. Monoclonal antibodies, carbohydrate-binding modules, and the detection of polysaccharides in plant cell walls. In The plant cell wall: methods and protocols. Methods in molecular biology (ed. Popper Z.), pp. 103–111. Totowa, NJ: Humana Press. [Google Scholar]
- 29.McCartney L, Marcus SE, Knox JP. 2005. Monoclonal antibodies to plant cell wall xylans and arabinoxylans. J. Histochem. Cytochem. 53, 543–546. (doi:10.1369/jhc.4B6578.2005) [DOI] [PubMed] [Google Scholar]
- 30.Cornuault V. et al. 2015. Monoclonal antibodies indicate low-abundance links between heteroxylan and other glycans of plant cell walls. Planta 242, 1321–1334. (doi:10.1007/s00425-015-2375-4) [DOI] [PMC free article] [PubMed] [Google Scholar]
- 31.Knox J. 2009. Molecular probes for plant cell wall polymers. See http://www.plantprobes.net/.
- 32.Cave I. 1997. Theory of X-ray measurement of microfibril angle in wood. Wood Sci. Technol. 31, 143–152. (doi:10.1007/BF00705881) [Google Scholar]
- 33.Cave I. 1997. Theory of X-ray measurement of microfibril angle in wood. Wood Sci. Technol. 31, 225–234. (doi:10.1007/BF00702610) [Google Scholar]
- 34.Sosiati H, Harsojo. 2013. Effect of combined treatment methods on the crystallinity and surface morphology of kenaf bast fibers. Cellulose Chem. Technol. 48, 33–44. [Google Scholar]
- 35.ASTM Standard D143-14. 2014. Standard test methods for small clear specimens of timber West Conshohocken, PA: ASTM International. [Google Scholar]
- 36.Liu H, Jiang Z, Zhang X, Liu X, Sun Z. 2014. Effect of fiber on tensile properties of Moso bamboo. Bioresources 9, 6888–6898. (doi:10.15376/biores.9.4.6888-6898) [Google Scholar]
- 37.Preston RD, Singh K. 1950. The fine structure of bamboo fibres: I. Optical properties and X-ray data. J. Exp. Bot. 1, 214–226. [Google Scholar]
- 38.Cousins W. 1976. Elastic modulus of lignin as related to moisture content. Wood Sci. Technol. 10, 9–17. (doi:10.1007/BF00376380) [Google Scholar]
- 39.Cousins W. 1978. Young's modulus of hemicellulose as related to moisture content. Wood Sci. Technol. 12, 161–167. (doi:10.1007/BF00372862) [Google Scholar]
- 40.Bergander A, Salmén L. 2002. Cell wall properties and their effects on the mechanical properties of fibers. J. Mater. Sci. 37, 151–156. (doi:10.1023/A:1013115925679) [Google Scholar]
- 41.Gibson LJ. 2012. The hierarchical structure and mechanics of plant materials. J. R. Soc. Interface 9, 2749–2766. (doi:10.1098/rsif.2012.0341) [DOI] [PMC free article] [PubMed] [Google Scholar]
- 42.Hashin Z. 1979. Analysis of properties of fiber composites with anisotropic constituents. J. Appl. Mech. 46, 543–550. (doi:10.1115/1.3424603) [Google Scholar]
- 43.Mark RE. 1967. Cell wall mechanics of Tracheids. New Haven, CT: Yale University Press. [Google Scholar]
- 44.Tanaka F, Iwata T. 2006. Estimation of the elastic modulus of cellulose crystal by molecular mechanics simulation. Cellulose 13, 509–517. (doi:10.1007/s10570-006-9068-x) [Google Scholar]
- 45.Abraham Y, Elbaum R. 2013. Quantification of microfibril angle in secondary cell walls at subcellular resolution by means of polarized light microscopy. New Phytol. 197, 1012–1019. (doi:10.1111/nph.12070) [DOI] [PubMed] [Google Scholar]
- 46.Mannan S, Zaffar M, Pradhan A, Basu S. 2016. Measurement of microfibril angles in bamboo using Mueller matrix imaging. Appl. Opt. 55, 8971–8978. (doi:10.1364/AO.55.008971) [DOI] [PubMed] [Google Scholar]
- 47.Burgert I, Dunlop JW. 2011. Micromechanics of cell walls. In Mechanical integration of plant cells and plants (ed. Wojtaszek P.). Signaling and communication in plants, vol. 9, pp. 27–52. Berlin, Germany: Springer. [Google Scholar]
- 48.Press WH, Teukolsky SA, Vetterling WT, Flannery BP. 2007. Rejection method. In Numerical recipes: the art of scientific computing (eds Cowles L, Harvey A), pp. 365–367. Cambridge, UK: Cambridge University Press. [Google Scholar]
- 49.Doerner MF, Nix WD. 1986. A method for interpreting the data from depth-sensing indentation instruments. J. Mater. Res. 1, 601–609. (doi:10.1557/JMR.1986.0601) [Google Scholar]
- 50.Oliver WC, Pharr GM. 1992. An improved technique for determining hardness and elastic modulus using load and displacement sensing indentation experiments. J. Mater. Res. 7, 1564–1583. (doi:10.1557/JMR.1992.1564) [Google Scholar]
- 51.Vlassak JJ, Nix W. 1994. Measuring the elastic properties of anisotropic materials by means of indentation experiments. J. Mech. Phys. Solids 42, 1223–1245. (doi:10.1016/0022-5096(94)90033-7) [Google Scholar]
- 52.Vlassak J. 2004. A model for chemical–mechanical polishing of a material surface based on contact mechanics. J.Mech. Phys. Solids 52, 847–873. (doi:10.1016/j.jmps.2003.07.007) [Google Scholar]
- 53.Barnett D, Lothe J. 1975. Line force loadings on anisotropic half-spaces and wedges. Phys. Norvegica 8, 13–22. [Google Scholar]
- 54.Mannan S, Knox JP, Basu S. 2016. Data from: Correlations between axial stiffness and microstructure of a species of bamboo. Dryad Digital Repository. (doi:10.5061/dryad.5ch51) [DOI] [PMC free article] [PubMed]
Associated Data
This section collects any data citations, data availability statements, or supplementary materials included in this article.
Data Citations
- Mannan S, Knox JP, Basu S. 2016. Data from: Correlations between axial stiffness and microstructure of a species of bamboo. Dryad Digital Repository. (doi:10.5061/dryad.5ch51) [DOI] [PMC free article] [PubMed]
Data Availability Statement
Supporting data for this study can be accessed via the Dryad Digital Repository http://dx.doi.org/10.5061/dryad.5ch51 [54]. The supporting data contains (i) micrographs of bamboo microstructure other than those mentioned in the manuscript; (ii) immunofluorescence images of bamboo microstructure other than those mentioned in the manuscript (Initial−IC_bamboo_1406.pptx); (iii) data of XRD study and the calculations thereof (degree of crystallinity.xlsx); (iv) data used for generating probability density functions (ID_OD_Size_Distribution.xlsx); and (v) Matlab script for filling a circle (for_CIRC_shape.m) and an arbitrary-shaped polygon (for_any_shape.m) with circles.


