Abstract
Obesity and metabolic syndrome are independent risk factors for chronic kidney disease, even without diabetes or hyperglycemia.
Here, we compare two mouse models that are susceptible to diet-induced obesity: the relatively renal injury resistant C57BL/6J strain and the DBA2/J strain which is more sensitive to renal injury. Our studies focused on characterizing the effects of high fat diet feeding on renal oxidative stress, albuminuria, fibrosis and podocyte loss/insulin resistance. While the C57BL/6J strain does not develop significant pathological changes in the kidney, at least on lard based diets within the time frame investigated, it does show increased renal iNOS and nitrotyrosine levels and elevated mitochondrial respiration which may be indicative of mitochondrial lipid overfueling. Restricting the high fat diet to decrease adiposity decreased the levels of cellular oxidative stress markers, indicating that adiposity-related proinflammatory changes such as increased iNOS levels may trigger similar responses in the kidney. Mitochondrial respiration remained higher, suggesting that eating excess lipids, despite normal adiposity may still lead to renal mitochondrial overfueling. In comparison, DBA/2J mice developed albuminuria on similar diets, signs of fibrosis, oxidative stress, early signs of podocyte loss (evaluated by the markers podocin and WT-1) and podocyte insulin resistance (unable to phosphorylate their glomerular Akt when insulin was given). To summarize, while the C57BL/6J strain is not particularly susceptible to renal disease, changes in its mitochondrial lipid handling combined with the easy availability of transgenic technology may be an advantage to design new knockout models related to mitochondrial lipid metabolism. The DBA/2J model could serve as a basis for studying podocyte insulin resistance and identifying early renal markers in obesity before more severe kidney disease develops. Based on our observations, we encourage further critical evaluation of mouse models for obesity related chronic kidney disease.
Keywords: obesity, chronic kidney disease, mouse models, high fat diet, oxidative stress
1. Introduction
Metabolic syndrome, insulin resistance and obesity are associated with an increased risk for complications later, including chronic kidney disease (CKD) (1-3). CKDs eventually may have devastating consequences, if a patient enters end-stage renal disease, leading to expensive dialysis. Novel data suggest that CKD can develop in obese individuals without diabetes as well, pointing out the importance of an early detection and prevention (4-6). Early on, characteristic obesity-linked changes occur, which include collagen deposits and albuminuria (7), but most prominently focal segmental glomerulosclerosis (FSGS), related podocyte loss that precedes albuminuria and tubulointerstitial fibrosis which correlates well with the degree of albuminuria and the progression of CKD.
Numerous studies have focused extensively on diabetic nephropathy (DN) (8-10), type I and II diabetes, including a decade of studies from the AMDCC consortium, in search of reliable mouse models that could mimic the human disease and would have the potential to increase our understanding of the mechanisms in DN (11). From these studies, it is well known that while the commonly used C57BL/6J mouse strain is relatively resistant to various models of renal injury, a more renal-sensitive DBA/2J strain may be a useful building block for future studies. While the majority of studies focus on DN and various approaches on animal models of the disease, a lot less is known about obesity and metabolic syndrome-related models and their application to study renal alterations. There are only a few studies available that measure oxidative stress markers, early albuminuria and podocyte loss or podocyte insulin resistance markers in these mouse strains, and they use one or the other in their studies. Interestingly, the C57BL/6J strain is one of the most susceptible to obesity and hyperinsulinemia on high fat diets or Western-style diets. They do not develop robust nephropathy, but they do develop early signs of obesity related pathological renal changes (especially when fed Western style diets, high fat combined with sucrose) (12-14) –lesions, collagen deposits and changes in AMPK signaling (15-17). These may be early precursors of more severe renal injury in obesity (13, 14). The DBA/2J strain on the other hand has been established as more “nephro-sensitive” by the AMDCC consortium. It also develops obesity and insulin resistance in the early stages of a high fat diet feeding period (18). This strain is considered more fragile and for these reasons, they could provide a relevant basis to determine early causative relationships and an early successful intervention in diet-induced obesity and metabolic syndrome.
Oxidative stress and redox imbalance are often proposed mechanisms in various organs affected by obesity including the kidney (19), but yet incompletely understood in diet-induced obesity (DIO) models. Mitochondrial reactive species production has increasingly received attention as it is becoming evident that it can play a role in redox sensitive signaling. The interplay between mitochondrial redox processes and other cellular redox regulatory mechanisms and their downstream targets in obesity related renal changes are largely unknown. Specific radicals not only can cause oxidative, nitrative or nitrosative modifications on targets, but can be important physiological mediators of signaling mechanisms or adaptational processes (20). These obesity related redox changes can have an impact on cellular redox signaling mechanisms that are important in tissue remodeling. How this contributes to FSGS, podocyte injury or tubular fibrosis and apoptosis is not well defined.
Since the majority of studies were focusing on robust DN, our experiments were designed to test the two strains’ renal sensitivity in DIO. Specific emphasis was given to the comparison of oxidative stress markers, albuminuria, basic renal histology and podocyte markers. Potential differences between the two strains could further highlight the contribution of various factors (genetic background, adiposity induced by HF, oxidative stress) to the overall phenotype. The purpose of this hypothesis paper is therefore to highlight and characterize the above mentioned, two commonly used mouse models of DIO and underline the differences in their sensitivity to renal injury, renal oxidative stress and their potential use in the future for obesity-related chronic kidney disease research.
2. Materials and methods
2.1 Reagents
Reagents and chemicals were purchased of the highest grade available from Sigma-Aldrich (St.Louis, MO) unless otherwise noted. Primary and secondary antibodies were from various companies as indicated throughout. TriChrome and PAS staining kits were purchased from Polysciences (Warrington, PA).
2.2 Animals
In all experiments, male C57BL/6J or DBA/2J mice were used (Jackson Laboratories, Bar Harbor, ME). Mice were obtained at an age of 8 weeks (initial weight of 20-22 g) and after the acclimation period of one week at Pennington Biomedical, they were randomly divided into low fat (LF, 10 % kcal lard), high fat (HF, 45 % kcal lard) or in the long term DBA/2J studies, very high fat (VHF, 60 % kcal lard) groups, each containing 6-8 mice. Mice were housed in a room with air conditioning and a 12/12 h light/dark cycle, were fed with diets detailed above and had access to water ad libitum. Diets were purchased from Research Diets Inc. (New Brunswick, NJ). In a cohort of C57BL/6J mice, 45% kcal high fat diet was restricted (HF-R group) in a way that mice were only allowed to gain as much weight as those in their corresponding age-matched low fat cohort (21). This was achieved by measuring food consumption and body weight weekly and adjusting the feeding based on this data and the reference body weight values of those mice feeding on a low fat diet. Feeding experiments lasted 12 weeks, in DBA/2J mice for podocyte insulin sensitivity tests up to 24 weeks. For these analyses, a cohort of LF and VHF fed DBA/2J mice received a single dose of insulin (0.8 mU/g body weight ip., Humulin) 15 minutes before euthanasia. In the LF, HF and HF-R groups of the feeding restriction experiments, fat mass was measured by a rodent NMR (Bruker) available at the Comparative Biology Core of Pennington Biomedical. At the end of experiments, mice were placed in plastic metabolic cages for 24 hrs for urine collection. Finally, after CO2 euthanasia, blood was drawn by heart puncture, kidneys were excised and were either used to prepare fresh mitochondria or were placed in fixative (10 % buffered formalin) for further experiments.
All studies were approved by the institutional review board at the Pennington Biomedical Research Center and adhered to NIH guidelines for the care and handling of experimental animals.
2.3 Histology and immunofluorescent stainings
Freshly harvested kidneys were halved and immediately placed into 10 % buffered formalin for fixation. Tissues were then embedded into paraffin and sliced into 5 μm sections on a microtome at the Pennington Imaging Core Facility. Sections were immediately mounted on charged SuperFrost glass slides (Fisher Sci., Pittsburgh, PA). Periodic acid-Schiff (PAS) staining was used to identify FSGS-like lesions, hypertrophy, mesangial expansion and protein casts. Fibrosis and collagen deposits were evaluated by Masson's TriChrome staining.
For immunofluorescent stainings, slides were deparaffinized first, and kidney sections were isolated with a Pap Pen to prevent loss of fluid from the slide. Samples were incubated with a 1 % albumin/0.1 % Surfact-Amps-X-100 mixture in PBS for 30 min to block/permeabilize. We used primary anti-nitrotyrosine (Abcam, Cambridge, MA), iNOS, podocin and WT-1 (Santa Cruz, Dallas, TX), or pAkt and p42/44 MAPK (Cell Signaling, Danvers, MA) antibodies at room temperature for 1.5 hrs for staining. After washing three times with PBS, AlexaFluor 488 green or 568 red secondary antibodies (Life Technologies, Carlsbad, CA) was applied for 1 hr for green or red fluorescent staining. After incubation, slides were rinsed with PBS again three times, coverslipped and analyzed using an LSM510 (Zeiss) confocal laser microscope.
2.4 Mitochondrial respiration
Kidney mitochondria from mouse kidneys were prepared freshly as described previously (22). We used a SeaHorse XF24 Extracellular Flux Analyzer (SeaHorse Bioscience, Billerica, MA) technology available at the Pennington Biomedical Research Center to measure mitochondrial respiration and bioenergetics in renal mitochondria. This technology allows us to determine a number of mitochondrial bioenergetic parameters in a single experiment, with a number of replicates for each mouse kidney used. After titrating the optimal mitochondrial protein concentration, 2.5 μg protein/well was selected to load in all experiments. We used sequential injections of ADP, oligomycin, FCCP, and antimycin A to determine basal OCR, ATP-linked OCR, proton leak, non- mitochondrial OCR, and respiratory control ratio (RCR).
2.5 Urine analysis
Mice were placed in round plastic metabolic chambers at the end of the experiments and 24 hr urine samples were collected. Albumin levels were measured using a mouse specific Albuwell M urinary ELISA kit (Exocell, Philadelphia, PA). Creatinine levels were measured using a colorimetric creatinine kit (Exocell). Proteinuria was expressed as albumin/creatinine ratios (μg/mg).
2.6 Statistical evaluation
Data were expressed as mean ± S.D. Statistical significance between groups was determined by ANOVA and Student's t-test as appropriate, using a GraphPad Prism software. p < 0.05 was considered as the minimum level of statistical significance.
3. Results
3.1 C57BL/6J mice show resistance to early kidney damage on high fat diet
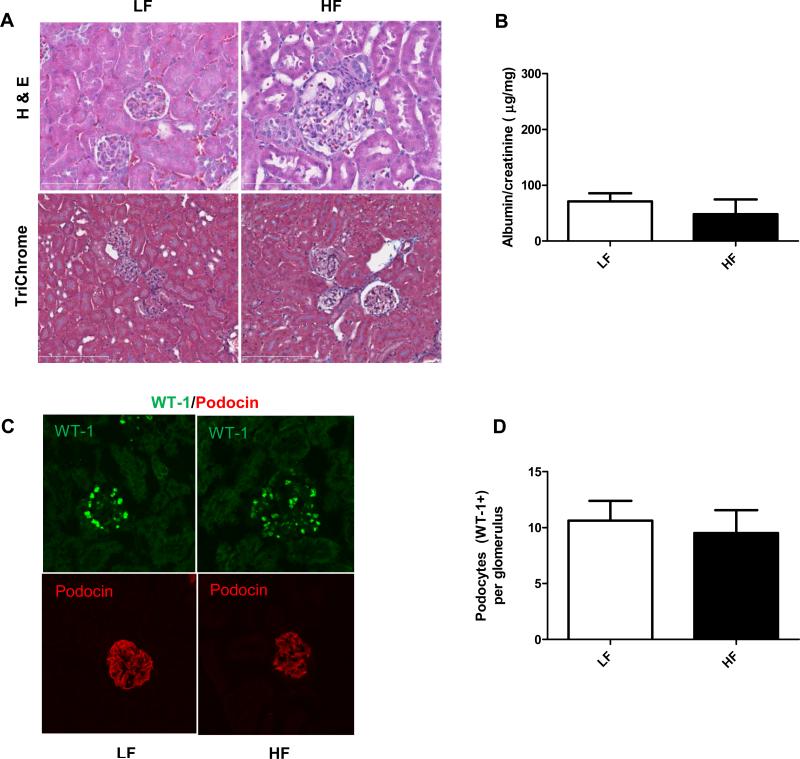
Similarly to earlier studies, including our own (22), at least in the 12 weeks of time frame that has been investigated, the C57BL/6J strain was resistant to develop renal injury on lard based high fat diets (45 % kcal). Mice on HF displayed glomerulomegalia (Fig. 1A) (for evaluation of glomerular size, see our earlier studies in (22)), which can be a precursor to obesity-related glomerulopathies (ORG), but they did not develop albuminuria at this stage, nor showed significant podocyte loss (as shown on Fig. 1C-D, WT-1 and podocin stainings) when compared to LF groups.
Figure 1.
General histology, urinary albumin levels and podocyte markers in C57BL/6J mice after 12 weeks of HF feeding. (A) Representative photomicrographs of hematoxylin/eosin and TriChrome stained kidney sections from C57BL/6J mice on LF or HF diet at 12 weeks. Larger glomeruli were observed in the HF diet group, but no other significant changes were found. (B) Albumin/creatinine ratios in C57BL/6J mice on LF and HF diets. (C) Representative IF staining of the slit diaphragm proteins WT-1 and podocin in LF and HF fed mice, detected by confocal microscopy. (D) Analysis and comparison of WT-1 positive cells in LF and HF groups.
3.2 Restricting a high fat diet is sufficient to reduce adiposity in C57BL/6J mice.
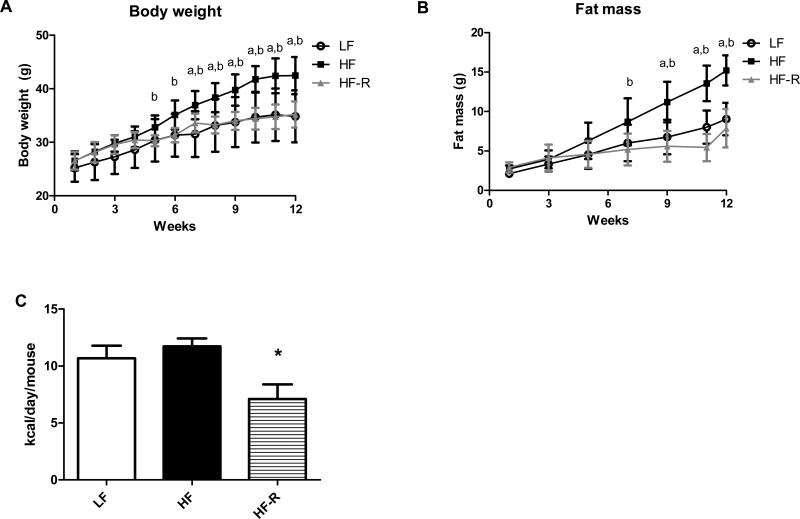
Countless previous studies including ours have shown before that C57BL/6J mice develop diet-induced obesity and insulin resistance when feeding high fat diets (12, 14, 22, 23). Here, we have investigated the effects of high fat feeding restriction on body weight and adiposity. Regardless of feeding a diet rich in lard (45 % kcal), when this diet was restricted as described in Materials and Methods, B6 mice in the HF-R group maintained body weights similar to the LF group (Fig. 2A). Importantly, HF-R group has gained significantly less fat mass when compared to the HF group (Fig. 2B). Our food intake measurements indicate that a ~ 60% restriction of the high fat diet was necessary to limit adiposity in the HF-R group (Fig. 2C).
Figure 2.
Restricting a high fat diet in C57BL/6J mice is sufficient to reduce adiposity. (A) Body weights of C57BL/6J mice on low fat (LF), high fat (HF) and restricted high fat (HF-R) diets were measured weekly for 12 weeks. Mice in HF-R group (grey graph) display body weights similar to LF groups. (B) Fat mass was measured in LF, HF and HF-R groups by NMR biweekly. HF-R group shows reduced adiposity, comparable to those in LF group. (C) Comparison of food intake shows the degree of restriction needed in HF-R group to maintain body weight and limit adiposity. a p< 0.05 LF vs. HF, b p< 0.05 LF vs. HF-R, * p< 0.05 HF vs. HF-R, n=8 mice per group.
3.3 High fat diet restriction attenuates renal oxidative/nitrosative stress markers in C57BL/6J mice.
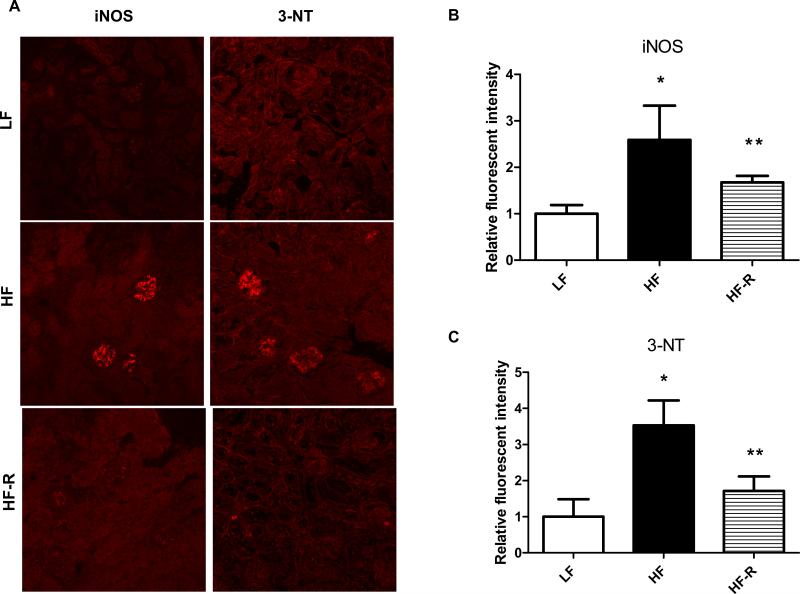
As adiposity is often associated with proinflammation, with increased levels of iNOS and protein nitration, next we investigated the levels of iNOS and 3-nitrotyrosine in the kidneys of each feeding group. We have used confocal microscopy to localize these changes in the kidneys of LF, HF and HF-R groups. In agreement with our previous data, HF groups had increased glomerular iNOS and nitrotyrosine levels after 12 weeks of feeding (Fig. 3). Importantly, when adiposity was reduced due to HF-R feeding, levels of these markers of oxidative/nitrosative stress were also significantly decreased in the HF-R kidneys (Fig. 3).
Figure 3.
Oxidative/nitrosative stress markers in the kidney of C57BL/6J mice on LF, HF and HF-R feeding. (A) Representative confocal microscopy pictures show increased iNOS and 3-nitrotyrosine stainings after 12 weeks of HF feeding, and attenuated levels of iNOS and 3-NT when high fat feeding was restricted (HF-R). (B) and (C) shows fluorescent intensity pixel analysis of the stainings. In each group, fluorescent intensities were analyzed with an Image J program. * p< 0.05 vs. LF, ** p< 0.05 vs. HF, n=20-30 glomeruli.
3.4 High fat diet restriction does not reduce elevated renal mitochondrial respiration.
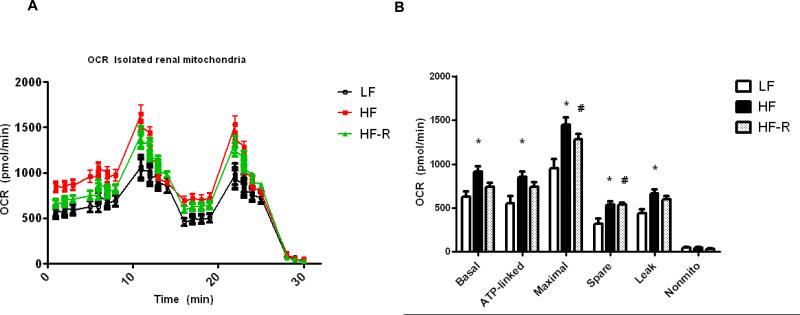
As a follow up based on one of our previous studies (22), we sought to determine whether restricting a high fat diet in C57BL/6J mice will attenuate increased renal mitochondrial oxygen consumption, which we have previously interpreted as a sign of lipid overfueling into the kidney mitochondria. In agreement with our earlier studies, mitochondria isolated freshly from HF groups showed increased mitochondrial basal respiration as well as higher ATP-linked and spare respiratory capacity (Fig. 4). When the high fat diet was restricted as described to decrease adiposity, interestingly, renal mitochondria from HF-R groups (after 12 weeks of feeding) still showed higher tendencies of basal and ATP-linked respiration, and significantly higher maximal and spare respiratory capacity when compared to LF groups (Fig. 4A-B).
Figure 4.
Renal mitochondrial bioenergetics in isolated kidney mitochondria. Experiments were run on a SeaHorse XF24 extracellular flux analyzer to obtain bioenergetic profiles from LF, HF and HF-R groups of C57BL/6J mice at 12 weeks. (A) Representative XF24 oxygen consumption rate graph shows increased mitochondrial respiration in both HF and HF-R groups. (B) Respiratory parameters (basal, ATP-linked, maximal, spare, leak and non-mitochondrial respiration) were analyzed from the SeaHorse graph data and compared. Each group contained n=6 mice and fresh renal mitochondrial preparation from each mouse. * p< 0.05 LF vs. HF, # p<0.05 LF vs HF-R.
3.5 DBA/2J mice develop adiposity, kidney fibrosis and albuminuria on high fat diet.
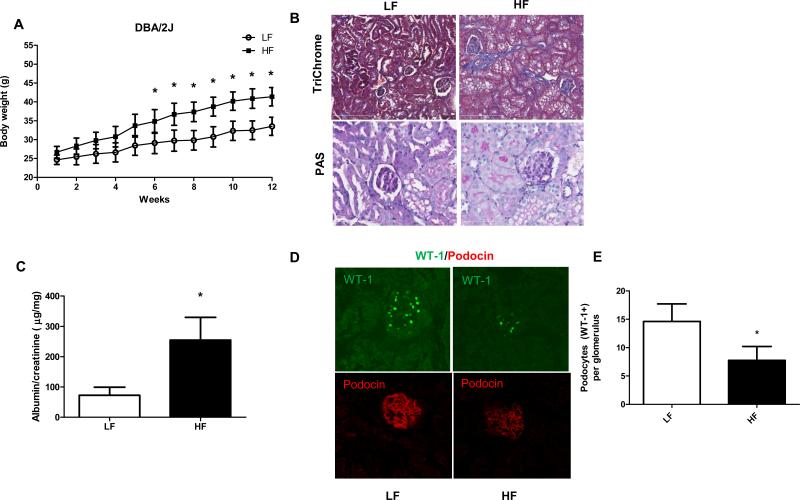
Next, we placed mice from the DBA/2J strain on high fat diets to investigate their renal phenotype in a diet induced obesity model and to compare changes to the more resistant C57BL/6J strain. When fed a high fat diet for 12 weeks, DBA/2J mice also developed obesity (Fig. 5A). In contrast with the C57BL/6J model, the more renal sensitive DBA/2J mice developed significant changes starting at 12 weeks of HF feeding (45 % kcal lard diets). Fig. 5B shows representative micrographs of kidney sections from LF and HF groups of DBA/2J mice stained with Periodic acid-Schiff (PAS) and TriChrome stainings. PAS staining did not reveal significant mesangial expansion changes between groups but the TriChrome staining displayed collagen deposits and fibrosis. More importantly, DBA/2J mice also developed albuminuria, which did not reach the levels observed in diabetic models but changes were significant (Fig. 5C). Albuminuria was measured from 24 hr urine samples collected in metabolic cages and expressed as albumin/creatinine ratios (described in the AMDCC standard).
Figure 5.
Obesity, general histology, albuminuria and podocyte markers in DBA/2J mice after 12 weeks of high fat diet feeding. (A) DBA/2J mice develop obesity as shown by weekly body weight measurements in LF and HF groups. (B) Representative photomicrographs of TriChrome and periodic acid-Schiff (PAS) stained kidney sections from DBA/2J mice on LF or HF diet at 12 weeks. While low grade fibrosis is seen in high fat diet –fed kidneys, no differences in mesangial space expansion could be detected by PAS staining. (C) Albumin/creatinine ratios in DBA/2J mice on LF and HF diets. (D) Representative IF staining of the slit diaphragm proteins WT-1 and podocin in LF and HF fed mice, detected by confocal microscopy. (E) Analysis and comparison of WT-1 positive cells in LF and HF groups of DBA/2J mice. * p <0.05 vs. LF, n= 20-30 glomeruli or 4-6 mice.
3.6 DBA/2J mice have podocyte loss and increased oxidative stress markers on high fat diet.
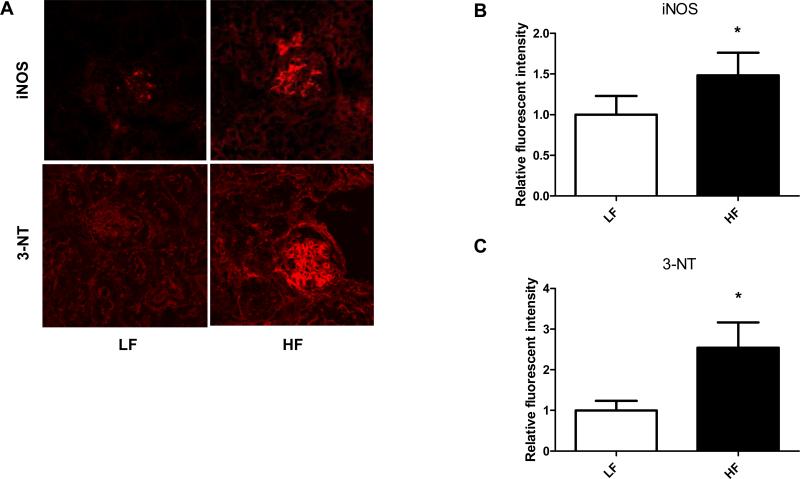
Since early podocyte loss precedes more severe albuminuria and is a typical feature in obesity related CKD, we have investigated potential podocyte loss in the obese DBA/2J model. To determine loss of podocytes, two different slit diaphragm protein specific stainings were used: WT-1 and podocin, combined with confocal microscopy detection and analysis. We have also asked whether the DBA/2J strain shows elevated levels of iNOS and 3-nitrotyrosine on high fat diet, similarly to C57BL/6J strain. DBA/2J mice on high fat diets started to show loss of WT-1 positive cells (podocytes) after 12 weeks of feeding, and less intense podocin staining (Fig. 5D-E). The number of WT-1 positive cells was counted in several glomeruli across the samples and were compared to LF group. These mice on HF also demonstrated elevated iNOS and 3-NT levels, localizing in the glomeruli (Fig. 6A-C).
Figure 6.
Oxidative/nitrosative stress markers in the kidney of DBA/2J mice on LF and HF diets. (A) Representative confocal microscopy pictures show increased iNOS and 3-nitrotyrosine stainings after 12 weeks of HF feeding. (B) and (C) Fluorescent intensity pixel analysis of the stainings. In each group, fluorescent intensities were analyzed with an Image J program. * p <0.05 vs. LF, n= 20-30 glomeruli.
3.7 DBA/2J mice develop podocyte insulin resistance when feeding a high fat diet.
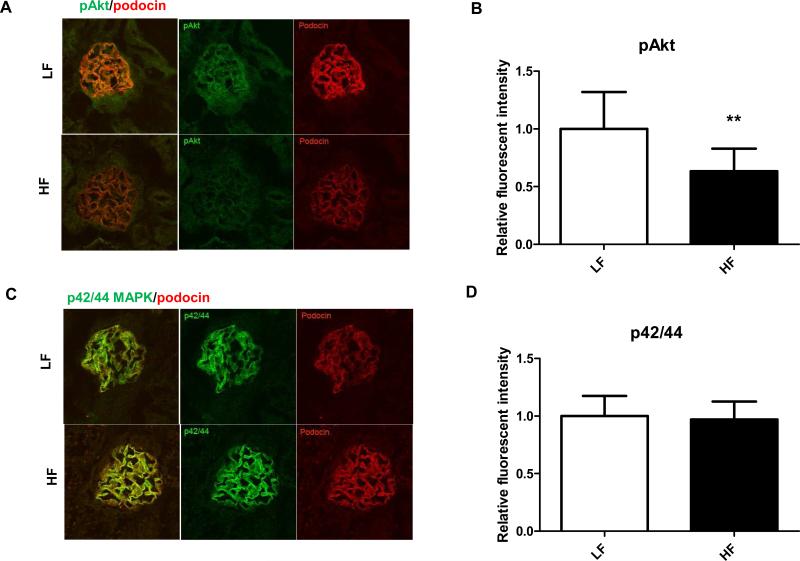
As DIO models typically show signs of whole body insulin resistance, here we have also investigated whether renal podocyte insulin resistance is present and associated with obesity in the DBA/2J model. For insulin signaling, samples were used from those LF and VHF cohorts that received insulin injection 15 minutes before euthanasia and kidney harvesting. Here, we have determined the amount of Akt phosphorylation as well as the compensatory p42/44 MAPK phosphorylation in DBA/2J kidneys and their colocalization with podocin. DBA/2J mice on 60 % kcal VHF diet show impaired Akt phosphorylation in podocytes when compared to low fat groups, as early as 24 weeks after the initiation of feeding (Fig. 7A-B). Interestingly, they maintained p42/44 MAPK phosphorylation in the glomeruli (Fig. 7C-D). Stainings were colocalized with podocin (red) to display and confirm location of pAkt and p42/44 MAPK in podocytes.
Figure 7.
Alterations of glomerular insulin signaling in HF fed DBA/2J mice. (A) Representative confocal microscopy and IF staining of pAkt (green) and colocalization with podocin (red) after insulin stimuli in LF and HF groups. (B) Analysis of fluorescent intensities of pAkt staining. (C) Representative confocal microscopy and IF staining of p42/44 MAPK (green) and colocalization with podocin (red) in LF and HF groups. (B) Analysis of fluorescent intensities of p42/44 MAPK staining. N=20-30 glomeruli in each group, analysis was done using Image J program and comparing relative fluorescent intensities. * p< 0.05 vs LF.
4. Discussion
While diabetic nephropathy is a major complication of diabetes mellitus, and correlates best with mortality, obesity and metabolic syndrome itself poses elevated risk for the development of chronic kidney disease as well (4, 15). Albuminuria is now considered as an additional hallmark in metabolic syndrome (24). The challenge in the field is to mimic the human disease properly and as close as possible with animal models, both in DN and obesity related CKD. The purpose of this hypothesis paper is therefore to compare two known mouse models of DIO with regards to their sensitivity to renal injury, and demonstrate our positive and negative findings and challenges in finding a model for studying obesity related kidney disease. Since the C57BL/6J strain is one of the best characterized models for DIO, we wanted to compare this mouse model to a more renal sensitive strain that still develops obesity, hence the choice for the DBA/2J mice. A myriad of previous studies described the effects of HF diet feeding on C57BL/6J mice, therefore we are not discussing the details herein, except that mice in our hands developed the typical characteristics after 12 weeks of feeding. This includes increased adiposity, hyperinsulinemia but besides larger glomeruli (glomerulomegalia) and increases in renal mitochondrial respiration and markers of renal oxidative stress (as described earlier in (22)), kidneys were relatively resistant. Based on the experimental design of Uzu et al. (21), next we restricted HF feeding to control body weight gain and adiposity. In these experiments, mice maintained body weight (Fig. 2) but were still eating diets with a high percentage of lard. With this design, we hoped to reveal further details on whether it is adiposity or the feeding of increased lipid content that affects changes in mitochondrial lipid handling and renal cellular oxidative stress in C57BL/6J mice. Unexpectedly, with HF-R, mitochondrial respiration remained high while cellular oxidative stress markers decreased.
Increased, rather than decreased mitochondrial oxygen consumption in renal cortex mitochondria from HF diet fed mice, even when HF is restricted is particularly puzzling (Fig. 4). It could be interpreted as increased lipid “fueling” into the mitochondria, which may then use up all the reductants. Our data also suggest that for this potential mitochondrial redox imbalance, the lipid diet itself, rather than adiposity is more important in the kidney. This lipid “overfueling” would be consistent with the lipid overload theory of the skeletal muscle mitochondria (25-27). Lipid overload is a concept that defines an oversupply of lipid products to the mitochondria. The concept has originally been proposed first as the Randle hypothesis (28). This lipid overload presents a burden on the mitochondria (22, 25). Initially, lipotoxicity was thought to be via a slowdown of β oxidation, leading to the accumulation of various lipid products. Novel ideas suggest that it may be an accelerated but incomplete β oxidation due to oversupply of lipids in obesity that accumulates partially oxidized products. As most of these lipid substrates and incompletely oxidized products feed typically to mitochondrial complex II, this oversupply will foster a reducing environment on the electron transport chain complexes and a back pressure on complex I leading to excess superoxide production. Future studies are warranted to determine whether this phenomenon may be related to the development of any renal pathology in obesity and metabolic syndrome. The C57BL/6J model may not be sensitive to renal injury per se, but its susceptibility to obesity combined with the easily available transgenic technology could serve as basis to create novel knockouts of metabolic enzymes involved in mitochondrial lipid handling in tubular cells and/or in glomerular epithelial cells, podocytes.
On the other hand, increased adiposity seems to be the driver for increased renal cellular oxidative/nitrosative stress. To determine whether cellular reactive oxygen and nitrogen species production are associated with obesity in the kidney, we used immunofluorescent detection to localize iNOS protein levels, protein damage and protein nitration. These changes can affect important enzymes and their function (29, 30). Protein nitration was determined using 3-nitrotyrosine staining. Increased iNOS and nitrotyrosine levels associated with HF feeding were significantly decreased when adiposity was restricted by the controlled feeding (Fig. 3). Expansion of the adipose tissue is correlated with increased proinflammation and an increase in circulating cytokine levels (31, 32). This, in turn may regulate NFκB and therefore iNOS expression (33). Our data suggest that whole body adiposity may be an important driver of renal iNOS levels and subsequent increase of nitrated protein products. In light of these data, it is still puzzling that none of these phenomena alone seems to be sufficient enough to cause significant renal pathology in the C57BL/6J mice, at least on these lard based diets and within the time frames examined in our studies. It is important to note, that in other studies, when the diet contains sucrose, as a Western style diet, the C57BL/6J strain does develop significant renal injury (12). In these models, dysregulation of AMPK was suggested to be a major mechanism.
The DBA/2J strain certainly is more renal sensitive, even when fed only lard based high fat diets. In our experiments, male mice of this strain has developed significant body weight gain and obesity in 12 weeks of HF feeding, similarly to the C57BL/6J mice (Fig. 5A). Histological analysis suggests that these mice also develop fibrosis, though this was not consistent across the experiments and was not observed in all mice. Importantly though, albuminuria and early podocyte loss was observed in all cohorts (Fig. 5C-E). This may be a useful trait in the DBA/2J strain, and similar to human obesity related development of FSGS, where loss of podocyte cells is an early event, which precedes more severe albuminuria. Obese DBA/2J mice also had increased iNOS and 3-nitrotyrosine levels, similarly to the C57BL/6J strain (Fig. 6). Since both strains displayed these features, but only the DBA/2J mice develops significant renal changes on HF diets, the data suggests that initial increases in renal oxidative/nitrosative stress parameters may be only an accompanying feature related to adiposity, but not necessarily causative to renal pathology.
Since the DBA/2J strain developed albuminuria and early podocyte loss with DIO, we fed the diets for a longer time, and also included a 60% kcal very high fat diet to accelerate the phenotype. This allowed us to investigate alterations in podocyte insulin signaling and potential podocyte insulin resistance. Podocytes in the kidneys of the DBA/2J strain showed a decreased ability to phosphorylate Akt (Fig. 7A-B), while the compensatory signaling pathway, p42/44 MAPK remained intact (Fig. 7C-D). Podocyte insulin resistance and the role of Akt is a relatively new area of interest (34). The Akt/PI3K axis has an integrative role in podocytes controlling insulin sensitivity and cell survival pathways (35, 36). It has been shown that podocytes from db/db mice at a relatively young age (when db/db mice had mild albuminuria and no mesangial expansion) lose their ability to phosphorylate Akt and that this promotes cell death (37). Slit diaphragm proteins and the Akt signaling pathway also crosstalk, for example WT-1 activates nephrin transcription and nephrin directly has an effect on Akt (38, 39). Our observations in obese DBA/2J mice add to this body of literature and suggest that similar events may be triggered in diet induced obesity. Loss of WT-1 positive cells in the DBA/2J mouse may contribute to impairments in podocyte Akt signaling, and a decreased ability of Akt phosphorylation upon insulin stimuli. These characteristics may serve as an advantage to use the DBA/2J strain for studies in obesity related CKD models where podocyte insulin resistance, podocyte loss and albuminuria are key features. A disadvantage of the strain is that DBA/2J mice are more fragile and may develop full blown diabetes after prolonged feeding of high fat diets. Caution should be used if this happens, as from that time point, the effects of DIO or diabetes on renal injury and podocyte insulin sensitivity would not be distinguishable.
4.1 Conclusion
In summary, by comparing these two DIO susceptible mouse strains, we hope to highlight the challenges with these models, as well as the potential advantages and disadvantages and encourage further critical evaluation of mouse models for obesity and metabolic syndrome related renal injury. Our hypothesis is that while the C57BL/6J strain is relatively resistant to renal damage, its mitochondrial lipid handling on high fat diets combined with a metabolic knockout model may offer advantages to further understand how disturbances in lipid metabolism could contribute to the progression of kidney disease. The relative resistance of the model may also reveal pathways to decipher why these mice do not develop severe kidney injury and how this could be turned into an advantage in combating the human disease. The DBA/2J strain has been suggested to be a building block for future studies (11), perhaps with knock-in models encoding traits of human kidney disease, and our data on its HF diet related albuminuria, podocyte loss and insulin resistance highlights that this model could also be beneficial in studying obesity related CKDs.
Highlights.
C57BL/6J mice are relatively resistant to renal injury on high fat diets, while DBA/2J mice are more sensitive.
Despite their resistance, B6 mice develop mitochondrial changes and cellular redox imbalance.
DBA/2J mice develop albuminuria, fibrosis and podocyte loss on high fat diets.
Obese DBA/2J mice display podocyte insulin resistance.
Both strains have elevated renal iNOS and 3-nitrotyrosine levels, which seem to accompany increased adiposity.
Acknowledgements
Research contributing to this manuscript from the Stadler lab was partially supported by a NORC Pilot and Feasibility Award (through NIH P30DK072476) and a DiaComp Pilot and Feasibility Award (14GHSU1393, K.S.). Confocal images were taken at the Pennington Cell Biology and Imaging Core, supported by the NORC and COBRE Grants (NIH P20-RR021945 and P30-DK072476). S.W. was supported by a T32 Fellowship Award (T32 AT004094).
Footnotes
Publisher's Disclaimer: This is a PDF file of an unedited manuscript that has been accepted for publication. As a service to our customers we are providing this early version of the manuscript. The manuscript will undergo copyediting, typesetting, and review of the resulting proof before it is published in its final citable form. Please note that during the production process errors may be discovered which could affect the content, and all legal disclaimers that apply to the journal pertain.
References
- 1.Abrass CK. Overview: obesity: what does it have to do with kidney disease? J Am Soc Nephrol. 2004;15(11):2768–2772. doi: 10.1097/01.ASN.0000141963.04540.3E. [DOI] [PubMed] [Google Scholar]
- 2.Chen J, et al. Insulin resistance and risk of chronic kidney disease in nondiabetic US adults. J Am Soc Nephrol. 2003;14(2):469–477. doi: 10.1097/01.asn.0000046029.53933.09. [DOI] [PubMed] [Google Scholar]
- 3.Chen J, et al. The metabolic syndrome and chronic kidney disease in U.S. adults. Ann Intern Med. 2004;140(3):167–174. doi: 10.7326/0003-4819-140-3-200402030-00007. [DOI] [PubMed] [Google Scholar]
- 4.Bagby SP. Obesity-initiated metabolic syndrome and the kidney: a recipe for chronic kidney disease? J Am Soc Nephrol. 2004;15(11):2775–2791. doi: 10.1097/01.ASN.0000141965.28037.EE. [DOI] [PubMed] [Google Scholar]
- 5.Coresh J, et al. Prevalence of chronic kidney disease in the United States. JAMA. 2007;298(17):2038–2047. doi: 10.1001/jama.298.17.2038. [DOI] [PubMed] [Google Scholar]
- 6.Kramer H, et al. Obesity and prevalent and incident CKD: the Hypertension Detection and Follow-Up Program. Am J Kidney Dis. 2005;46(4):587–594. doi: 10.1053/j.ajkd.2005.06.007. [DOI] [PubMed] [Google Scholar]
- 7.Henegar JR, Bigler SA, Henegar LK, Tyagi SC, Hall JE. Functional and structural changes in the kidney in the early stages of obesity. J Am Soc Nephrol. 2001;12(6):1211–1217. doi: 10.1681/ASN.V1261211. [DOI] [PubMed] [Google Scholar]
- 8.Forbes JM, Coughlan MT, Cooper ME. Oxidative stress as a major culprit in kidney disease in diabetes. Diabetes. 2008;57(6):1446–1454. doi: 10.2337/db08-0057. [DOI] [PubMed] [Google Scholar]
- 9.Tan AL, Forbes JM, Cooper ME. AGE, RAGE, and ROS in diabetic nephropathy. Semin Nephrol. 2007;27(2):130–143. doi: 10.1016/j.semnephrol.2007.01.006. [DOI] [PubMed] [Google Scholar]
- 10.Susztak K, Raff AC, Schiffer M, Bottinger EP. Glucose-induced reactive oxygen species cause apoptosis of podocytes and podocyte depletion at the onset of diabetic nephropathy. Diabetes. 2006;55(1):225–233. [PubMed] [Google Scholar]
- 11.Brosius FC, 3rd, et al. Mouse models of diabetic nephropathy. J Am Soc Nephrol. 2009;20(12):2503–2512. doi: 10.1681/ASN.2009070721. [DOI] [PMC free article] [PubMed] [Google Scholar]
- 12.Decleves AE, Mathew AV, Cunard R, Sharma K. AMPK mediates the initiation of kidney disease induced by a high-fat diet. J Am Soc Nephrol. 2011;22(10):1846–1855. doi: 10.1681/ASN.2011010026. [DOI] [PMC free article] [PubMed] [Google Scholar]
- 13.Wei P, Lane PH, Lane JT, Padanilam BJ, Sansom SC. Glomerular structural and functional changes in a high-fat diet mouse model of early-stage Type 2 diabetes. Diabetologia. 2004;47(9):1541–1549. doi: 10.1007/s00125-004-1489-1. [DOI] [PubMed] [Google Scholar]
- 14.Jiang T, et al. Diet-induced obesity in C57BL/6J mice causes increased renal lipid accumulation and glomerulosclerosis via a sterol regulatory element-binding protein-1c-dependent pathway. J Biol Chem. 2005;280(37):32317–32325. doi: 10.1074/jbc.M500801200. [DOI] [PubMed] [Google Scholar]
- 15.Ix JH, Sharma K. Mechanisms linking obesity, chronic kidney disease, and fatty liver disease: the roles of fetuin-A, adiponectin, and AMPK. J Am Soc Nephrol. 2010;21(3):406–412. doi: 10.1681/ASN.2009080820. [DOI] [PMC free article] [PubMed] [Google Scholar]
- 16.Decleves AE, Sharma K. Obesity and kidney disease: differential effects of obesity on adipose tissue and kidney inflammation and fibrosis. Curr Opin Nephrol Hypertens. 2015;24(1):28–36. doi: 10.1097/MNH.0000000000000087. [DOI] [PMC free article] [PubMed] [Google Scholar]
- 17.Sharma K. Obesity, oxidative stress, and fibrosis in chronic kidney disease. Kidney international supplements. 2014;4(1):113–117. doi: 10.1038/kisup.2014.21. [DOI] [PMC free article] [PubMed] [Google Scholar]
- 18.Wang XX, et al. The farnesoid X receptor modulates renal lipid metabolism and diet-induced renal inflammation, fibrosis, and proteinuria. Am J Physiol Renal Physiol. 2009;297(6):F1587–1596. doi: 10.1152/ajprenal.00404.2009. [DOI] [PMC free article] [PubMed] [Google Scholar]
- 19.Weinberg JM. Mitochondrial biogenesis in kidney disease. J Am Soc Nephrol. 2011;22(3):431–436. doi: 10.1681/ASN.2010060643. [DOI] [PubMed] [Google Scholar]
- 20.Dugan LL, et al. AMPK dysregulation promotes diabetes-related reduction of superoxide and mitochondrial function. J Clin Invest. 2013;123(11):4888–4899. doi: 10.1172/JCI66218. [DOI] [PMC free article] [PubMed] [Google Scholar]
- 21.Deji N, et al. Structural and functional changes in the kidneys of high-fat diet-induced obese mice. Am J Physiol Renal Physiol. 2009;296(1):F118–126. doi: 10.1152/ajprenal.00110.2008. [DOI] [PubMed] [Google Scholar]
- 22.Ruggiero C, Ehrenshaft M, Cleland E, Stadler K. High-fat diet induces an initial adaptation of mitochondrial bioenergetics in the kidney despite evident oxidative stress and mitochondrial ROS production. Am J Physiol Endocrinol Metab. 2011;300(6):E1047–1058. doi: 10.1152/ajpendo.00666.2010. [DOI] [PMC free article] [PubMed] [Google Scholar]
- 23.Rossmeisl M, Rim JS, Koza RA, Kozak LP. Variation in type 2 diabetes--related traits in mouse strains susceptible to diet-induced obesity. Diabetes. 2003;52(8):1958–1966. doi: 10.2337/diabetes.52.8.1958. [DOI] [PubMed] [Google Scholar]
- 24.Palaniappan L, Carnethon M, Fortmann SP. Association between microalbuminuria and the metabolic syndrome: NHANES III. American journal of hypertension. 2003;16(11 Pt 1):952–958. doi: 10.1016/s0895-7061(03)01009-4. [DOI] [PubMed] [Google Scholar]
- 25.Koves TR, et al. Mitochondrial overload and incomplete fatty acid oxidation contribute to skeletal muscle insulin resistance. Cell Metab. 2008;7(1):45–56. doi: 10.1016/j.cmet.2007.10.013. [DOI] [PubMed] [Google Scholar]
- 26.Muoio DM, Neufer PD. Lipid-induced mitochondrial stress and insulin action in muscle. Cell Metab. 2012;15(5):595–605. doi: 10.1016/j.cmet.2012.04.010. [DOI] [PMC free article] [PubMed] [Google Scholar]
- 27.Muoio DM, Newgard CB. Obesity-related derangements in metabolic regulation. Annu Rev Biochem. 2006;75:367–401. doi: 10.1146/annurev.biochem.75.103004.142512. [DOI] [PubMed] [Google Scholar]
- 28.Randle PJ, Garland PB, Hales CN, Newsholme EA. The glucose fatty-acid cycle. Its role in insulin sensitivity and the metabolic disturbances of diabetes mellitus. Lancet. 1963;1(7285):785–789. doi: 10.1016/s0140-6736(63)91500-9. [DOI] [PubMed] [Google Scholar]
- 29.Ischiropoulos H. Biological tyrosine nitration: a pathophysiological function of nitric oxide and reactive oxygen species. Arch Biochem Biophys. 1998;356(1):1–11. doi: 10.1006/abbi.1998.0755. [DOI] [PubMed] [Google Scholar]
- 30.Szabo C, Ischiropoulos H, Radi R. Peroxynitrite: biochemistry, pathophysiology and development of therapeutics. Nat Rev Drug Discov. 2007;6(8):662–680. doi: 10.1038/nrd2222. [DOI] [PubMed] [Google Scholar]
- 31.Marette A. Mediators of cytokine-induced insulin resistance in obesity and other inflammatory settings. Curr Opin Clin Nutr Metab Care. 2002;5(4):377–383. doi: 10.1097/00075197-200207000-00005. [DOI] [PubMed] [Google Scholar]
- 32.Hotamisligil GS, Erbay E. Nutrient sensing and inflammation in metabolic diseases. Nat Rev Immunol. 2008;8(12):923–934. doi: 10.1038/nri2449. [DOI] [PMC free article] [PubMed] [Google Scholar]
- 33.Perreault M, Marette A. Targeted disruption of inducible nitric oxide synthase protects against obesity-linked insulin resistance in muscle. Nat Med. 2001;7(10):1138–1143. doi: 10.1038/nm1001-1138. [DOI] [PubMed] [Google Scholar]
- 34.Welsh GI, et al. Insulin signaling to the glomerular podocyte is critical for normal kidney function. Cell Metab. 2010;12(4):329–340. doi: 10.1016/j.cmet.2010.08.015. [DOI] [PMC free article] [PubMed] [Google Scholar]
- 35.Fornoni A. Proteinuria, the podocyte, and insulin resistance. N Engl J Med. 2010;363(21):2068–2069. doi: 10.1056/NEJMcibr1008395. [DOI] [PubMed] [Google Scholar]
- 36.Godel M, et al. Role of mTOR in podocyte function and diabetic nephropathy in humans and mice. J Clin Invest. 2011;121(6):2197–2209. doi: 10.1172/JCI44774. [DOI] [PMC free article] [PubMed] [Google Scholar]
- 37.Tejada T, et al. Failure to phosphorylate AKT in podocytes from mice with early diabetic nephropathy promotes cell death. Kidney Int. 2008;73(12):1385–1393. doi: 10.1038/ki.2008.109. [DOI] [PubMed] [Google Scholar]
- 38.George B, et al. GSK3beta inactivation in podocytes results in decreased phosphorylation of p70S6K accompanied by cytoskeletal rearrangements and inhibited motility. Am J Physiol Renal Physiol. 2011;300(5):F1152–1162. doi: 10.1152/ajprenal.00373.2010. [DOI] [PubMed] [Google Scholar]
- 39.Guo G, Morrison DJ, Licht JD, Quaggin SE. WT1 activates a glomerular-specific enhancer identified from the human nephrin gene. J Am Soc Nephrol. 2004;15(11):2851–2856. doi: 10.1097/01.ASN.0000143474.91362.C4. [DOI] [PubMed] [Google Scholar]


