Abstract
In recent decades, we have observed a remarkable increase in the rate of caesarean section (CS) in both developed and developing countries, especially in China. According to the World Health Organization (WHO) systematic review, if the increase in CS rate was between 10% and 15%, the maternal and neonatal mortality was decreased. However, above this level, increasing the rate of CS is no longer associated with reduced mortality. To date, no consensus has been reached on the main factors driving the cesarean epidemic. To reduce the progressively increasing rate of CS, we should find indications for the increasing CS rate. The aim of our study was to estimate the change of CS rate of Beijing Obstetrics and Gynecology Hospital and to find the variation of the indications.
From January 1995 to December 2014, the CS rate of Beijing Obstetrics and Gynecology Hospital was analyzed. For our analysis, we selected 14,642 and 16,335 deliveries respectively that occurred during the year 2011 and 2014, to analyze the difference of indications, excluding incomplete data and miscarriages or termination of pregnancy before 28 weeks of gestation because of fatal malformations, intrauterine death, or other reasons.
The average CS rate during the past 20 years was 51.15%. The highest caesarean delivery rate was 60.69% in 2002; however, the caesarean delivery rate declined to 34.53% in 2014. The obviously different indications were caesarean delivery on maternal request and previous CS delivery. The rate of CS due to maternal request in 2014 was decreased by 8.16% compared with the year 2011. However, the percentage of pregnancy women with a previous CS delivery increased from 9.61% to 20.42% in 3 years. Along with the decline of CS rate, the perinatal mortality and the rate of neonatal asphyxia decreased in 2014 compared with that in 2011.
After a series of measures, the CS rate declined indeed. Compared with 2011, the perinatal mortality and the rate of neonatal asphyxia decreased in 2014. Caesarean delivery on maternal request (CDMR) cannot improve the maternal-fetal prognosis compared with the spontaneous vaginal delivery. With the releasing of China's 2 children policy, more CS will be implemented due to previous CS. There is a need for further research that evaluates interventions for increasing VBAC rates that target clinicians.
Keywords: caesarean section on maternal request, caesarean section rate, indications for caesarean section
1. Introduction
1.1. The ever-increasing caesarean section rate
In recent decades, we have observed a remarkable increase in the rate of caesarean section (CS) in both developed and developing countries, especially in China.[1] Based on a survey by the World Health Organization (WHO) on methods of delivery during the period 2007 to 2008, the rates of CS in China and other Asian countries were 46% and 27%, respectively,[2] despite the fact that in 1985, WHO recommended that no region should have a CS rate over 10% to 15%.[1–4] However, CS is an effective lifesaving obstetric surgery, when it is properly performed and required for appropriate medical indications, such as birth asphyxia or prolonged or obstructed labor.[5]
1.2. The disadvantage of caesarean section
According to the WHO systematic review, if the increase in CS rate was between 10% and 15%, the maternal and neonatal mortality was decreased.[3,5] However, above this level, increasing the rate of CS is no longer associated with reduced mortality.[5] What is more, unexpected long-term risks of CS continue to be reported such as ectopic pregnancy, unexplained stillbirth, placenta previa, placenta abruption,[6,7] haemorrhage and hysterectomy, endometriosis, increased hospital readmission and even an increase in gallbladder disease and appendicitis.[8,9] It is also worth noting that increasing evidence suggests that cesarean delivery jeopardizes infant, child, and even adult health.[10,11] It was reported that CS delivery can increase the rate of cardio metabolic disease (childhood overweight and obesity, type 1 diabetes), autoimmune and inflammatory disorders (allergic rhinitis, food allergy and atopy, asthma, celiac disease, inflammatory bowel disease), and autism.[12] Therefore, the overuse of cesareans is a real public health concern and it is urgent to reduce the rate of CS. To date, no consensus has been reached on the main factors driving the cesarean epidemic.[13] To reduce the progressively increasing rate of CS, we should find indications for the increased CS rate. The indications for increased CS, however, also appear to be dependent on the regions and ethnicity studied. And the indications also change as time goes. What is more, after a series of measures such as the implement of Chinese Expert Consensus on Cesarean Section Surgery, the application of new labor, the enhancement the propaganda of benefit of vaginal delivery through the bulletin board, school for pregnant women, birth experience in advance, it was effective for reducing the high rate of caesarean. The aim of our study was to estimate the change of CS rate of Beijing Obstetrics and Gynecology Hospital and find the variation of the indications between 2011 and 2014. We also provide basic reference about the CS rate to find the ways to reduce the CS rate.
2. Materials and methods
2.1. Study design
We selected the CS deliveries of the years 2011 and 2014 to analyze the variations of the indications of each year. For our analysis, we selected 14,642 and 16,335 deliveries respectively that occurred during the years 2011 and 2014, excluding incomplete data and miscarriages or termination of pregnancy before 28 weeks of gestation because of fatal malformations, intrauterine death, or other reasons. Gestational age was determined by the mother's last menstrual period, and it was confirmed by an ultrasound examination within 20 weeks of gestation or by the first trimester ultrasound measurement of the crown-rump length of the fetus. In addition, from January 1995 to December 2014, the CS rate of Beijing Obstetrics and Gynecology Hospital was analyzed.
2.2. Ethics approval
This study was approved by the human ethics committees of the Beijing Obstetrics and Gynecology Hospital and the Capital Medical University.
2.3. Data collection
Questionnaire: The questionnaire included maternal characteristics; gestational, intrapartum, delivery, postpartum and neonatal care, and laboratory tests. Abstracted data included demographic data; gravidity; parity; maternal medical history; specific information on maternal or fetal pregnancy-related complications; gestational age at delivery; method of delivery; all primary indications for CS; the newborn's sex, birth weight, birth length and Apgar score; and the maternal and perinatal outcomes. The primary indications for CS were divided into 3 categories: maternal indications, fetal indications, maternal request with no obstetric reasons. Maternal indications include previous caesarean delivery, elderly primigravida, cephalo-pelvic disproportion, prolonged labor (dystocia), maternal infection, complications of pregnancy such as preeclampsia, oligohydramnios, placenta praevia, placental abruption, presence of cardiac disease, or other maternal pathologies. Fetal indications included precious infant, malpresentation, fetal distress, macrosomia, and multiple fetuses. In fact, most aforementioned indications are not medical, which undoubtedly reflects the great diversity of views of medical staff handling the appropriate indications to schedule CS. To tell them apart, we divided CS deliveries into 2 categories, medical-indicated or non-medical-indicated. The medical-indicated CS category included: fetal distress, prolonged labor (dystocia), preeclampsia or eclampsia or HELLP, cephalo-pelvic disproportion, placenta praevia or placental abruption, oligohydramnios, previous caesarean delivery, multiple gestation, suspected macrosomia, intrauterine infection. The nonindicated CS was defined as a primary CS done on maternal request in the absence of medical indication (CDMR) or a physician documented reason not internationally recognized. These included: maternal age 35 or older; precious fetus-defined as in vitro pregnancy or poor obstetric history (i.e., prior fetal death, neonatal death, chromosomal, or structural abnormality), isolated premature rupture of membranes without fetal heart rate (FHR) abnormalities, nuchal cord seen on ultrasound without FHR abnormalities, high myopia, request for concomitant myomectomy or ovarian cystectomy, or other (isolated chronic hypertension; gestational hypertension; diabetes mellitus without macrosomia). The CS deliveries were recorded as either antepartum or intrapartum. The intrapartum CS that was defined as CS indicated during labor, regardless of whether labor was spontaneous or induced, however, the antepartum CS was defined as CS indicated prior to the onset of labor. The questionnaire was designed by obstetric and statistical experts and finalized after many discussions regarding its feasibility.
Data entry: Data were collected and recorded by specially trained medical staff (obstetrics and gynecology specialists and students). Data were first entered in a hardcopy format and then entered into computer network databases.
Data collection: Data were collected and entered into a computer network database. Case collection and hardcopy data entry were carried out from January to July 2015. Then, data were entered into network database from August to October 2015, and data quality control was carried out during the same period. All personnel that participated in data entry received training beforehand.
Quality control: Specialized personnel were responsible for the second round of quality control assessment.
2.4. Statistical analyses
All data were input into SPSS software (v.19.0; SPSS Inc, Chicago, IL) for statistical analysis. Continuous variables were expressed as the mean ± SD or the median (and interquartile range), as appropriate. Differences in the baseline characteristics between 2 groups were tested using the Student t tests for variables with normal distribution and the Mann–Whitney U tests for variables with skewed distributions. Categorical data were expressed as frequency (percentage) and the differences in frequency between the 2 groups were examined using the χ2 test. A 2-tailed P value of <0.05 was considered significant.
3. Results
3.1. Variations of indications for cesarean section
From January 1995 to December 2014, the CS rate of Beijing Obstetrics and Gynecology Hospital is shown in Fig. 1. The average CS rate during the past 20 years was 51.15%. The highest caesarean delivery rate was 60.69% in 2002; however, the caesarean delivery rate declined to 34.53% in 2014. The result was so amazing that we want to find the true reason for the huge decrease. So we randomly selected the CS deliveries of the year 2011 in contrast to the CS deliveries of the year 2014(n = 7477 and 5641) respectively to analyze the variations of the indications of each year.
Figure 1.
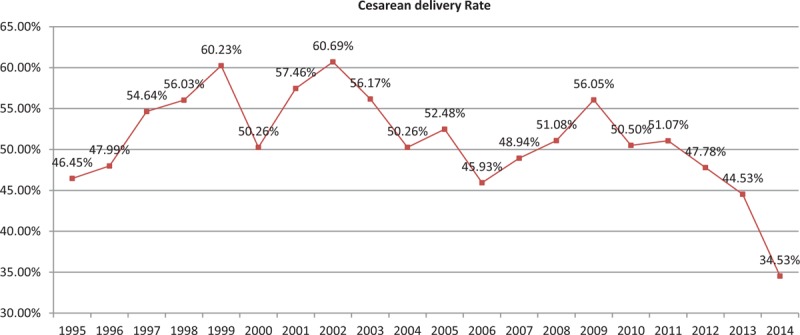
Trend of cesarean delivery over a 20-year period 1995 to 2014 at Beijing Gynecology and Obstetrics Hospital.
The CS rate in 2011 was 51.07%. The medical-indicated caesarean section deliveries accounted for 72.39% of CS deliveries in 2011. It was worth noting that although the CS rate in 2014 decreased to 34.53%, the proportion of medical-indicated CS deliveries increased (P < 0.01). It accounted for 86.95% of CS deliveries. The intrapartum CS accounted for 32.23% of CS deliveries in 2011; however, it accounted for 39.02% of CS deliveries in 2014 (P < 0.01).
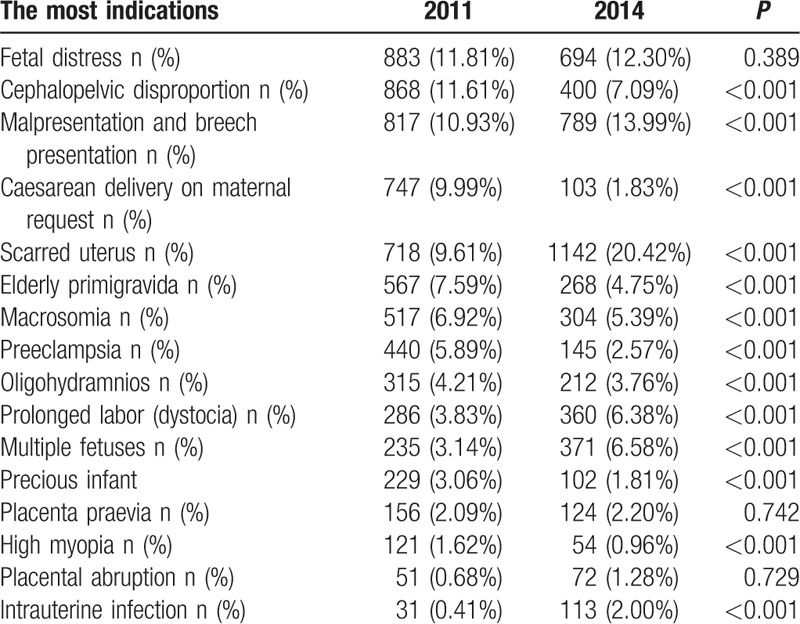
As shown in Figs. 2 and 3, the most common indications for CS in 2011 were fetal distress (11.81%), followed by cephalo-pelvic disproportion (11.61%), malpresentation and breech presentation (10.93%), maternal request (9.99%), previous caesarean delivery (9.61%), elderly primigravida (7.59%), macrosomia (6.92%), preeclampsia (5.89%), oligohydramnios(4.21%), prolonged labor (dystocia) (3.83%), multiple fetuses (3.14%), precious infant (3.06%), placenta praevia (2.09%), high myopia (1.62%), placental abruption (0.68%), intrauterine infection (0.54%) and “other indications” (6.51%). However, the most common indications for CS in 2014 were previous caesarean delivery (20.24%), followed by malpresentation and breech presentation (13.99%), fetal distress (12.30%), cephalo-pelvic disproportion (7.09%), multiple fetuses (6.58%), prolonged labor (dystocia) (6.38%), macrosomia (5.39%), elderly primigravida (4.75%), oligohydramnios (3.76%), preeclampsia (2.57%), placenta praevia (2.20%), intrauterine infection (2.00%), maternal request (1.83%), precious infant (1.81%), placental abruption (1.28%), high myopia (0.96%), and “other indications” (6.88%) (Table 1).
Figure 2.
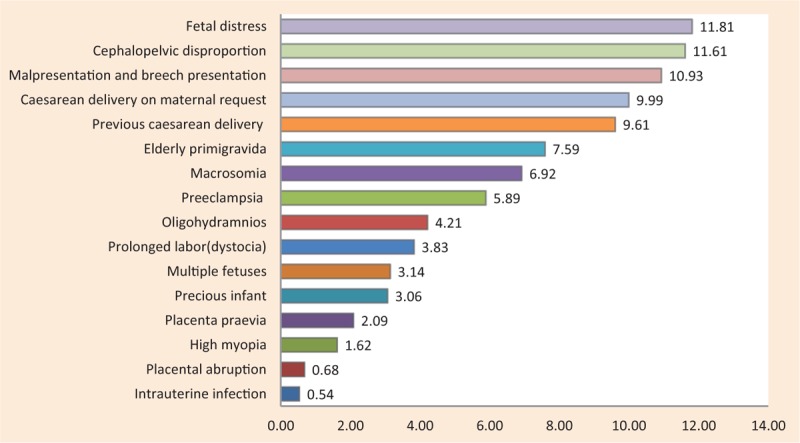
The main indications for caesarean section in 2011.
Figure 3.

The main indications for caesarean section in 2014.
Table 1.
The differences of indications for caesarean section between the years 2011 and 2014.
3.2. Maternal-fetal prognosis
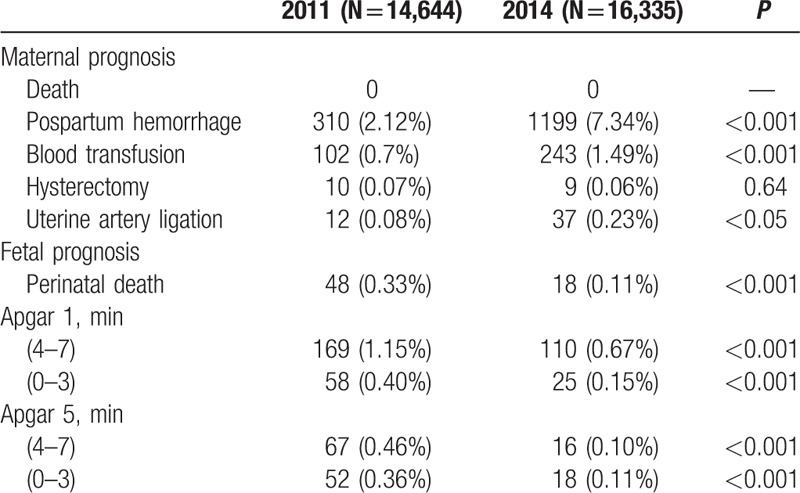
As was shown in Table 2, the rate of postpartum hemorrhage of 2014 was higher than that of 2011 (7.34% vs 2.12%, P < 0.001). Meanwhile, the rate of blood transfusion and uterine artery ligation in 2014 was higher than that in 2011 (P < 0.05). However, perinatal mortality and the rate of neonatal asphyxia was lower in the year of 2014 compared with the year of 2011 (P < 0.001).
Table 2.
The differences of maternal-fetal prognosis for caesarean section between the years 2011 and 2014.
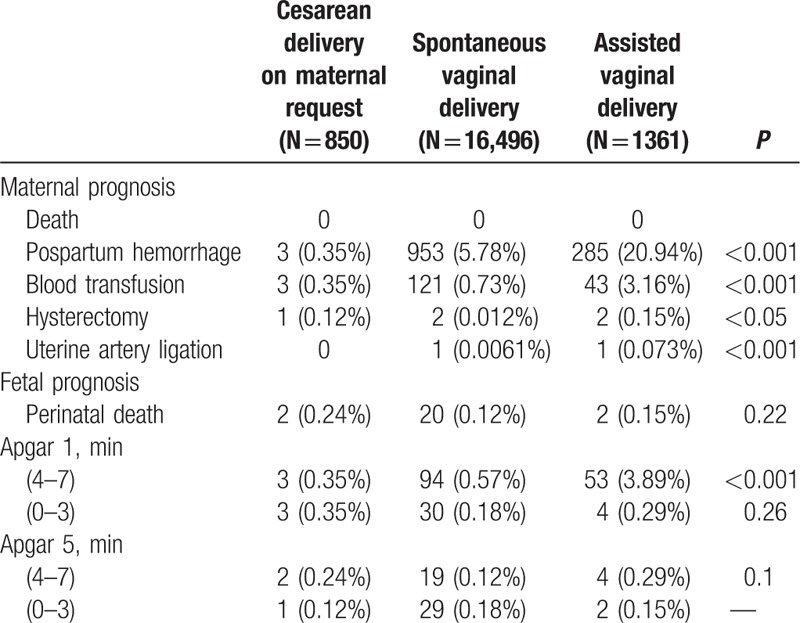
After analyzing the factors contributing to postpartum hemorrhage, we found that the rate of scarred uterus and emergency CS transited from maternity wards was higher in 2014 (Table 3). The population was divided into 3 groups: CS on maternal request, spontaneous vaginal delivery, and assisted vaginal delivery. As is shown in Table 4, the rate of postpartum hemorrhage was highest in the group of assisted vaginal delivery, followed by spontaneous vaginal delivery, CS on maternal request (P < 0.001). There was no difference in the rate of blood transfusion and hysterectomy between the groups of spontaneous vaginal delivery and CS on maternal request. As for fetal prognosis, there was no difference in perinatal mortality and the rate of neonatal asphyxia between the groups of spontaneous vaginal delivery and CS on maternal request.
Table 3.
The factors accounting for postpartum hemorrhage between the years 2011 and 2014.

Table 4.
The comparison among different delivery modes.
3.3. Population characteristics
As shown in Table 5, pregnancy women with age between 25 and 29 years had the lowest CS rate and pregnancy women 35 years old or greater had the highest CS rate. Women 35 years old or greater had as high as 69.08% CS rate.
Table 5.
The characteristics of the study populations.

Based on the prepregnancy BMI and total weight gain of gestating women, we found that obese women had a higher rate of CS (P < 0.01). Women with prelabor BMI between 18.5 and 24.9 had the lowest CS rate. Resident women had a higher CS rate than migrant women (44.58% vs 39.24%, P < 0.01). Additionally, nulliparous women had lower rate of CS and medical indicated CS than parous women (P < 0.01) (Table 5). As shown in Table 5, male infants were more likely to be delivered by CS than female infants (43.6% vs 40.93%, P < 0.01). What is more, male infants were also associated with a higher rate of operative intervention in vaginal deliveries than female infants (e.g., vacuum and forceps) (4.9% vs 3.83%, P < 0.01). Although there was no correlation between the sex of infant and the rate of nonmedical indicated CS, male infants had a higher rate of delivery by CS with medical indications compared with female infants (34.69% vs 31.74%, P < 0.01). Women who conceived by IVF-ET had a higher CS rate than those who conceived spontaneously (76.03% vs 41.29%, P < 0.01). Women with fetus (weight<2500 g or weight>4000 g) were more likely to have CS than those with normal weight fetus (P < 0.01). CS was more likely in women with pregnancy complications such as multiple gestation, hypertension disorder, preterm birth, oligohydydrammios, late pregnancy bleeding, or birth weight >4000 g (P < 0.01). Women with preterm rupture of membranes or GDM were more likely to have a vaginal delivery (P < 0.01).
4. Discussion
Our study showed that the average CS rate during the past 20 years was 51.15%. The highest caesarean delivery rate was 60.69% in 2002. It has beyond the suggested CS rate 15% far away. It was amazing to find that the caesarean delivery rate declined to 34.53% in 2014. It made me to explore the true reason for the huge decline of the CS rate.
We can figure out easily in Fig. 4 that the obviously different indications were caesarean delivery on maternal request and previous caesarean delivery. The rate of CS due to maternal request in 2014 was decreased by 8.16% compared with the year 2011. However, the percentage of pregnancy women with a previous caesarean delivery increased from 9.61% to 20.42% in 3 years. The result was similar to a survey conducted in a teaching hospital in China that showed the rate of CS because of previous CS increased from 7.22% to 20.9% in 3 years.[1,14] Similarly, in 2006, Tang et al reported that the percentage of pregnant women with a previous caesarean delivery increased from 18% in 1992 to 40% in 2000 in urban China.[1,15] Therefore, we can figure out that CS for women with at least 1 previous CS contributed greatly to the historic rise in the overall CS rate.[16,17] In the Robson et al classification for CS, Group 5 (multiparous women with at least 1 CS and a single cephalic pregnancy at ≥37 weeks) makes the largest contribution to overall CS rates.[16,18,19] The result deserved our attention. China had instituted a policy this year to allow 2 children each family in November in 2015. It might mean the percentage of pregnant women with a previous CS delivery will increase greatly. The CS rate will increase if nothing has been undertaken. According to several surveys we can figure out that compared with a repeat elective caesarean VBAC is a reasonable and safe option for most women with previous CS.[20–22] VBAC is defined as a vaginal delivery by a woman who has had a previous caesarean delivery. It is also associated with lower maternal mortality and less overall morbidity for mothers and infants.[20,22] Of women who chose a planned VBAC, the rate of VBAC success ranged from 70% to 87%, which was similar to general vaginal birth rates.[20] Despite this fact, many women who had a previous CS will choose a routine CS subsequently.[20] A study showed that the overall CS rate in United States has increased by over 40% since 1996, reflecting 2 concurrent trends: an increase in the primary rate (14.6% to 20.6%) and a steep decline in the VBAC rate (28.3% to 9.2%).[23] Our study had nearly no VBAC. A decrease in the VBAC rate implies a corresponding increase in the repeat cesarean rate, which has now reached almost 91%. The reasons for the low rate of VBAC were as follows, the fear of liability, the convenience of having a CS rather than the physician having to remain in the hospital for the whole of the woman's labor, and the marginalisation of midwives.[20,24]
Figure 4.
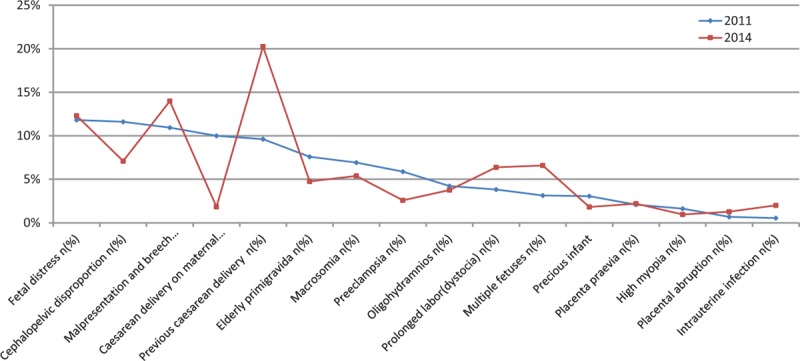
The differences of indications for caesarean section between the years 2011 and 2014.
Caesarean delivery on maternal request (CDMR) was defined as a caesarean delivery for a singleton pregnancy, on maternal request, at term, and in the absence of any maternal or fetal indication for cesarean.[25] Based on the WHO global survey (2010) on maternal and perinatal health in Asia, China had a disproportionately high rate of CS of 46.2% with an 11.7% rate of procedures performed without medical indication, which is the highest in the world.[2,26] Much attention has recently been paid to the growing phenomenon of CDMR. Many researches had shown that CDMR might be one of the drivers of the skyrocketing CS rate in China.[1,2,27] Tocophobia, social, cultural and economic factors, the changing attitude of clinicians and pregnancy women may influence the desire to have a cesarean delivery.[2,28] To C or not to C, that is the question.[28] Our study showed that there was no difference in the rate of blood transfusion, hysterectomy, and perinatal mortality between the groups of spontaneous vaginal delivery and CS on maternal request. What is more, more CDMR might mean that more CS would be undertaken due to previous CS. It would be a vicious circle. Numerous reviews on the topic of CDMR have been presented both in favor and against.[28] A CS has been shown to have some very obvious advantages that include scheduling benefits, fewer uncertainties, avoidance of difficult labor and perineal trauma and minimizing the exposure of the baby to difficult manipulations, trauma and stress, the long-term protective effect on the pelvic floor and sexual function, as well as the universal reduction in the rates of (vertical) transmission of infections need to be revisited.[28] However, the disadvantages of a CS outweighed the advantages far away. Especially when women can bear more than 1 baby in China, a detailed discussion on reproductive outcomes following a primary CS should be launched. Primary CS was associated with an increased risk of infertility,[29,30] early pregnancy loss,[31,32] ectopic pregnancy,[32,33] abnormal placentation,[6,7] fetal growth restriction and preterm birth,[31] uterine scar dehiscence and rupture,[34] peripartum hysterectomy in subsequent pregnancies.[28,35] Therefore, it is urgent to decrease CDMR. In our research, the decrease of the CDMR might be the reason for the decrease of CS rate in Beijing Obstetrics and Gynecology Hospital. Therefore, to decrease the CS rate, we must take actions to decrease the rate of CDMR.
Along with the decline of CS rate, the perinatal mortality and the rate of neonatal asphyxia decreased in 2014 compared with that in 2011. However, the rate of postpartum hemorrhage increased. It might be due to the higher rate of scarred uterus and emergency cesarean section transited from maternity wards in 2014. Several studies showed that the blood loss during repeated caesarean section was higher than that during primary CS. The reason might be several following aspects
-
1)
the uterine scar can increase the possibility of uterine rupture;
-
2)
the uterine scar can lead to uterine atony and increase the possibility of placenta accrete and placenta adhesion.
A study used 5-year, population-based data to explore the relationship between maternal age and maternal request cesarean delivery. The study confirmed the expectancy that request cesarean delivery propensity increased with maternal age.[36] Our study showed that pregnancy women with age between 25 and 29 years had the lowest CS rate and pregnancy women 35 years old or greater had the highest CS rate. The reasons for maternal CS preference in the absence of clinical indications were as follows, safety of self or the baby, fear of pain during childbirth, avoiding pelvic floor collapse and incontinence subsequent to vaginal delivery, previous negative birth experience, the ability to schedule delivery in advance.[1,36,37] A major reason for CS delivery preference among older women could be related to safety.[36] Several studies have documented that adverse fetal and maternal outcomes increase with maternal age, especially primigravid women.[36,38]
Maternal obesity is associated with obstetric complications that may contribute to a caesarean delivery, and many studies have reported an obesity–caesarean association.[39,40] Our study also confirmed the association.
In our study multiparous women had a higher CS rate than primiparous women. The reason might be repeated CS. Male infants were more likely to be delivered by CS than female infants. What is more, male infants were also associated with a higher rate of operative intervention in vaginal deliveries than female infants. The result was similar to my last research.[1,41] This might be because male infants have higher risks of adverse perinatal complications, such as gestational diabetes mellitus in the mother, preterm delivery, fetal distress and macrosomia, failure to progress during the first and second stages of labor, cord prolapse, nuchal cord, true umbilical cord knots, placental abruption, and placenta praevia.[1,41–48]
5. Conclusions
After a series of measures, the CS rate declined indeed. Compared with 2011, the perinatal mortality and the rate of neonatal asphyxia decreased in 2014. CDMR cannot improve the maternal-fetal prognosis compared with the spontaneous vaginal delivery. With the releasing of China's 2 children policy, more CS will be implemented due to previous CS. There is a need for further research that evaluates interventions for increasing VBAC rates that target clinicians. Urgent attention should be paid to the rapid rise of CS rate in China by the health policy-makers and medical professions due to the huge implications of CS.
5.1. Limitations
The study lacked the detailed information about a series of measures to reduce the CS rate.
Footnotes
Abbreviations: CDMR = caesarean delivery on maternal request, CS = caesarean section, FHR = fetal heart rate, VBAC = a vaginal delivery by a woman who has had a previous caesarean delivery, WHO = World Health Organization.
YL performed the statistical analysis and prepared the manuscript. WZ participated in the design and coordination of the study and revised the manuscript. XW, YR, and LZ carried out the data collection. All authors read and approved the final manuscript.
This project was supported by the Special Research Fund in Nonprofit Health Care Industry of the People's Republic of China (grant no. 201002013 to WZ) and the Research Fund for High-level Talented Individuals of Beijing Health Bureau (grant no. 2009-2-11 to WZ).
The authors have no conflicts of interest to disclose.
References
- [1].Liu Y, Li G, Chen Y, et al. A descriptive analysis of the indications for caesarean section in mainland China. BMC Pregnancy Childbirth 2014;14:410. [DOI] [PMC free article] [PubMed] [Google Scholar]
- [2].Lumbiganon P, Laopaiboon M, Gülmezoglu AM, et al. Method of delivery and pregnancy outcomes in Asia: the WHO global survey on maternal and perinatal health 2007-08. Lancet 2010;375:490–9. [DOI] [PubMed] [Google Scholar]
- [3].WHO Statement on caesarean section rates. Reproductive Health Matters 23:149–150. [DOI] [PubMed] [Google Scholar]
- [4].Selinger H. Maternal request for caesarean section: an ethical consideration. J Med Ethics 2014;40:857–60. [DOI] [PubMed] [Google Scholar]
- [5].Betran AP, Torloni MR, Zhang JJ, et al. WHO Working Group on Caesarean Section. WHO Statement on Caesarean Section Rates. BJOG 2016;123:667–70. [DOI] [PMC free article] [PubMed] [Google Scholar]
- [6].Tihtonen K, Nyberg R. Long-term effects of uterine cesarean section scar. Duodecim 2014;130:461–8. [PubMed] [Google Scholar]
- [7].Gilliam M. Cesarean delivery on request: reproductive consequences. Semin Perinatol 2006;30:257–60. [DOI] [PubMed] [Google Scholar]
- [8].Lydon-Rochelle M, Holt VL, Martin DP, et al. Association between method of delivery and maternal rehospitalization. JAMA 2000;283:2411–6. [DOI] [PubMed] [Google Scholar]
- [9].Bewley S, Cockburn J., II The unfacts of ’request’ caesarean section. BJOG 2002;109:597–605. [DOI] [PubMed] [Google Scholar]
- [10].Hyde MJ, Mostyn A, Modi N, et al. The health implications of birth by Caesarean section. Biol Rev Camb Philos Soc 2012;87:229–43. [DOI] [PubMed] [Google Scholar]
- [11].Neu J, Rushing J. Cesarean versus vaginal delivery: long-term infant outcomes and the hygiene hypothesis. Clin Perinatol 2011;38:321–31. [DOI] [PMC free article] [PubMed] [Google Scholar]
- [12].Huesch MD, Doctor JN. Cesarean delivery on maternal request. JAMA 2013;310:978. [DOI] [PubMed] [Google Scholar]
- [13].Feng XL, Wang Y1, An L, et al. Cesarean section in the People's Republic of China: current perspectives. Int J Womens Health 2014;6:59–74. [DOI] [PMC free article] [PubMed] [Google Scholar]
- [14].Gao Y, Xue Q, Chen G, et al. An analysis of the indications for cesarean section in a teaching hospital in China. Eur J Obstet Gyn R B 2013;170:414–8. [DOI] [PubMed] [Google Scholar]
- [15].Tang S, Li X, Wu Z. Rising cesarean delivery rate in primiparous women in urban China: evidence from three nationwide household health surveys. Am J Obstet Gynecol 2006;195:1527–32. [DOI] [PubMed] [Google Scholar]
- [16].Schemann K, Patterson JA, Nippita TA, et al. Variation in hospital caesarean section rates for women with at least one previous caesarean section: a population based cohort study. BMC Preg Childb 2015;15:179. [DOI] [PMC free article] [PubMed] [Google Scholar]
- [17].Roberts CL, Algert CS, Ford JB, et al. Pathways to a rising caesarean section rate: a population-based cohort study. BMJ Open 2012;2:e1725. [DOI] [PMC free article] [PubMed] [Google Scholar]
- [18].Farine D, Shepherd D, Robson M. Classification of caesarean sections in Canada: the modified Robson criteria. J Obstet Gynaecol Can 2012;34:1133. [PubMed] [Google Scholar]
- [19].Robson M, Hartigan L, Murphy M. Methods of achieving and maintaining an appropriate caesarean section rate. Best Pract Res Cl Ob 2013;27:297–308. [DOI] [PubMed] [Google Scholar]
- [20].Lundgren I, van Limbeek E, Vehvilainen-Julkunen K, et al. Clinicians’ views of factors of importance for improving the rate of VBAC (vaginal birth after caesarean section): a qualitative study from countries with high VBAC rates. BMC Pregnancy Childbirth 2015;15:196. [DOI] [PMC free article] [PubMed] [Google Scholar]
- [21].Dodd JM, Crowther CA, Huertas E, et al. Planned elective repeat caesarean section versus planned vaginal birth for women with a previous caesarean birth. Cochrane Database Syst Rev 2013;CD004224. [DOI] [PubMed] [Google Scholar]
- [22].Guise JM, Eden K, Emeis C, et al. Vaginal birth after cesarean: new insights. Evid Rep Technol Assess (Full Rep) 2010;1–397. [PMC free article] [PubMed] [Google Scholar]
- [23].Menacker F, Declercq E, Macdorman MF. Cesarean delivery: background, trends, and epidemiology. Semin Perinatol 2006;30:235–41. [DOI] [PubMed] [Google Scholar]
- [24].Catling-Paull C, Johnston R, Ryan C, et al. Non-clinical interventions that increase the uptake and success of vaginal birth after caesarean section: a systematic review. J Adv Nurs 2011;67:1662–76. [DOI] [PubMed] [Google Scholar]
- [25].Young D. Cesarean delivery on maternal request”: was the NIH conference based on a faulty premise? Birth 2006;33:171–4. [DOI] [PubMed] [Google Scholar]
- [26].Liu X, Landon MB, Cheng W, et al. Cesarean delivery on maternal request in China: what are the risks and benefits? Am J Obstet Gynecol 2015;212:811–7. [DOI] [PubMed] [Google Scholar]
- [27].Latham SR, Norwitz ER. Ethics and “cesarean delivery on maternal demand”. Semin Perinatol 2009;33:405–9. [DOI] [PubMed] [Google Scholar]
- [28].D Souza R, Arulkumaran S. To ‘C’ or not to ‘C’?/Caesarean delivery upon maternal request: a review of facts, figures and guidelines. J Perinat Med 2013;41:5–15. [DOI] [PubMed] [Google Scholar]
- [29].Murphy DJ, Stirrat GM, Heron J. The relationship between Caesarean section and subfertility in a population-based sample of 14 541 pregnancies. Hum Reprod 2002;17:1914–7. [DOI] [PubMed] [Google Scholar]
- [30].Mollison J, Porter M, Campbell D, et al. Primary mode of delivery and subsequent pregnancy. BJOG 2005;112:1061–5. [DOI] [PubMed] [Google Scholar]
- [31].Clark EA, Silver RM. Long-term maternal morbidity associated with repeat cesarean delivery. Am J Obstet Gynecol 2011;205(6 suppl):S2–10. [DOI] [PubMed] [Google Scholar]
- [32].Hemminki E, Merilainen J. Long-term effects of cesarean sections: ectopic pregnancies and placental problems. Am J Obstet Gynecol 1996;174:1569–74. [DOI] [PubMed] [Google Scholar]
- [33].Sadeghi H, Rutherford T, Rackow BW, et al. Cesarean scar ectopic pregnancy: case series and review of the literature. Am J Perinatol 2010;27:111–20. [DOI] [PubMed] [Google Scholar]
- [34].Landon MB, Hauth JC, Leveno KJ, et al. Maternal and perinatal outcomes associated with a trial of labor after prior cesarean delivery. N Engl J Med 2004;351:2581–9. [DOI] [PubMed] [Google Scholar]
- [35].Dildy GR. Postpartum hemorrhage: new management options. Clin Obstet Gynecol 2002;45:330–44. [DOI] [PubMed] [Google Scholar]
- [36].Lin H, Xirasagar S. Maternal age and the likelihood of a maternal request for cesarean delivery: a 5-year population-based study. Am J Obstet Gynecol 2005;192:848–55. [DOI] [PubMed] [Google Scholar]
- [37].Mi J, Liu F. Rate of caesarean section is alarming in China. Lancet 2014;383:1463–4. [DOI] [PubMed] [Google Scholar]
- [38].Balasch J, Gratacos E. Delayed childbearing: effects on fertility and the outcome of pregnancy. Fetal Diagn Ther 2011;29:263–73. [DOI] [PubMed] [Google Scholar]
- [39].Chu SY, Kim SY, Schmid CH, et al. Maternal obesity and risk of cesarean delivery: a meta-analysis. Obes Rev 2007;8:385–94. [DOI] [PubMed] [Google Scholar]
- [40].Zhou Y, Blustein J, Li H, et al. Maternal obesity, caesarean delivery and caesarean delivery on maternal request: a cohort analysis from China. Paediatr Perinat Epidemiol 2015;29:232–40. [DOI] [PubMed] [Google Scholar]
- [41].Liu Y, Li G, Zhang W. Effect of fetal gender on pregnancy outcomes in Northern China. J Matern Fetal Neonatal Med 2016;1–6. [DOI] [PubMed] [Google Scholar]
- [42].Brettell R, Yeh PS, Impey LWM. Examination of the association between male gender and preterm delivery. Eur J Obstet Gynecol Reprod Biol 2008;141:123–6. [DOI] [PubMed] [Google Scholar]
- [43].Elsmén E, Källén K, Maršál K, et al. Fetal gender and gestational-age-related incidence of pre-eclampsia. Acta Obstet Gynecol Scand 2006;85:1285–91. [DOI] [PubMed] [Google Scholar]
- [44].Melamed N, Yogev Y, Glezerman M. Fetal gender and pregnancy outcome. J Matern Fetal Neonatal Med 2010;23:338–44. [DOI] [PubMed] [Google Scholar]
- [45].Jongbloet PH. Fetal sex and very preterm birth. Am J Obstet Gynecol 2005;193:302. [DOI] [PubMed] [Google Scholar]
- [46].Challis J, Newnham J, Petraglia F, et al. Fetal sex and preterm birth. Placenta 2013;34:95–9. [DOI] [PubMed] [Google Scholar]
- [47].Bekedam DJ, Engelsbel S, Mol BWJ, et al. Male predominance in fetal distress during labor. Am J Obstet Gynecol 2002;187:1605–7. [DOI] [PubMed] [Google Scholar]
- [48].Clifton VL. Review: sex and the human placenta: mediating differential strategies of fetal growth and survival. Placenta 2010;31Suppl:S33–9. [DOI] [PubMed] [Google Scholar]


