Abstract
Early childhood development (ECD) is a significant social determinant of health. Monitoring ECD to reveal trends and patterns of development requires high-quality information on a population from infancy through adulthood. This study linked data from the Early Development Instrument (EDI), administered in senior kindergarten, with data from the Foundation Skills Assessment (FSA), graduation status and SES to show that Vancouver schools with poor FSA results also had high proportions of children with low EDI and SES scores. Linking EDI data to data on pregnancy, birth, medical history, hospital care and success in school would enable the creation of normative EDC trajectories for all children. A person-specific, anonymized, population-based record linkage system is an indispensable prerequisite for creating and monitoring developmental trajectories.
Abstract
Le développement de la petite enfance (DPE) est un important déterminant social de la santé. Le suivi du DPE pour en dégager les tendances et les schémas requiert une information de haute qualité sur la population, et ce, de la petite enfance à l'âge adulte. Cette étude fait le lien entre les données de l'Instrument de mesure du développement de la petite enfance (IMDPE), employé dans les classes maternelles, et les données relatives à l'Évaluation des habiletés de base (EHB), à l'obtention de diplômes et au statut socioéconomique. Les résultats révèlent que les écoles de Vancouver qui obtiennent un faible résultat selon l'IMDPE comptent également une forte proportion d'enfants dont le DPE et le statut socioéconomique sont faibles. Les liens entre les données de l'IMDPE et les données sur la grossesse, la natalité, les antécédents médicaux, les soins hospitaliers et le succès scolaire pourraient permettre la création de trajectoires normatives pour le DPE de tous les enfants. Un système de couplage des données personnalisé, anonyme et fondé sur la population constitue un préalable indispensable pour la création et le suivi de trajectoires pour le développement.
The World Health Organization (WHO) Commission on the Social Determinants of Health has identified early child development as one of the world's most significant social determinants of health (Commission on Social Determinants of Health 2008). Unlike other factors, such as work and the urban environment, early child development (ECD) is actually an intermediate factor in social causation because it is strongly influenced by the environments where children grow up, live and learn; in turn, it goes on to influence health, well-being, learning and behaviour across the life course.
The social environments that influence early childhood range from the intimate (i.e., the nurturant qualities of the moment-to-moment interactions with mothers and other caregivers) to the global (the influences of the globalizing economy on family life). Between these extremes of social aggregation are the residential neighbourhood (neighbourhood safety and cohesion in relation to children) and the region and nation (the state of the economy and the child-/family-friendliness of laws, policies and programs) (Irwin et al. 2007). Cutting across geographies, the “relational community” and access to high-quality programs and services matter. While the latter is self-explanatory, the former requires comment. By relational community, we mean the group from which the family, and thus the child, gets its identity. This may be a religious or ethnic group, or it may be based upon the occupational status of one or more parent. In any case, relational communities are important because they influence parenting norms, gender roles and expectations, notions of a well-lived life and the status of the family as privileged or subject to discrimination within society (Irwin et al. 2007).
As a determining influence on outcomes across the balance of the life course, ECD is clearly important enough to warrant monitoring, and its multiple, overlapping social determinants create a powerful rationale for monitoring the state of ECD across the whole population. Children, by definition, integrate all the influences on them, which are then reflected in their state of development. No single environmental influence has overwhelming predictive power. For example, the literature on resilience shows that one-quarter to one-third of children from highly dysfunctional, economically challenged families nonetheless develop very successfully. Directly monitoring the state of ECD may reveal trends and patterns of development that are not predicted by simply monitoring known determinants. Monitoring whole populations complements sample surveys in several important ways. It allows finer disaggregation (e.g., according to neighbourhood character and specific ethnic group) and makes it easy to factor out random variation when trying to identify and understand outlier groups (Kershaw et al. 2005).
In Canada, population-based assessments are done during the senior kindergarten year (the transition year to school at age five). ECD is measured using the Early Development Instrument (EDI), in which kindergarten teachers fill out a detailed checklist for each child in their class based on five scale measures of development: physical well-being, social competence, emotional maturity, language and cognitive development, and communication and general knowledge (Janus et al. 2007). The EDI allows each child to be scored as “vulnerable” or “not vulnerable” on each of these five scales. The individual EDI scores are not used to label the child but are aggregated to the school or neighbourhood level to identify population levels and trends of vulnerability, much as infant mortality rates allow us to understand levels and trends of child survival. The system is efficient and relatively inexpensive, requiring funding for approximately one day of kindergarten teacher buy-out to complete EDIs on a class.
By the end of the 2007/08 school year, EDIs had been completed on at least one kindergarten entry cohort, covering approximately 75% of the Canadian population. Through a pan-Canadian initiative, these data have been mapped according to the residential neighbourhood (defined as approximately 250 square blocks in an urban setting) where each child lives (Council for Early Child Development 2002). The principal summary measure used is the proportion of children who are vulnerable on one or more of the five scales of the EDI. The maps that follow in the next section reveal the following:
Across Canada, between 25% and 30% of children do not arrive at kindergarten meeting all the developmental benchmarks they need to thrive both now and into the future.
The range of vulnerability across neighbourhoods is 17-fold, from a low of approximately 4% to a high of approximately 68%.
Approximately 40%–45% of the variation in neighbourhood vulnerability can be “explained,” in a statistical sense, by socio-economic factors from census and tax filer data, leaving more than half the variation to be potentially explained by factors that are more likely to be under local influence, such as the quality of local leadership in ECD and parenting styles (Kershaw et al. 2005).
Vulnerability rates of less than 10% are possible and feasible in any Canadian neighbourhood, suggesting that over 60% of the vulnerability among Canadian children, by school age, is avoidable.1
Developmental Trajectories
When EDI data are linked, on a person-specific but anonymous basis, to records regarding pregnancy, birth, medical history, hospital care and success from school entry to completion, normative developmental trajectories for early human development can be created for all children (Hertzman and Williams 2009). For a society that places a high priority on fostering human development, normative developmental trajectories are an indispensable indicator of progress. They allow a society to monitor success – what proportion of children have been born healthy and develop well until they reach adulthood; what proportion are developmentally challenged from birth but, nonetheless, do well thereafter; and what proportion reach school age vulnerable and yet overcome the challenges they face. Conversely, such data force society to confront the negative trajectories – those who are born healthy but become vulnerable and reach adulthood without the skills and competencies necessary for the modern world; those who are born developmentally challenged and do not do well thereafter; and those that reach school age developing well yet who do poorly thereafter. Societal progress means increasing the fraction of the former developmental trajectories at the expense of the latter.
Creating, analyzing and building policy on the basis of developmental trajectories is important because human development does not care about institutional boundaries. At present, we provide healthcare and social assistance to ensure basic survival and physical health; schools to develop competence in a range of cognitive skills; and social protection programs to provide children with a basic level of social and emotional support. We try to hold these institutions accountable as though they can function successfully in isolation from one another and from the facts of human development: if children fail at school, it is the fault of the schools; if children in care of the state do badly, it is the fault of that system, and so on. But an understanding of human development reveals that such narrow “stovepipe” judgments are perverse.
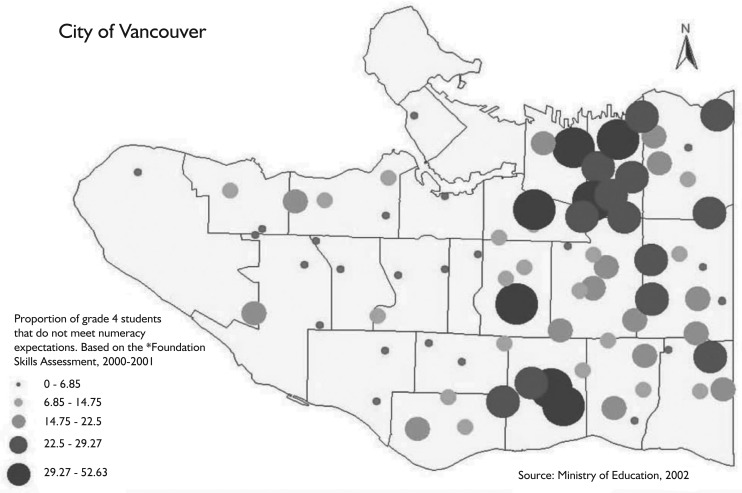
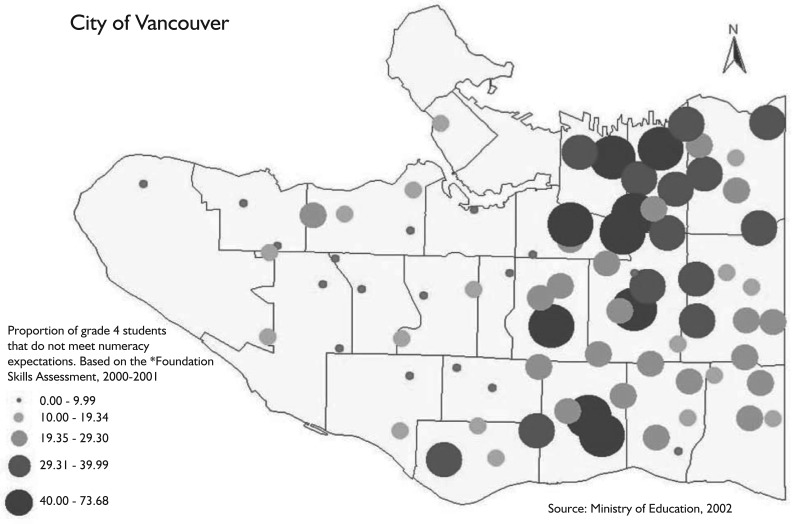
To illustrate this point, I present a before-and-after comparison of school success from the city of Vancouver (Hertzman et al. 2000). Maps 1 and 2 show the proportion of grade 4 students “failing to meet expectations” on standardized numeracy and reading tests (the Foundation Skills Assessments; hereafter, FSA) across 83 schools. Failure to meet expectations across the schools varies widely, from zero to more than 50% of students. The maps convey the impression that “school quality” can be easily judged using these raw scores, and doing so would follow the model of holding the schools accountable for human development in the school years, in isolation from all else. However, our EDI data by school showed us that, in general, schools with poor FSA results in grade 4 were also schools with high proportions of children vulnerable on the EDI in kindergarten. Similarly, schools in lower socio-economic status areas fared more poorly on the FSA than those in high socio-economic status areas.
Map 1.
Proportion of grade 4 students scoring below FSA* numeracy expectations, 2000–2001
Map 2.
Proportion of grade 4 students scoring below FSA* reading expectations, 2000–2001
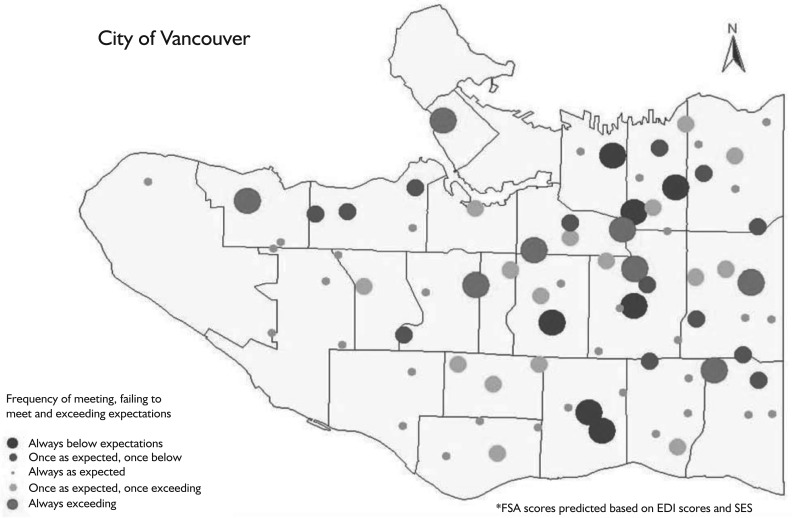
In order to take early development and socio-economic context into account, we regressed FSA scores for reading and numeracy over two school years (a total of four analyses) against EDI and socio-economic status (SES) of the school catchment area. Together, EDI and SES explained approximately 50% of the variation, by school, in the proportion of children failing to meet expectations, leaving the residual 50% to be potentially attributable to school quality. Accordingly, we were able to reclassify schools into five groups: those that consistently did better than would be predicted based upon EDI and SES across at least three of four analyses; those that did better than predicted on one or two analyses; those that tended to do as predicted; those that did worse than predicted on one or two analyses; and those that did worse than predicted on at least three of four analyses. Map 3 illustrates the schools that fell into each of these categories.
Map 3.
Frequency of meeting, failing to meet and exceeding predicted* values of the FSA, 1999–2000 and 2000–2001
Comparing Map 3 with Maps 1 and 2 shows that there is simply no relationship between the schools that are doing well or poorly after EDI and SES are taken into account and those that seem to do well or poorly on raw scores. This set of maps demonstrates how trying to hold institutions (i.e., schools) accountable for outcomes without taking the principles of human development into account is a form of public policy malpractice.
In contrast, placing developmental trajectories at the centre of an accountability framework should help guide us in public policy and institutional reform. For example, we used population-based, person-specific, anonymous data linkage to create developmental trajectories in order to study the economic costs of early vulnerability (Kershaw et al. 2009). Our study examined EDI data across time within British Columbia since 2001. We linked the BC EDI data to FSA achievement data in grade 4. Next, FSA data from grades 4 and 7 were linked to graduation status (i.e., graduation at a level that would allow the student to go on to university); graduation status, in turn, was linked to data showing its contribution to subsequent economic growth. The result was a synthetic cohort that linked EDI to school graduation to economic participation, allowing us to simulate the impact on economic growth of reducing early vulnerability in British Columbia from its current rate of 29% to 10%, a threshold above which child vulnerability is biologically avoidable. Economic analyses revealed that this 19% surplus vulnerability will cause British Columbia to forgo GDP growth that will cumulate in a 20% higher GDP over the following 60 years (Kershaw et al. 2009). For Canada, each percentage of reduction in EDI vulnerability should add a percentage of GDP growth over the following 60 years. The benefits to society would outweigh the costs by more than 6 to 1, a phenomenal return on investment by any standard.
In order to guide these investments, developmental trajectories need to be understood and monitored not only from birth, but also from the parents' earlier circumstances and experiences (e.g., quality of the relationship that produces the child; pre-natal nutrition, smoking, alcohol consumption and stress), such that modifiable factors and opportunities for intervention can be identified and interventions tracked. Such a data system requires a high level of inter-ministerial/researcher collaboration. At present, Canada has two emerging systems: the Healthy Child Manitoba/Manitoba Centre for Healthy Policy collaboration and Population Data BC/Human Early Learning Partnership.
Conclusion
Supporting the early stages of human development is a smart policy option for any society. Doing so requires high-quality information in the form of developmental trajectories from the earliest stages of life through adulthood. A person-specific, population-based record linkage system, where linked records are used anonymously, in a secure and privacy-sensitive manner, is an indispensable prerequisite for creating and monitoring developmental trajectories. The technical, methodological and ethical barriers to creating such systems in Canada have all been solved. The current challenge is to find the political will to implement them.
The estimate that vulnerability rates of less than 10% are feasible and possible comes directly from the pan-Canadian EDI data. It shows that approximately 7% of neighbourhoods, regardless of region, urban/rural status, ethnic mix or SES, have rates of vulnerability below 10%. In regions of the country where EDI data have been collected multiple times, these data show that it is possible to maintain vulnerability below 10% over time.
References
- Commission on Social Determinants of Health. Closing the Gap in a Generation: Health Equity through Action on the Social Determinants of Health. Final Report of the Commission on Social Determinants of Health. Geneva: World Health Organization; 2008. [Google Scholar]
- Council for Early Child Development. The Early Development Instrument – Maps. 2002. Retrieved September 10, 2010. < http://www.councilecd.ca/?q=pancanadianedi_maps>.
- Hertzman C., Kohen D., McLean S., Evans T., Dunn J. First Report on the Early Development and Community Asset-Mapping Project (CAMP) 2000 Nov; Report to the Vancouver/Richmond Health Department. [Google Scholar]
- Hertzman C., Williams R. “The Importance of Monitoring Early Childhood Development: Making Early Childhood Count.”. Canadian Medical Association Journal. 2009;180:68–71. doi: 10.1503/cmaj.080512. [DOI] [PMC free article] [PubMed] [Google Scholar]
- Irwin L., Siddiqi A., Hertzman C. Early Child Development: A Powerful Equalizer. 2007. Final report submitted to the World Health Organization. Retrieved September 10, 2010. < http://www.earlylearning.ubc.ca/globalknowledgehub/documents/WHO_ECD_Final_Report.pdf>.
- Janus M., Brinkman S., Duku E., Hertzman C., Santos R., Sayers M., Schroeder J., Walsh C. The Early Development Instrument: Population-Based Measure for Communities. Hamilton, ON: Offord Centre for Child Studies, McMaster University; 2007. [Google Scholar]
- Kershaw P., Anderson L., Warburton B., Hertzman C. 15 by 15: A Comprehensive Framework for Early Human Capital Investment in BC. 2009 Aug; Report to the Business Council of British Columbia Opportunity 2020 Project. [Google Scholar]
- Kershaw P., Irwin L., Trafford K., Hertzman C. The British Columbia Atlas of Child Development. Western Geographical Series #40. Victoria, BC: Western Geographical Press; 2005. [Google Scholar]


