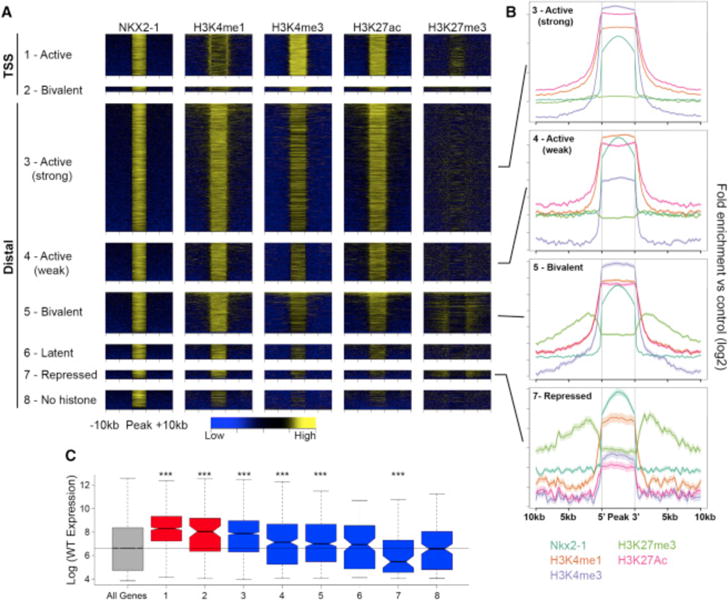
Figure 3. Histone Profile of NKX2-1-Bound REs in the MGE.

(A) Heatmaps showing H3K4me1, H3K4me3, H3K27ac, and H3K27me3 enrichment around NKX2-1-bound REs. REs divided into eight groups defined by their combined histone profile: (1) active TSS (1.1.1.0 = H3K4me1+, H3K4me3+, H3K27ac+, and H3K27me3−); (2) bivalent TSS (1.1.1.1); (3) active (strong) distal (1.1.1.0); (4) active (weak) distal (1.0.1.0); (5) bivalent distal (1.1.1.1); (6) latent distal (1.0.0.0); (7) repressed distal (1.0.0.1); and (8) no histone (0.0.0.0).
(B) Average profile of H3K4me1, H3K4me3, H3K27me3, and H3K27ac at (3) active (strong) distal, (4) active (weak) distal, (5) bivalent distal, and (7) repressed distal REs.
(C) Relative gene expression of closest TSS in relation to RE groups as defined in (A). Two-sample t tests were used to test significance compared to the control gene set: ***p < 0.001, **p < 0.01, and *p < 0.05.
