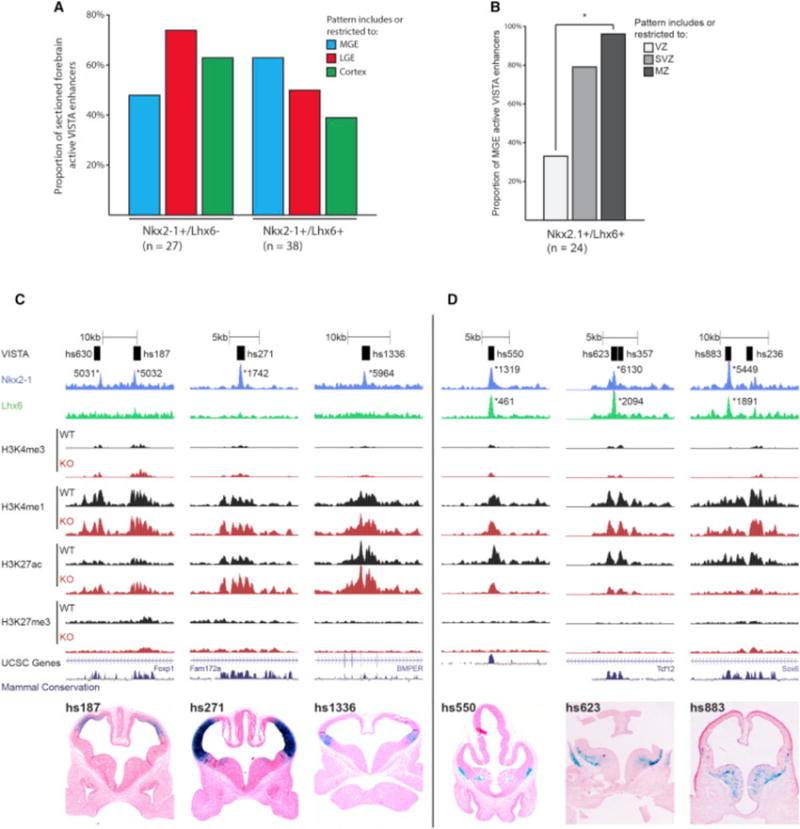
Figure 7. LHX6 Is Required for Activating Transcription in the SVZ and MZ of the MGE.

(A) Proportion of MGE, LGE, and cortex activity of +/−REs and +/+REs at E11.5.
(B) VZ, SVZ, and MZ activity of +/+REs in the MGE at E11.5. Chi-square test was used to test significance between the groups: *p < 0.05.
(C) Browser view of +/−REs with tracks; VISTA transgenic ID, NKX2-1 ChIP-seq, LHX6 ChIP-seq, H3K4me1, H3K4me3, H3K27ac, H3K27me3, UCSC genes, and mammalian conservation. Both WT and Nkx2-1cKO data are shown for H3 modifications. Called peaks are labeled with an asterisk. VISTA transgenics showing in vivo activity of +/−REs (hs187, hs271, and hs1336) at E11.5.
(D) Browser view of +/+REs with tracks; VISTA transgenic ID, NKX2-1 ChIP-seq, LHX6 ChIP-seq, H3K4me1, H3K4me3, H3K27ac, H3K27me3, UCSC genes, and mammalian conservation. Both WT and Nkx2-1cKO data are shown for H3 modifications. Called peaks are labeled with an asterisk. VISTA transgenics showing in vivo activity of +/+REs (hs550, hs623, and hs883) at E11.5.
