

Abstract
Background & Aims
Hepatic fibrosis is associated with an overproduction of matrix proteins and a pathological increase of liver stiffness. Non-invasive magnetic resonance (MR) quantification of matrix can be assessed with a collagen-binding molecular MR probe and stiffness by MR elastography, complementary techniques. This study utilizes both imaging techniques to more accurately stage hepatic fibrosis in a rat model.
Methods
Thirty rats with varying levels of diethylnitrosamine-induced liver fibrosis were imaged before and 45 minutes after injection of collagen-specific probe EP-3533. MR elastography was performed in the same imaging session. The change in liver relaxation rate ΔR1 post EP-3533 and liver stiffness were compared to the collagen proportional area (CPA) determined by histology and to Ishak scoring using receiver operating characteristic (ROC) analysis.
Results
Collagen imaging was most sensitive to early fibrosis, while elastography was more sensitive to advanced fibrosis. This complementary feature enabled the formulation of a composite model using multivariate analysis of variance. This model incorporated the discriminating advantages of both MR techniques, resulting in more accurate staging throughout fibrotic progression.
Conclusions
Collagen molecular MR imaging is complementary to MR elastography and combining both techniques in a single exam leads to increased diagnostic accuracy for all stages of fibrosis.
Keywords: MRI, hepatic fibrosis, contrast agent, gadolinium, stiffness
Chronic liver disease, an increasingly prevalent cause of morbidity and mortality worldwide,[1] results from a wide range of factors such as viral hepatitis, excess alcohol consumption, diabetes, and metabolic dysfunction. Repeated injury to the liver from these conditions results in a fibrotic tissue repair response that replaces necrotic tissue with extracellular matrix scar, rich in fibrilliar collagen. If the underlying causes of disease are eliminated early enough, liver fibrosis may regress to less advanced stages or be fully reversed to normal architecture and function,[2] but if left unchecked, fibrosis will often progress to cirrhosis, which significantly impairs liver function and is the 12th leading cause of death in the United States.[3] Therefore, accurate assessment of fibrosis stage and early detection of fibrosis, as well as monitoring its response to therapy, are vital clinical requirements for effective management of liver disease.
Liver biopsy is the gold standard in assessing liver fibrosis,[4] although it suffers from many limitations including sampling error, inter-observer variability, and risk of complications; hospitalization is required in 1–5% of biopsy bases.[5,6] Even at advanced stages of fibrosis, large error rates in diagnosis of 33% have been reported.[7] Furthermore, repeated biopsies to evaluate disease progression or response to treatment are not ideal due to increased risk of complication and lack of patient compliance. Therefore, non-invasive strategies that can repeatedly measure fibrosis throughout the entire organ are advantageous and urgently needed.
Magnetic resonance elastography (MRE) is an imaging technique that can be adapted to a clinical MRI scanner and measures the propagation of mechanical waves in order to measure stiffness and other mechano-elastic properties of tissue. MRE has been most widely applied to assess liver fibrosis, and has been reported to be most reliable at detecting advanced fibrosis and cirrhosis.[8] Portal hypertension, inflammation, and collagen cross-linking are some of the commonly acknowledged factors contributing to this late-stage liver stiffening.[9–11]
Molecular imaging also holds great promise for the non-invasive detection of organ fibrosis. A peptide-based type I collagen specific MR probe, termed EP-3533, was demonstrated to detect and stage disease in animal models of cardiac, pulmonary, and hepatic fibrosis.[12–17] In one study EP-3533 enhanced MRI could accurately stage liver fibrosis in a carbon tetrachloride mouse model and was more sensitive than other conventional MRI measures such as water diffusion.[14]
Molecular MRI and MRE are independent techniques that can both be implemented in a single imaging session. The goals of this work were to compare the effectiveness of MRE and collagen-targeted molecular MRI for staging liver fibrosis, and to determine whether incorporating both techniques in the same imaging exam could lead to increased diagnostic accuracy. Here we concurrently performed the two imaging techniques on rats treated with diethylnitrosamine (DEN) or vehicle for different periods of time in order create different stages of liver fibrosis. Compared to other animal models, the DEN model has been previously shown to more accurately resemble human disease at the histologic, biochemical and molecular levels.[18] The imaging readouts were compared to Ishak scoring, morphometric histological analysis, and to liver hydroxyproline levels.
Materials and Methods
Animal model
All experiments were performed in accordance with the NIH Guide for the Care of Use of Laboratory Animals and were approved by the Institution’s Animal Care and Use Committee. Male Wistar rats (Charles River Laboratories, Wilmington, MA) were administered 50 mg/kg of DEN once weekly for either 8, 12, or 16 weeks, to induce differing stages of fibrosis (n = 6 for each time point). Controls (n=4 for each time point) received phosphate buffered saline (PBS). Animals were imaged approximately one week after the last injection to avoid acute effects of DEN.
Probe
EP-3533 comprises a ten amino acid cyclic peptide conjugated to three gadolinium (Gd) moieties, and was synthesized as previously reported[12]. The peptide confers affinity for type I collagen (Kd = 1.8 μM) and the three Gd moieties provide strong signal enhancement (relaxivity = 48.4 mM−1s−1 at 1.4 T).[17]
MR Imaging
Animals were anesthetized with isoflurane (1–2%) and placed in a specially designed cradle. The tail vein was cannulated for intravenous delivery of the contrast agent while the animal was positioned in the scanner. Imaging was performed at 1.5T using a clinical MRI scanner (Siemens Healthcare, Malvern, PA) with a custom-built solenoid coil. Each animal was placed within the solenoid coil in the supine position. A silver needle (disposable silver acupuncture needles, 0.20 × 48 mm; Asahi Medical Instrument Co., Kawaguchi, Saitama, Japan) was inserted through a gap in the solenoid coil and into the liver tissue through the anterior body wall, in a setup similar to what has been previously described[19]. An electromechanical driver attached to the other end of the needle generated longitudinal sinusoidal vibrations at 200 Hz (Fig. 3A).
Fig. 3. MR elastography setup and phase gradient reconstruction of liver shear stiffness.
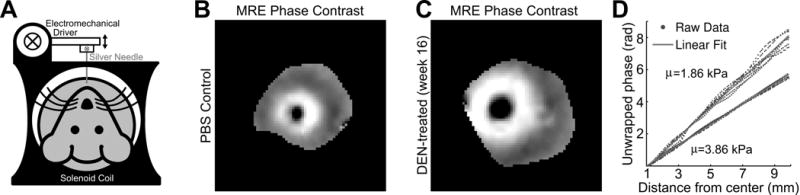
(A) The rat is placed supine in the solenoid coil. An electromechanical driver powered by an amplifier and signal generator (not illustrated) is connected to a silver acupuncture needle that penetrates the liver. (B–C) Representative phase contrast images of shear waves radially propagating from the needle location. Note the greater spatial wavelengths in the DEN-treated animal (C), reflecting the greater shear stiffness. (D) The phase of the first temporal harmonic of these phase contrast images plotted over radial distance from the needle (blue) represents the phase gradient, which can be linearly fit (red) to quantify a shear stiffness value. The upper phase gradient and stiffness value is of the PBS control animal from (B), and the lower phase gradient and stiffness value is of the same DEN-treated animal from (C).
Respiratory-gated, 3D inversion recovery images were acquired prior to and 45 minutes following intravenous administration of EP-3533 (7.26 nmol/cm2; surface area (SA) was estimated by SA = k W2/3 where W is the rat weight in grams and k is the Meeh constant, empirically determined to be 9.5[20,21]). A non-selective inversion pulse was used and images were acquired with inversion recovery times of 50, 100, 200, 250, 300, 400 and 1000 ms. Image acquisition parameters consisted of an echo time of TE = 2.44 ms, field of view FOV = 120 × 120 mm, matrix = 192 × 192 (0.625 mm in-plane resolution), slice thickness = 0.6 mm, and 36 image slices. The effective repetition time TR was dictated by the respiration rate through gating. Dynamic spoiled gradient echo acquisitions were taken during a four-minute interval, starting one minute before injection of EP-3533 as a means to measure complete delivery of the probe. MRE of the rat liver was then performed using a gradient echo MRE sequence for wave image acquisition with the following parameters: matrix size 256×256, TR = 50 ms, TE = 23.3 ms, flip angle = 30°, slice thickness = 5 mm, field of view = 100mm × 100mm, one pair of 20 mT/m trapezoidal motion-encoding gradients (MEG) at 200 Hz. The trigger pulses initiating the sinusoidal oscillations of the electromechanical driver were moved relative to the MEG to obtain images at eight different phase offsets between the motion and the MEG, equally spaced over one cycle of the motion. Because the stiffness measurements were reconstructed from the phase image information without incorporating magnitude data, they were unaffected by the magnitude enhancements due to the presence of EP-3533.
MR data analysis
T1 was quantified from a three parameter fit (T1, S0, θ) of the dependence of liver signal intensity (S) on inversion time (TI) and repetition time (TR) using a nonlinear least squares algorithm with a custom written MATLAB (Mathworks, Natick, MA) program.
where S0 is the signal intensity at full recovery, and θ is the flip angle. The liver signal intensity S is the averaged signal in a three-dimensional region of interest (ROI) of the rat liver. Because the TR changes according to the respiratory rate of the animal, the mean TR for each scan was extracted from the DICOM timestamp data by dividing the duration of the scan by the number of phase encode repetitions. The R1 (1/T1) difference between between post-and pre-injection measurements were computed for each animal, and these ΔR1 values were corrected based on the ΔR1 value of the blood, assuming a blood volume fraction of the liver to be 0.25.[22]
A phase gradient (PG) reconstruction method reported previously by Yin, et al.[19] was employed to extract shear stiffness values from the acquired data. For each animal, the phase of the first temporal harmonic of the acquired wave images were computed and unwrapped. The phase values along evenly-spaced spokes radially propagating from the needle location were selected to represent an aggregate phase gradient in the liver, which was derived by a linear fit of the phase values over radial distance. The phase gradient is directly related to the spatial wavelength (λ = 2π/PG), and this spatial wavelength is used to calculate the shear stiffness μ via the well-known elastic wave mechanics relation μ = f2λ2ρ, where f is the temporal frequency of the shear wave vibration (in this case 200 Hz), and ρ is the density of the tissue, typically estimated in elastography experiments to be 1000 kg/m3.
Tissue analysis
Following imaging, animals were sacrificed and liver tissue analyzed for pathologic scoring of fibrosis and hydroxyproline content. Formalin-fixed samples were embedded in paraffin, cut into 5 μm-thick sections and stained with Sirius Red according to standard procedures. Sirius Red stained sections were analyzed by a pathologist, who was blinded to the study, to score the amount of liver disease according to the method of Ishak. In addition, the collagen proportional area (CPA) was morphometrically calculated using ImageJ (NIH). Hydroxyproline in tissue was quantified by HPLC analysis as previously described.[23] Gd was quantified in tissue acid digests by inductively coupled plasma-mass spectrometry using dysprosium as an internal standard. Hydroxyproline and Gd are expressed as amounts per wet weight of tissue.
Statistical analysis
Data are displayed as box plots with the dark band inside the box representing the mean, the bottom and top of the box the first and third quartiles, and the whiskers the minimum and maximum values. Data are reported as the mean ± standard error. Statistical analyses (Analysis of Variance (ANOVA) and Receiver Operating Characteristic (ROC) analysis) were performed using Prism 6 (GraphPad Software, Inc., La Jolla, CA) with p <0.05 considered as significant. Differences among groups were tested with one-way ANOVA followed by the Tukey post-hoc test. Multivariate analysis of variance (MANOVA) was performed on the ΔR1 and MRE data to form a single composite score based on a linear combination of the two original metrics. Optimal linear weighting coefficients were determined such that the linear combination resulted in maximum discrimination between the Ishak groups according to the F-test statistic SSB/SSW, where SSB is the sum-of-squares between groups and SSW is the sum-of-squares within groups.[24] MANOVA analysis was calculated from custom code in a MATLAB (Mathworks, Natick, MA) program.
Results
For these studies, we chose to use a model of sequential fibrosis and cirrhosis that develops after administration of repeated injections of low-dose DEN.[14] Liver fibrosis and disease progression in the DEN rat model was characterized by pathological scoring and morphometric measurements of collagen deposition (i.e. CPA) of histological tissue sections (Fig. 1B) as well as HPLC analyses of liver tissue for hydroxyproline content. In our experiment, 4 rats developed fibrosis scored Ishak 1–2, 5 rats developed fibrosis scored Ishak 3-4, and 10 rats developed fibrosis scored Ishak 5-6. As expected, CPA (Fig. 1C) and Hyp (Fig. 1D) increased with Ishak score. CPA increased from 0.68 ± 0.05% for Ishak 0, 3.11 ± 1.10% for Ishak 1-2, 3.46 ± 0.33% for Ishak 3-4, to 8.32 ± 1.30% for Ishak 5-6. Hyp increased from 224.8 ± 17.81 μg/g for Ishak 0, 410.8 ± 76.86 μg/g for Ishak 1-2, 467.1 ± 40.91 μg/g for Ishak 3-4, to 590.4 ± 55.38 μg/g for Ishak 5-6.
Fig. 1. Imaging protocol and characterization of DEN-induced rat model of liver fibrosis.
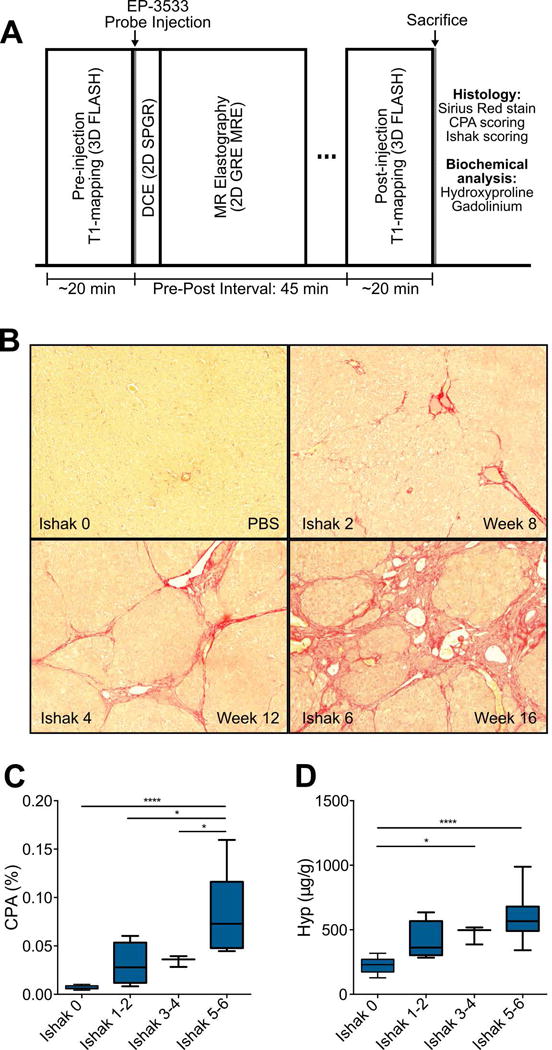
(A) Rat imaging protocol involves a baseline inversion recovery sequence for liver T1 quantification, followed by EP-3533 probe injection, dynamic contrast enhancement to validate probe delivery to liver, MR elastography, and post EP-3533 T1 quantification. Rats are then euthanized and the livers taken for biochemical and histological analyses. (B) Representative images of Sirius Red staining after DEN administration for 8, 12, and 16 weeks. (C) Collagen proportional area (CPA) as assessed by quantification of Sirius Red staining, increased progressively with Ishak score. (D) Total collagen as assessed by hydroxyproline analysis, increased progressively with Ishak score. Data were analyzed using one-way ANOVA, followed by the Tukey post hoc test. * p < 0.05, ** p < 0.01, *** p < 0.005, and **** p < 0.001.
A respiratory-gated, three-dimensional inversion recovery MRI sequence was used to quantify T1 of the liver. Representative inversion recovery images at TI = 400 ms for data acquired pre and post-EP3533 are shown in Fig. 2 for a PBS control rat (Fig. 2A and 2C) and a week 16 DEN rat (Fig. 2B and 2D). A more dramatic signal enhancement is observed following contrast agent injection for the DEN rat compared to the PBS rat, which is indicative of increased T1 shortening due to greater accumulation of the EP-3533 contrast agent.
Fig. 2. T1 imaging of rat liver.
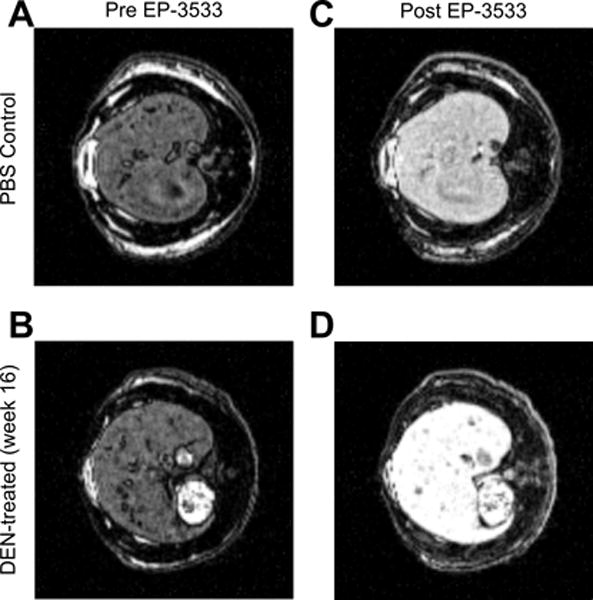
(A,B) Pre-injection inversion recovery scans for PBS (A) and DEN-treated (B) rats at an inversion time of 400 ms. (C,D) Post-injection inversion recovery scans for PBS (C) and DEN-treated (D) rats at an inversion time of 400 ms. The signal enhancement is noticeably larger for the DEN-treated rats (B vs. D).
Shear stiffness measurements of the rat livers were estimated from MRE data. When hepatic fibrosis is distributed homogenously throughout the liver at the macroscopic scale, such as in the DEN-injured Wistar rat model used here [18,25], it has been shown that highly precise measures of shear stiffnesses can be obtained through phase gradient reconstruction of MRE acquisitions of radially propagating shear waves[19]. The longer spatial wavelengths observed in the radially propagating waves in a representative DEN-treated liver (Fig. 3C) compared to that of the control (Fig. 3B) can be demonstrated quantitatively through this phase gradient method (Fig. 3D), whereby shear stiffness values (3.86 kPa for the DEN-treated liver and 1.86 kPa for the PBS control) representing the whole liver is extracted from the data with the analytical procedures described above.
To assess the ability of each of these techniques to stage liver fibrosis, we separated the animals into four stages based on a traditional pathological Ishak score (Ishak 0 (no fibrosis), Ishak 1-2 (mild fibrosis), Ishak 3-4 (moderate fibrosis), and Ishak 5-6 (severe fibrosis)) and corresponding CPA (CPA < 2%, CPA 2%-4%, CPA 4%-6%, and CPA > 6%). The ΔR1 and shear stiffness values for each group are plotted in Fig. 4. The general trend that we observed was that the collagen probe (via ΔR1) exhibited the largest differences between the least fibrotic group (Ishak 0 and CPA < 2%) and the other groups, while MRE (via shear stiffness) exhibited the largest differences between the most fibrotic group (Ishak 5-6 and CPA > 6%) and the other groups. This complementary outcome is further supported by the symmetric nature of the statistically significant between-group differences displayed by horizontal lines in Fig. 4A vs Fig. 4B and Fig. 4C vs. Fig. 4D.
Fig. 4. Staging of liver fibrosis by collagen-enhanced MRI and MR elastography.
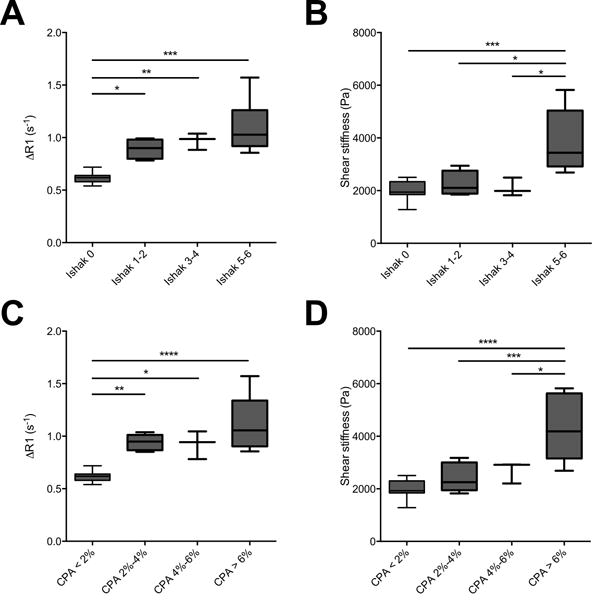
(A–C) Collagen-enhanced MRI is sensitive to early stages of fibrosis. ΔR1 significantly increases for fibrotic animals compared with non-fibrotic Ishak 0 (A) and CPA < 2% (C) animal groups. (B–D) MR elastography is most sensitive to advanced stages of fibrosis. Shear stiffness significantly increases for the Ishak 5-6 (B) and CPA > 6% (D) groups compared with animals with less advanced fibrosis. The symmetric sensitivity of these methods indicate complementary staging capabilities. Data were analyzed using one-way ANOVA, followed by the Tukey post hoc test. * p < 0.05, ** p < 0.01, *** p < 0.005, and **** p < 0.001.
Specifically, we observed that ΔR1 increased progressively with Ishak score, from 0.62 ± 0.02 s−1 for Ishak 0, 0.89 ± 0.05 s−1 for Ishak 1-2, 0.97 ± 0.05 s−1 for Ishak 3-4, to 1.09 ± 0.09 s−1 for Ishak 5-6. Statistically significant differences in ΔR1 were observed between Ishak 0 and Ishak 1-2 (p < 0.05), between Ishak 0 and Ishak 3-4 (p < 0.01), and between Ishak 0 and Ishak 5-6 (p < 0.001). For the CPA groupings, we observed that ΔR1 increased from 0.62 ± 0.02 s−1 for CPA < 2% to 0.94 ± 0.03 s−1 for CPA 2%-4%, remained approximately constant at 0.93 ± 0.08 s−1 for CPA 4%-6%, and increased to 1.12 ± 0.11 s−1 for CPA > 6%. Statistically significant differences in ΔR1 were observed between CPA < 2% and CPA 2%-4% (p < 0.01), between CPA < 2% and CPA 4%-6% (p < 0.05), and between CPA < 2% and CPA > 6% (p < 0.001).
Shear stiffness was observed to stay nearly constant from 2023 ± 124 Pa for Ishak 0, 2252 ± 242 Pa for Ishak 1-2, to 2103 ± 202 Pa for Ishak 3-4, until a large increase to 3894 ± 387 Pa for Ishak 5-6. Statistically significant differences in shear stiffness were observed between Ishak 0 and Ishak 5-6 (p < 0.005), between Ishak 1-2 and Ishak 5-6 (p < 0.05), and between Ishak 3-4 and Ishak 5-6 (p < 0.05). For the CPA groupings, Shear stiffness was observed to be 2006 ± 112 Pa for CPA < 2%, 2252 ± 242 Pa for CPA 2%-4%, to 2103 ± 202 Pa for CPA 4%-6%, until a large increase to 3894 ± 387 Pa for CPA > 6%. Statistically significant differences in shear stiffness were observed between CPA < 2% and CPA > 6% (p < 0.001), between CPA 2%-4% and CPA > 6% (p < 0.005), and between CPA 4%-6% and CPA > 6% (p < 0.05).
We also evaluated the effectiveness of these techniques to stage fibrosis by receiver operating characteristic (ROC) analysis. Using the same Ishak and CPA groups, the ROC analyses further support the complementary notion that collagen molecular MR imaging is most suitable for differentiating non-fibrotic from fibrotic animals, while elastography is best for differentiating highly-fibrotic or cirrhotic animals from those with less advanced fibrosis; the highest area under the curve (AUC) for ΔR1 resulted from the comparison between non-fibrotic and fibrotic groups (Fig. 5A and 5C), and the highest AUC for shear stiffness resulted from the comparison between the most fibrotic group and the less fibrotic (including non-fibrotic) groups (Fig. 5B and 5D).
Fig. 5. Receiver operating characteristic (ROC) analysis of liver fibrosis staging by collagen-enhanced MRI and MR elastography.
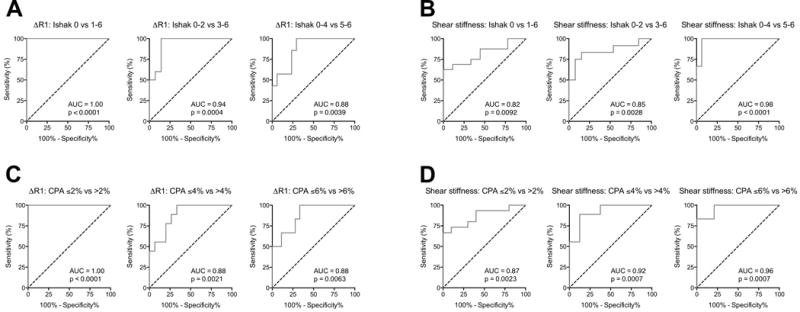
ROC curves are grouped by imaging technique and fibrosis metric: ΔR1 over Ishak stages (A) and CPA groups (C) and Shear stiffness over Ishak stages (B) and CPA groups (D). ROCs over both Ishak and CPA demonstrate collagen-enhanced MRI most suitable for discriminating early stages of fibrosis (decreasing AUC with fibrotic progression) while MR elastography most suitable for discriminating late stages of fibrosis (increasing AUC with fibrotic progression) in this animal disease model.
The AUC for ΔR1 detecting fibrosis (Ishak 0 vs 1-6) was 1.00 (95% CI 1.00-1.00, p < 0.0001). The AUC for distinguishing mild from moderate/severe fibrosis (Ishak 0-2 from Ishak 3-6) was 0.94 ± 0.05 (95% CI 0.83 to 1.00, p = 0.0004). Finally, the AUC for distinguishing mild/moderate to severe fibrosis (Ishak 0-4 from Ishak 5-6) was 0.88 ± 0.07 (95% CI 0.75 to 1.00, p = 0.004). Evaluated with CPA, the AUC for ΔR1 detecting fibrosis (CPA ≤ 2% vs > 2%) was 1.00 (95% CI 1.00-1.00, p < 0.0001). The AUC for distinguishing CPA ≤ 4% vs > 4% was 0.88 ± 0.07 (95% CI 0.75 to 1.00, p = 0.0021). Finally, the AUC for distinguishing CPA ≤ 6% vs > 6% was 0.88 ± 0.07 (95% CI 0.73 to 1.00, p = 0.0063).
By MR elastography, the AUC for shear stiffness detecting fibrosis (Ishak 0 vs 1-6) was 0.82 ± 0.08 (95% CI 0.66-0.98, p = 0.0092). The AUC for distinguishing mild from moderate/severe fibrosis (Ishak 0-2 from Ishak 3-6) was 0.85 ± 0.08 (95% CI 0.69 to 1.00, p = 0.0028). Finally, the AUC for distinguishing mild/moderate to severe fibrosis (Ishak 0-4 from Ishak 5-6) was 0.98 ± 0.02 (95% CI 0.93 to 1.00, p < 0.0001). Evaluated with CPA, the AUC for MRE shear stiffness detecting fibrosis (CPA ≤ 2% vs > 2%) was 0.87 ± 0.07 (95% CI 0.73-1.00, p < 0.0023). The AUC for distinguishing CPA ≤ 4% vs > 4% was 0.92 ± 0.06 (95% CI 0.81 to 1.00, p = 0.0007). Finally, the AUC for distinguishing CPA ≤ 6% vs > 6% was 0.96 ± 0.04 (95% CI 0.89 to 1.00, p = 0.0007).
Because these two techniques were observed to have complementary staging abilities for detecting early (best with collagen molecular imaging) and late stage fibrosis (best with MR elastography), we formulated a composite metric that accounted for both methods. We used multivariate analysis of variance (MANOVA), an extended form of the generalized linear model, to form an optimal linear combination of the ΔR1 and shear stiffness values, resulting in a single composite score that yielded the greatest separation between the Ishak groups.[24] The MANOVA process decomposed the dataset into two canonical (or composite) variables, each of which are linear combinations of the original ΔR1 and shear stiffness values (Fig. 6A); CV1 = 8.02*R + 5.69*S − 7.06 and CV2 = −9.76*R + 3.92*S − 0.72, where CV1 and CV2 are the composite variables, R is the ΔR1 value in s−1 and S is the shear stiffness in kPa, and each linear combination is subtracted by its mean. Composite Variable 1 represents the linear combination with maximum discrimination between Ishak groups, and when plotted in a conventional manner against Ishak groups (Fig. 6B), we observed this composite metric’s ability to discriminate well between all stages of liver fibrosis.
Fig. 6. Composite score for staging liver fibrosis incorporating collagen-enhanced imaging and MR elastography measures.
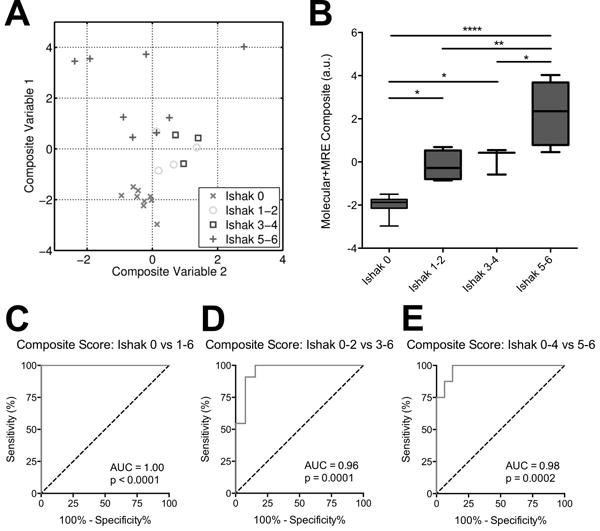
(A) ΔR1 and shear stiffness for each animal were linearly combined, with weighting coefficients optimized by multivariate analysis of variance (MANOVA) to achieve maximum separation between groups. The analysis generated two sets of coefficients, and the resultant linear combinations form Composite Variable 1 (with maximum separation) and Composite Variable 2 (with 2nd-highest separation). (B) Fibrosis staging by composite score (Composite Variable 1) incorporates the advantages of both imaging techniques and is capable of discriminating both early and late stages of fibrosis. (C–E) ROC curves demonstrating the composite score’s ability to better distinguish between fibrotic stage groups compared to the individual MR measurements reported in Figure 5. Data were analyzed using one-way ANOVA, followed by the Tukey post hoc test. * p < 0.05, ** p < 0.01, and **** p < 0.001.
This is further reflected by the ROC curves (Fig. 6C–E), which display superior AUC values compared to that determined by the individual ΔR1 and shear stiffness tests. The AUC for the composite score detecting fibrosis (Ishak 0 vs 1-6) was 1.00 (95% CI 1.00-1.00, p < 0.001). The AUC for distinguishing mild from moderate/severe fibrosis (Ishak 0-2 from Ishak 3-6) was 0.96 ± 0.04 (95% CI 0.88 to 1.00, p = 0.0001). Finally, the AUC for distinguishing mild/moderate to severe fibrosis (Ishak 0-4 from Ishak 5-6) was 0.98 ± 0.03 (95% CI 0.93 to 1.00, p = 0.0002).
Discussion
In this work we show for the first time simultaneous MR imaging of collagen content and tissue stiffness to compare and contrast each technique’s ability to stage liver fibrosis in DEN-treated rats. Our results for each separate technique recapitulated previous findings for staging fibrosis. We observed the same exponential-like trend for tissue stiffness over fibrotic progression that has been widely reported in previous elastography literature,[26,27] resulting in good detection of advanced fibrosis and cirrhosis, but less discrimination for earlier stages. Previous molecular imaging studies with EP-3533 in different animal models of liver fibrosis also showed this probe to be sensitive in detecting early stages of fibrosis and reported similar AUC values in ROC analysis across discrimination stages.[14,15]
This high fibrotic sensitivity of EP-3533 imaging can also be elucidated at the molecular level by its high correlation to direct measures of collagen from extracted tissue, such as hydroxyproline (r = 0.85 for the linear regression between ΔR1 and Hyp, as shown in Supplemental Figure 1). Previous liver fibrosis studies of EP-3533 enhanced imaging of CCl4-injured mice and BDL-injured rats demonstrated similarly high correlations,[13,15] exhibiting the robustness of this non-invasive technique in assessing collagen across animal and inducement models.
An important consideration for any diagnostic imaging technique is the relationship between the imaging measurement and the true biological condition the test is attempting to quantify. EP-3533 enhanced MRI reflects liver collagen levels and collagen (assessed by Hyp) correlates strongly, but not perfectly with fibrosis as determined by either Ishak scoring or CPA. The relationship between EP-3533 signal enhancement and tissue collagen will also be affected by probe delivery. For instance, decreased liver perfusion at later stages of disease due to portal venous hypertension could decrease probe delivery and result in an underestimation of total collagen and fibrosis stage. MRE is conventionally a measurement of the elastic properties of tissue. Fibrosis contributes to tissue stiffness but the MRE measurement is also influenced by inflammation or altered perfusion (such as portal venous hypertension during cirrhosis). In fact, these are commonly cited contributors to the apparent late-stage increases in liver stiffness.[28]
Because these imaging techniques measure independent biophysical properties, the limitations of each measurement may be offset by combining the two imaging readouts. This will be especially important in the clinical setting when the extent of disease is an unknown variable. By utilizing both measurements, we generated a composite score model that was able to accurately encapsulate both early- and late-stage discrimination of fibrosis (AUROC > 0.96 for all comparisons) due to the partially uncorrelated nature of the individual techniques. Although the specific coefficients of the model described here are tied to the exam parameters of this study (e.g. contrast agent dose, elastography frequency), a multivariate collagen+MRE model can be instantiated for future experimental or clinical investigations by similar staging studies to determine optimal linear weighting coefficients.
The MRE reconstruction method we used was based on previous work[19] that demonstrated the superior precision of the phase gradient technique compared to conventional elastogram reconstruction based on local frequency estimation in quantifying the shear stiffness value for predominately homogenously distributed diseases such as liver fibrosis. Although cirrhotic nodules at advanced stages may introduce focal perturbations of shear stiffness, the cirrhotic condition is already detectable by the bulk tissue stiffness. Additionally, the stiffness values of these small nodules are typically not accurately measured by MR elastography, especially in small animals where the spatial wavelengths of the shear waves are usually greater than the size of the nodules, because spatial frequency estimation is easily corrupted by noise in regions of interest (ROIs) with a low dynamic range of shear wave phase.
Prior literature reporting the direct elastic modulus measurements of fresh surgical samples of fibrotic liver corroborate our results, showing the elastic moduli at the lower fibrotic stages staying within similar ranges and only the highly fibrotic and cirrhotic livers with greater values.[29] One of the key molecular explanations suggested by literature is that cross-linking of collagen and elastin fibers, which has been shown to significantly increase tissue stiffness,[30,31] occurs typically in advanced fibrotic stages after initial collagen deposition.[32–34]
While elastography studies of patient populations with chronic liver diseases have typically shown similar results with insignificant stiffness differences observed between non-fibrotic and mild fibrosis,[26,27,35,36] some recent studies, primarily small animal injury models with CCl4, have observed early-stage stiffness increases[11,28,37] even before overproduction of collagen due to the cross-linking activity of lysyl oxidase. The molecular mechanisms that determine collagen production and collagen cross-linking are areas of active investigation, and these events most likely vary across animal models of fibrosis and in human patients. For this reason, imaging probes that target collagen should provide useful information complementary to that of stiffness measurements by MR elastography toward the common goal of fibrosis staging, and MRI exams that incorporate both metrics will be more advantageous in the clinical and research settings.
There are some limitations of this study. While the data presented here with EP-3533 is consistent with our previous data in the mouse CCl4 and rat BDL models, it was harder to distinguish more advanced fibrosis in the rat DEN model and this may be due to the overall severity in this model as discussed above. While the differences observed may just be expected when using various animal models, the observation of discrepancy between these models might also approximate what to expect in humans and further underscores the need for more consistent and robust staging. The consistent, strong correlation between EP-3533-enhanced imaging and liver hydroxyproline levels across all of these models provides strong evidence that EP-3533 will be useful in the clinic for staging fibrosis. There were also overlaps of maximum and minimum values for both imaging techniques among each liver fibrotic group especially for the earlier stages. Techniques like elastography and collagen molecular imaging are best when distinguishing large differences in disease, but finer staging will always be more challenging. The importance of the current work is the demonstration that combining different and complementary readouts in the same imaging session can greatly improve diagnostic accuracy.
In summary, we showed for the first time that it is possible to incorporate molecular imaging and MRE into a single comprehensive MR exam of liver fibrosis. The two techniques provide complementary information that can be combined to provide a more accurate non-invasive means of assessing liver fibrosis across all stages of disease. This approach should have broad utility in the clinical setting for better distinguishing patients with early stage fibrosis from those with last stage disease at high risk for liver-related mortality.
Supplementary Material
Supplemental Fig. 1. (A) Correlation between ΔR1 and CPA. (B) Correlation between ΔR1 and hydroxyproline content. (C) Correlation between shear modulus and CPA. (D) Correlation between shear modulus and hydroxyproline content.
Acknowledgments
Financial support statement: This work was supported by grants from the National Cancer Institute (CA140861 to B.C.F.), the National Institute of Diabetes and Digestive and Kidney Diseases (DK104956 to B.C.F. and DK104302 to P.C.) and the National Institute of Biomedical Imaging and Bioengineering (EB015896 to B.R. and EB009062 to P.C.)
List of abbreviations
- 3D
Three dimensional
- ANOVA
Analysis of variance
- AUC
Area under the curve
- AUROC
Area under the receiver operating characteristic curve
- CPA
Collagen proportional area
- DEN
Diethylnitrosamine
- FOV
Field of view
- Gd
Gadolinium
- MANOVA
Multivariate analysis of variance
- MEG
Motion encoding gradients
- MR
Magnetic resonance
- MRE
Magnetic resonance elastography
- MRI
Magnetic resonance imaging
- NIH
National Institutes of Health
- R1
Longitudinal relaxivity
- PBS
Phosphate buffered saline
- PG
Phase gradient
- ROC
Receiver operating characteristic
- ROI
Region of interest
- SA
Surface area
- TE
Echo time
- T1
Longitudinal relaxation time
- TI
Inversion time
- TR
Repetition time
Footnotes
Conflict of interest statement: P.C. has > 5% equity in Collagen Medical, LLC, a company working to commercialize the MRI probe used in this study. B.C.F. is a paid consultant for Collagen Medical, LLC. All other authors have no conflicts of interest.
Author Contributions: study concept and design: B.Z., B.C.F., P.C.; acquisition of data: B.Z., L.W., N.R., H.D., T.R.; analysis and interpretation of data: B.Z., L.W., C.T.F., G.Y.L., K.K.T., B.R., B.C.F., P.C.; drafting of the manuscript: B.Z.; critical revision of the manuscript for important intellectual content: B.C.F., P.C.; statistical analysis: B.Z., L.W., B.C.F., P.C.; obtained funding: B.R., B.C.F., P.C.; administrative, technical or material support:; study supervision: B.Z., B.C.F., P.C..
References
- 1.Williams R. Global challenges in liver disease. Hepatology. 2006;44:521–6. doi: 10.1002/hep.21347. [DOI] [PubMed] [Google Scholar]
- 2.Iredale JP. Models of liver fibrosis: Exploring the dynamic nature of inflammation and repair in a solid organ. J Clin Invest. 2007;117:539–48. doi: 10.1172/JCI30542. [DOI] [PMC free article] [PubMed] [Google Scholar]
- 3.Miniño AM. Death in the United States, 2009. NCHS Data Brief. 2011:1–8. [PubMed] [Google Scholar]
- 4.Manning DS, Afdhal NH. Diagnosis and quantitation of fibrosis. Gastroenterology. 2008;134:1670–81. doi: 10.1053/j.gastro.2008.03.001. [DOI] [PubMed] [Google Scholar]
- 5.Ratziu V, Charlotte F, Heurtier A, Gombert S, Giral P, Bruckert E, et al. Sampling variability of liver biopsy in nonalcoholic fatty liver disease. Gastroenterology. 2005;128:1898–906. doi: 10.1053/j.gastro.2005.03.084. [DOI] [PubMed] [Google Scholar]
- 6.Myers RP, Fong A, Shaheen AAM. Utilization rates, complications and costs of percutaneous liver biopsy: A population-based study including 4275 biopsies. Liver Int. 2008;28:705–12. doi: 10.1111/j.1478-3231.2008.01691.x. [DOI] [PubMed] [Google Scholar]
- 7.Afdhal NH, Nunes D. Evaluation of liver fibrosis: A concise review. Am J Gastroenterol. 2004;99:1160–74. doi: 10.1111/j.1572-0241.2004.30110.x. [DOI] [PubMed] [Google Scholar]
- 8.Loomba R, Wolfson T, Ang B, Hooker J, Behling C, Peterson M, et al. Magnetic resonance elastography predicts advanced fibrosis in patients with nonalcoholic fatty liver disease: A prospective study. Hepatology. 2014;60:1920–8. doi: 10.1002/hep.27362. [DOI] [PMC free article] [PubMed] [Google Scholar]
- 9.Vizzutti F, Arena U, Romanelli RG, Rega L, Foschi M, Colagrande S, et al. Liver stiffness measurement predicts severe portal hypertension in patients with HCV-related cirrhosis. Hepatology. 2007;45:1290–7. doi: 10.1002/hep.21665. [DOI] [PubMed] [Google Scholar]
- 10.Nakasaki M, Hwang Y, Xie Y, Kataria S, Gund R, Hajam EY, et al. The matrix protein Fibulin-5 is at the interface of tissue stiffness and inflammation in fibrosis. Nat Commun. 2015;6:8574. doi: 10.1038/ncomms9574. [DOI] [PMC free article] [PubMed] [Google Scholar]
- 11.Perepelyuk M, Terajima M, Wang AY, Georges PC, Janmey Pa, Yamauchi M, et al. Hepatic stellate cells and portal fibroblasts are the major cellular sources of collagens and lysyl oxidases in normal liver and early after injury. Am J Physiol Gastrointest Liver Physiol. 2013;304:G605–14. doi: 10.1152/ajpgi.00222.2012. [DOI] [PMC free article] [PubMed] [Google Scholar]
- 12.Caravan P, Das B, Dumas S, Epstein FH, Helm Pa, Jacques V, et al. Collagen-Targeted MRI Contrast Agent for Molecular Imaging of Fibrosis. Angew Chemie. 2007;119:8319–21. doi: 10.1002/anie.200700700. [DOI] [PubMed] [Google Scholar]
- 13.Polasek M, Fuchs BC, Uppal R, Schühle DT, Alford JK, Loving GS, et al. Molecular MR imaging of liver fibrosis: a feasibility study using rat and mouse models. J Hepatol. 2012;57:549–55. doi: 10.1016/j.jhep.2012.04.035. [DOI] [PMC free article] [PubMed] [Google Scholar]
- 14.Fuchs BC, Wang H, Yang Y, Wei L, Polasek M, Schühle DT, et al. Molecular MRI of collagen to diagnose and stage liver fibrosis. J Hepatol. 2013;59:992–8. doi: 10.1016/j.jhep.2013.06.026. [DOI] [PMC free article] [PubMed] [Google Scholar]
- 15.Farrar CT, DePeralta DK, Day H, Rietz Ta, Wei L, Lauwers GY, et al. 3D molecular MR imaging of liver fibrosis and response to rapamycin therapy in a bile duct ligation rat model. J Hepatol. 2015;63:689–96. doi: 10.1016/j.jhep.2015.04.029. [DOI] [PMC free article] [PubMed] [Google Scholar]
- 16.Caravan P, Yang Y, Zachariah R, Schmitt A, Mino-Kenudson M, Chen HH, et al. Molecular magnetic resonance imaging of pulmonary fibrosis in mice. Am J Respir Cell Mol Biol. 2013;49:1120–6. doi: 10.1165/rcmb.2013-0039OC. [DOI] [PMC free article] [PubMed] [Google Scholar]
- 17.Helm Pa, Caravan P, French Ba, Jacques V, Shen L, Xu Y, et al. Postinfarction myocardial scarring in mice: molecular MR imaging with use of a collagen-targeting contrast agent. Radiology. 2008;247:788–96. doi: 10.1148/radiol.2473070975. [DOI] [PMC free article] [PubMed] [Google Scholar]
- 18.Fuchs BC, Hoshida Y, Fujii T, Wei L, Yamada S, Lauwers GY, et al. Epidermal growth factor receptor inhibition attenuates liver fibrosis and development of hepatocellular carcinoma. Hepatology. 2014;59:1577–90. doi: 10.1002/hep.26898. [DOI] [PMC free article] [PubMed] [Google Scholar]
- 19.Yin M, Woollard J, Wang X, Torres VE, Harris PC, Ward CJ, et al. Quantitative assessment of hepatic fibrosis in an animal model with magnetic resonance elastography. Magn Reson Med. 2007;58:346–53. doi: 10.1002/mrm.21286. [DOI] [PubMed] [Google Scholar]
- 20.Gilpin Da. Calculation of a new Meeh constant and experimental determination of burn size. Burns. 1996;22:607–11. doi: 10.1016/S0305-4179(96)-00064-2. [DOI] [PubMed] [Google Scholar]
- 21.Gouma E, Simos Y, Verginadis I, Lykoudis E, Evangelou A, Karkabounas S. A simple procedure for estimation of total body surface area and determination of a new value of Meeh’s constant in rats. Lab Anim. 2012;46:40–5. doi: 10.1258/la.2011.011021. [DOI] [PubMed] [Google Scholar]
- 22.Donahue KM, Weisskoff RM, Chesler DA, Kwong KK, Bogdanov AA, Mandeville JB, et al. Improving MR quantification of regional blood volume with intravascular T1 contrast agents: accuracy, precision, and water exchange. Magn Reson Med. 1996;36:858–67. doi: 10.1002/mrm.1910360608. [DOI] [PubMed] [Google Scholar]
- 23.Hutson PR, Crawford ME, Sorkness RL. Liquid chromatographic determination of hydroxyproline in tissue samples. J Chromatogr B Analyt Technol Biomed Life Sci. 2003;791:427–30. doi: 10.1016/s1570-0232(03)00248-4. [DOI] [PubMed] [Google Scholar]
- 24.Anderson MJ. A new method for non parametric multivariate analysis of variance. Austral Ecol. 2001;26:32–46. doi: 10.1111/j.1442-9993.2001.01070.pp.x. [DOI] [Google Scholar]
- 25.Bona S, Moreira AJ, Rodrigues GR, Cerski CT, da Silveira TR, Marroni CA, et al. Diethylnitrosamine-induced cirrhosis in Wistar rats: an experimental feasibility study. Protoplasma. 2015;252:825–33. doi: 10.1007/s00709-014-0719-8. [DOI] [PubMed] [Google Scholar]
- 26.Sandrin L, Fourquet B, Hasquenoph JM, Yon S, Fournier C, Mal F, et al. Transient elastography: a new noninvasive method for assessment of hepatic fibrosis. Ultrasound Med Biol. 2003;29:1705–13. doi: 10.1016/j.ultrasmedbio.2003.07.001. doi:S0301562903010718 [pii] [DOI] [PubMed] [Google Scholar]
- 27.Ziol M, Handra-Luca A, Kettaneh A, Christidis C, Mal F, Kazemi F, et al. Noninvasive assessment of liver fibrosis by measurement of stiffness in patients with chronic hepatitis C. Hepatology. 2005;41:48–54. doi: 10.1002/hep.20506. [DOI] [PubMed] [Google Scholar]
- 28.Salameh N, Larrat B, Abarca-Quinones J. Early Detection of Steatohepatitis in Fatty Rat Liver by Using MR Elastography. Radiology. 2009;253 doi: 10.1148/radiol.2523081817/-/DC1. [DOI] [PubMed] [Google Scholar]
- 29.Yeh WC, Li PC, Jeng YM, Hsu HC, Kuo PL, Li ML, et al. Elastic modulus measurements of human liver and correlation with pathology. Ultrasound Med Biol. 2002;28:467–74. doi: 10.1016/S0301-5629(02)00489-1. [DOI] [PubMed] [Google Scholar]
- 30.Marturano JE, Xylas JF, Sridharan GV, Georgakoudi I, Kuo CK. Lysyl oxidase-mediated collagen crosslinks may be assessed as markers of functional properties of tendon tissue formation. Acta Biomater. 2014;10:1370–9. doi: 10.1016/j.actbio.2013.11.024. [DOI] [PMC free article] [PubMed] [Google Scholar]
- 31.Elbjeirami WM, Yonter EO, Starcher BC, West JL. Enhancing mechanical properties of tissue-engineered constructs via lysyl oxidase crosslinking activity. J Biomed Mater Res A. 2003;66:513–21. doi: 10.1002/jbm.a.10021. [DOI] [PubMed] [Google Scholar]
- 32.Friedman SL. Mechanisms of hepatic fibrogenesis. Gastroenterology. 2008;134:1655–69. doi: 10.1053/j.gastro.2008.03.003. [DOI] [PMC free article] [PubMed] [Google Scholar]
- 33.Schuppan D, Kim YO. Review series Evolving therapies for liver fibrosis. 2013;123:1887–901. doi: 10.1172/JCI66028.The. [DOI] [PMC free article] [PubMed] [Google Scholar]
- 34.Tzortzaki EG, Tischfield Ja, Sahota A, Siafakas NM, Gordon MK, Gerecke DR. Expression of FACIT collagens XII and XIV during bleomycin-induced pulmonary fibrosis in mice. Anat Rec A Discov Mol Cell Evol Biol. 2003;275:1073–80. doi: 10.1002/ar.a.10120. [DOI] [PubMed] [Google Scholar]
- 35.Takahashi H, Ono N, Eguchi Y, Eguchi T, Kitajima Y, Kawaguchi Y, et al. Evaluation of acoustic radiation force impulse elastography for fibrosis staging of chronic liver disease: A pilot study. Liver Int. 2010;30:538–45. doi: 10.1111/j.1478-3231.2009.02130.x. [DOI] [PubMed] [Google Scholar]
- 36.Sporea I, Sirli R, Popescu A, Bota S, Badea R, Lupşor M, et al. Is it better to use two elastographic methods for liver fibrosis assessment? World J Gastroenterol. 2011;17:3824–9. doi: 10.3748/wjg.v17.i33.3824. [DOI] [PMC free article] [PubMed] [Google Scholar]
- 37.Georges PC, Hui J-J, Gombos Z, McCormick ME, Wang AY, Uemura M, et al. Increased stiffness of the rat liver precedes matrix deposition: implications for fibrosis. Am J Physiol Gastrointest Liver Physiol. 2007;293:1147–54. doi: 10.1152/ajpgi.00032.2007. [DOI] [PubMed] [Google Scholar]
Associated Data
This section collects any data citations, data availability statements, or supplementary materials included in this article.
Supplementary Materials
Supplemental Fig. 1. (A) Correlation between ΔR1 and CPA. (B) Correlation between ΔR1 and hydroxyproline content. (C) Correlation between shear modulus and CPA. (D) Correlation between shear modulus and hydroxyproline content.