

ABSTRACT
Background: The effect of whole grains on the regulation of energy balance remains controversial.
Objective: We aimed to determine the effects of substituting whole grains for refined grains, independent of body weight changes, on energy-metabolism metrics and glycemic control.
Design: The study was a randomized, controlled, parallel-arm controlled-feeding trial that was conducted in 81 men and postmenopausal women [49 men and 32 women; age range: 40–65 y; body mass index (in kg/m2): <35.0]. After a 2-wk run-in period, participants were randomly assigned to consume 1 of 2 weight-maintenance diets for 6 wk. Diets differed in whole-grain and fiber contents [mean ± SDs: whole grain–rich diet: 207 ± 39 g whole grains plus 40 ± 5 g dietary fiber/d; refined grain–based diet: 0 g whole grains plus 21 ± 3 g dietary fiber/d] but were otherwise similar. Energy metabolism and body-composition metrics, appetite, markers of glycemic control, and gut microbiota were measured at 2 and 8 wk.
Results: By design, body weight was maintained in both groups. Plasma alkylresorcinols, which are biomarkers of whole-grain intake, increased in the whole grain–rich diet group (WG) but not in the refined grain–based diet group (RG) (P-diet-by-time interaction < 0.0001). Beta ± SE changes (ΔWG compared with ΔRG) in the resting metabolic rate (RMR) (43 ± 25 kcal/d; P = 0.04), stool weight (76 ± 12 g/d; P < 0.0001), and stool energy content (57 ± 17 kcal/d; P = 0.003), but not in stool energy density, were higher in the WG. When combined, the favorable energetic effects in the WG translated into a 92-kcal/d (95% CI: 28, 156-kcal/d) higher net daily energy loss compared with that of the RG (P = 0.005). Prospective consumption (P = 0.07) and glycemia after an oral-glucose-tolerance test (P = 0.10) trended toward being lower in the WG than in the RG. When nonadherent participants were excluded, between-group differences in stool energy content and glucose tolerance increased, and between-group differences in the RMR and prospective consumption were not statistically significant.
Conclusion: These findings suggest positive effects of whole grains on the RMR and stool energy excretion that favorably influence energy balance and may help explain epidemiologic associations between whole-grain consumption and reduced body weight and adiposity. This trial was registered at clinicaltrials.gov as NCT01902394.
Keywords: body fat, body weight, continuous glucose monitoring, energy metabolism, fiber, glucose tolerance, glycemia, hunger, resting metabolic rate, thermogenesis
See corresponding editorial on page 545.
INTRODUCTION
International recommendations call for an increased consumption of whole grains together with a reduced consumption of refined grains (1). These recommendations are the result of accumulating evidence that has linked higher whole-grain intake to reduced risks of type 2 diabetes and cardiovascular disease (2–5) and the consistent epidemiologic finding that individuals who consume recommended amounts of whole grains (≥3 servings or 48 g/d), compared with individuals who consume few whole grains, have reduced BMI and adiposity and a lower prospective body weight gain (3–9). However, multiple randomized controlled trials (10–16) and 2 recent meta-analyses of clinical trials (4, 17) have largely been at odds with the epidemiologic data, collectively having failed to find evidence to support the favorable effects of whole grains on body weight. In addition, although 2 clinical trials have reported favorable effects of whole grains on adiposity (14, 15), the collective evidence base has not been conclusive (10, 13, 17). Because of the many health sequleae that are associated with overweight and obesity, there has been substantial scientific interest in resolving these inconsistencies to clarify the role of whole grains in weight management and the prevention of obesity.
Multiple mechanisms have been proposed to support the favorable epidemiologic association between whole-grain consumption and BMI and adiposity. The superior nutritive value of whole grains relative to that of refined grains and, in particular, the higher fiber content, are thought to suppress appetite, improve glycemic control and insulin sensitivity, and beneficially modulate the gut-microbiota composition and activity (18–20). To test these mechanisms, clinical trials have commonly incorporated whole-grain or refined-grain foods into participant’s habitual diets, most often with the use of multiple whole-grain sources with wheat as the primary source. This approach has largely failed to show statistically significant effects of whole grains on appetite or energy intake (10–12, 14, 15, 21–26), energy metabolism variables (15), or fasting glycemia and insulin sensitivity (10–12, 14, 15, 21, 23, 24, 26). However, a critical limitation of this evidence base has been the relative absence of studies that have provided fully controlled diets to participants. In addition, the few controlled-feeding studies that have been conducted have been highly heterogeneous in study populations, intervention durations, and designs and the types of whole grains studied (13, 16, 27, 28). These factors may explain why favorable effects of whole grains on insulin sensitivity (27), fasting glucose (13), and appetite (16, 27) have been reported in some but not all (13, 16, 27, 28) trials. The heterogeneity also underlies the recognized need for additional well-controlled studies that use strict dietary control to more definitively elucidate the effects of the dietary substitution of whole grains for refined grains on mechanisms that influence BMI and adiposity (5, 17, 19).
We measured variables of energy metabolism, appetite, glycemic control, and stool-microbiota composition during an 8-wk randomized, controlled, provided-food trial that was designed to examine the metabolic and immunologic effects of substituting whole grains for refined grains in the diet. We hypothesized that the substitution of whole grains for refined grains within a weight-maintaining diet would have broadly beneficial effects on energy regulation including appetite suppression, an increased metabolic rate and energy loss in the stool, and improved glycemia.
METHODS
This trial was conducted at the Jean Mayer USDA Human Nutrition Research Center on Aging at Tufts University between May 2012 and September 2014 and received approval from the Tufts University Health Sciences Institutional Review Board. All participants gave written informed consent before participating and received a stipend. This trial was registered at clinicaltrials.gov as NCT01902394. In this article, we report on secondary study outcomes. Primary study outcomes have been reported elsewhere and included immune-function variables and markers of inflammation (29).
Study design
Nonsmoking men and postmenopausal women aged 40–65 y with BMI (in kg/m2) between 20 and 35 were recruited from the Boston, Massachusetts, area with the use of direct mailing, social media, and posted advertisements. Of 1714 total respondents, 319 individuals attended an in-person screening visit. The 103 participants who were enrolled in the study were weight stable, reported consuming a low-fiber diet (men: <7 g/1000 kcal; women: <8 g/1000 kcal) for ≥2 wk before enrollment, abstained from the use of probiotic or prebiotic supplements for ≥2 wk before enrollment, and also abstained from the use of all nutritional supplements other than calcium and vitamin D for ≥1 mo before enrollment. Exclusion criteria were as follows: oral antibiotic use within 3 mo of enrollment; consumption of >2 alcoholic beverages/d; abnormal liver- and kidney-function tests; fasting blood glucose concentrations ≥125 mg/dL; diabetes; gastrointestinal disease; autoimmune disease; cancer; regular use of medications that affect energy metabolism, glycemia, appetite, or bowel habits; and the use of immunosuppressants, proton-pump inhibitors, H2 blockers, or prescribed nonsteroidal anti-inflammatory medications. Participants with hypertension or a medical history of cardiovascular, liver, or renal disease were admitted if the condition was controlled with medication.
The study was a randomized, single-blind, parallel-arm controlled trial. All food and beverages were provided throughout the 8-wk study. Participants collected food from and ate breakfast at the research center 3 times/wk and were instructed to consume all of the provided food and nothing else, to return any uneaten food, and to maintain habitual physical activity patterns. Dietary staff were not blinded to group assignments, but study investigators, outcome assessors, and data analysts were blinded until primary analyses were complete. Participants were not explicitly informed of their group assignments, but the diets differed in appearance.
The initial 2 wk of the study served as a run-in phase during which all participants consumed the same diet, and weight-maintenance energy needs were determined. Nonfasting body weight was measured 3 times/wk during this phase and throughout the study to monitor weight stability. If a weight change ≥1 kg was observed, prescribed energy intake was adjusted to prevent additional weight loss or gain. After the run-in period, participants were randomly assigned by the study statistician with the use of a computer program. During the subsequent 6 wk, participants were provided with either a weight-maintaining whole grain–rich diet [whole grain–rich diet group (WG)]10 or a weight-maintaining refined grain–based diet (weight-maintaining refined grain–based diet group (RG)] that did not contain any whole grains.
Study diets and dietary adherence
The run-in diet contained no whole grains and was designed to be consistent with the mean dietary intakes of US adults. The weight-maintaining whole grain–rich diet and weight-maintaining refined grain–based diet were designed to differ in whole-grain and fiber contents but to be otherwise similar in energy and macronutrient compositions, types of provided foods, and meal structures (Table 1, Supplemental Table 1). The diets differed primarily in whether grains were derived from whole-grain or refined-grain sources, which was achieved by replacing refined grain–containing foods with similar whole grain–containing foods. The primary whole grain in the whole grain–rich diet was wheat, but oats and brown rice were also included. Both diets met Dietary Reference Intakes for all vitamins, minerals, and essential fatty acids. Diet compositions were analyzed with the use of Nutrition Data System for Research v.2011 software (Nutrition Coordinating Center, University of Minnesota).
TABLE 1.
Actual dietary intakes during a 2-wk run-in diet and 6-wk refined grain–based or whole grain–rich intervention diets1
| Refined grain (n = 40) | Whole grain (n = 41) | |||
| Run-in diet (weeks 1–2) | Intervention (weeks 3–8) | Run-in diet (weeks 1–2) | Intervention (weeks 3–8) | |
| Energy, kcal/d | 2639 ± 363 | 2551 ± 358a | 2673 ± 395 | 2566 ± 359a |
| Energy density, kcal/g | 1.1 ± 0.2 | 1.2 ± 0.2 | 1.1 ± 0.2 | 1.2 ± 0.2a |
| Carbohydrate, % | 47 ± 1 | 52 ± 2a | 47 ± 1 | 54 ± 2a,b |
| Fat, % | 34 ± 1 | 28 ± 1a | 35 ± 1 | 28 ± 2a |
| Protein, % | 19 ± 1 | 20 ± 1a | 19 ± 1 | 18 ± 1a,b |
| Total fiber, g/1000 kcal | 8 ± 0.4 | 8 ± 0.4 | 8 ± 0.3 | 16 ± 0.8a,b |
| Soluble fiber, g/d | 6 ± 1 | 6 ± 1a | 6 ± 1 | 8 ± 1a,b |
| Insoluble fiber, g/d | 14 ± 2 | 15 ± 2 | 15 ± 2 | 31 ± 5a,b |
| Whole grains, g/d | 0 | 0 | 0 | 207 ± 39a,b |
| Glycemic index2 | 86 ± 1 | 84 ± 2a | 86 ± 2 | 81 ± 2a,b |
| Glycemic load2 | 251 ± 35 | 265 ± 41a | 254 ± 38 | 269 ± 43a |
All values are means ± SDs. aSignificantly different from the run-in diet, P < 0.05 (paired-samples t test). bSignificantly different from refined grain (ANCOVA adjusted for baseline value, age, sex, and BMI), P < 0.05.
White bread was used as the reference.
Diet adherence was assessed by reviewing daily food checklists, which were maintained by the participants, body weight monitoring, and the measurement of plasma alkylresorcinol homolog concentrations (19:0, 21:0, and 23:0), which are predominant in whole-grain wheat. Alkylresorcinol homologs are present primarily in the bran fractions of wheat, rye, barley, and triticale and are considered biomarkers of intakes of these whole grains (25, 30).
Anthropometric measurements
Anthropometric measurements were obtained during study weeks 2 and 8. Height and waist and hip circumferences were measured in duplicate with the use of standard methods (31). Seminude body weight and body density were measured in the morning after a ≥12-h fast with the use of air-displacement plethysmography (BOD POD GS; Cosmed) (32).
Blood biochemistries
Blood samples were collected via venipuncture after a ≥12-h fast during study weeks 2 and 8. Serum glucose was measured with the use of an enzyme-coupled kinetic assay, and serum insulin was measured with the use of a radioimmunoassay (Millipore), and these values were used to calculate the HOMA-IR (33) and quantitative insulin-sensitivity check index (34). Plasma alkylresorcinol concentrations were measured with the use of gas chromatography–mass spectrometry (25).
Stool characteristics
Participants collected all stools produced over 72 h during study weeks 2 and 8 with the use of separate, preweighed plastic containers for each sample. Samples were stored in a cooler with frozen ice packs and transported to the laboratory chilled. All samples from each 72-h collection were combined, homogenized, freeze dried to a constant weight (Virtis Benchmark 1000 Lyophilizer; Virtis Co.), and ground to a fine powder. The heat of combustion was measured in duplicate (CV ≤6%) with the use of ∼1.0 g freeze-dried stool, an Isoperibol Bomb Calorimeter (Parr model 1261; Parr Instrument Co.), and benzoic acid as a standard (16).
Resting metabolic rate and breath gases
The resting metabolic rate (RMR) was measured via indirect calorimetry with the use of a portable metabolic cart (Parvo Medics TrueOne 2400; Parvo Medics) during study weeks 2 and 8. Measurements were conducted in the morning, and participants were instructed to fast ≥12 h and to avoid vigorous exercise for ≥24 h before measurements. Measurements were completed with participants in the supine position after a 30-min rest period and under thermoneutral conditions. Oxygen consumption and carbon dioxide production were measured over 30 min, and the last 20 min of data were used to calculate the RMR with the use of Weir’s equation (35). The residual method was used to adjust the measured RMR for sex, age, fat-free mass, and fat mass (36). The calorimeter was calibrated with the use of test gases of known concentrations before each testing day, and alcohol burn tests were conducted periodically to ensure that the accuracy of the calorimeter was maintained within ±1%. Expired air was collected immediately before and after RMR measurements for breath hydrogen and methane measurements with the use of stationary gas chromatography (Supplemental Methods).
Gut-microbiota composition
Stool samples for gut-microbiota composition were delivered to the laboratory on ice within 24 h of production and frozen in aliquots during study weeks 2 and 8. The full processing methods have been described elsewhere (29). Briefly, DNA was extracted from stool samples with the use of the QIAamp DNA Stool Mini kit (Qiagen) with slight modifications from the manufacturer’s recommendations (29). Amplicons of the V4 region of the bacterial 16S ribosomal DNA were generated with the use of primers according to the methods of Caporaso et al. (37) and were submitted to the Tufts University Core Facility for 250-bp paired end sequencing on the Illumina MiSeq platform (Illumina Inc.). Sequencing data were processed with the use of the Quantitative Insights Into Microbial Ecology package (v1.9.0) (38). Reads were clustered at a 97% identity by open-reference operational taxonomic unit picking with the use of the Greengenes reference database (v13_5; www.greengenes.secondgenome.com) (39) and the USEARCH program v6.1 (40).
Oral-glucose-tolerance test
Glucose tolerance and insulin sensitivity were assessed with the use of an oral-glucose-tolerance test (OGTT) during study weeks 2 and 8 in a self-selected subset of the study cohort. Blood was collected for serum glucose and insulin measurements after a ≥12 h fast and at 30, 60, 90, and 120 min after the consumption of 75 g glucose solution. The AUC of the serum glucose response (Glucose-OGTTAUC) and AUC of the serum insulin response were calculated with the use of the trapezoidal method, and insulin sensitivity was estimated with the use of the Matsuda Index (41).
Continuous glucose monitoring
Blood glucose dynamics were also measured via continuous glucose monitoring (CGM) (42) during study weeks 2 and 8 in a self-selected subset of the study cohort. At the beginning of each 48-h monitoring period, a sensor was placed subcutaneously on the abdominal surface. Interstitial glucose concentrations were measured every 10 s and recorded as 5-min means over the subsequent 48 h (Medtronic CGMS iPro 2 Professional CGM System; Medtronic Inc.). Participants were also given instructions for the use of a glucometer (Abbott FreeStyle Lite; Abbott Diabetes Care Inc.), which was used to calibrate the CGM device every 6–12 h.
To prevent differences in meal timing from affecting the CGM analyses, the same 24-h window (i.e., 0300 on day 2 to 0300 on day 3) within the measurement period was analyzed for all participants. Multiple metrics were used to summarize blood glucose dynamics including the mean, SD, CV, and AUC of 24-h glucose concentrations (43).
Questionnaires
Subjective appetite was measured weekly with the use of visual analog scales that asked participants to rate their average levels of hunger, satiety, prospective consumption, and diet satisfaction over the past week. Eating behaviors were assessed during study weeks 2 and 8 with the use of the Three-Factor Eating Questionnaire, and food cravings were assessed with the use of the Food-Craving Inventory and the Food Cravings Questionnaire-State (Supplemental Methods). The International Physical Activity Questionnaire–short form was used to measure physical activity levels (Supplemental Methods).
Statistical analysis
Initial sample-size calculations indicated that 37 participants/group were needed to address primary study outcomes. With respect to the outcomes reported herein, a priori sample-size calculations indicated that 29 participants/group would allow for the detection of a 5% difference in the RMR (SD: 100 kcal/d) and a 50-kcal/d difference in stool energy content (SD: 65 kcal/d) at α = 0.05 and a power of 0.80. Sample-size estimates for the optional measurements indicated that 26 and 15 participants/group would allow for the detection of a mean ± SD difference in 24-h CGM glucose concentrations of 7.5 ± 9 mg/dL and a mean ± SD difference in the Glucose-OGTTAUC of 735 ± 690-mmol × h/L, respectively, at α = 0.05 and a power of 0.80. SPSS v21.0 (IBM SPSS) software, SAS v9.2 (SAS Institute) software, and R v3.2 software were used for the analyses. Values are reported as means ± SDs unless otherwise noted. All tests were 2-sided and were considered statistically significant at P ≤ 0.05.
All outcomes were assessed quantitatively and graphically for normality and outliers. Plasma alkylresorcinol concentrations were log10 transformed for analysis. Outliers were defined as change scores >3 times the IQR above the 75th percentile or below the 25th percentile within each study group. Analyses were completed both with and without outliers included. The exclusion of outliers did not alter the significance of any result, and data are presented with outliers included.
A repeated-measures ANOVA was used to examine between-group differences in body weight and plasma alkylresorcinol concentrations over time. Other outcomes measured only during study weeks 2 and 8 were analyzed with the use of an ANCOVA in which the change score was entered as the response variable. Three ANCOVA models were examined. In model 1, the preintervention value was entered as a covariate. Model 2 was adjusted as for model 1 and for age, sex, and baseline BMI. Model 3 was adjusted as for model 2 and for weight change. Between-group differences in changes in appetite scores over time were analyzed with the use of marginal models with an unstructured covariance structure. The mean preintervention appetite score (mean of weeks 1 and 2) was included as a covariate (model 1), and models were further adjusted as previously described. Pearson or Spearman correlations were used for exploratory analyses of associations.
Primary analyses excluded study dropouts because the study was focused on the efficacy, rather than the effectiveness, of the diets. Study dropouts were replaced to maintain the power and random assignment and to lessen risk of introducing bias. The absence of preintervention between-group differences (see Results) indicated that any risk of bias that was introduced by these exclusions was low, and covariate adjustment was used to further minimize bias.
Plasma alkylresorcinol concentrations indicated that there was adherence to the diet at the group level (see Results). However, to account for potential nonadherence at the individual level and to further examine efficacy, a secondary analysis with the exclusion of participants who were identified as potentially nonadherent (RG: n = 4; WG: n = 11) was conducted. Nonadherence was defined as having a plasma alkylresorcinol concentration ≥95 nmol/L during the run-in diet or having a plasma alkylresorcinol concentration <95 nmol/L (WG only) or ≥65 nmol/L (RG only) during the intervention (Supplemental Table 2) (30). One participant in the RG who did not have alkylresorcinol concentrations measured was also considered nonadherent.
Finally, exploratory analyses were conducted with the use of both generalized linear regression and Spearman correlation to examine associations between changes in taxa-relative abundances as independent variables and changes in outcomes that were affected by the intervention as dependent variables. Correlation analyses were conducted to control for outliers. To correct for multiple comparisons, P values within each taxa-outcome association were adjusted with the use of false-discovery rate (FDR) correction. Associations were considered significant if FDR-adjusted P values were <0.25 for both regression and correlation analyses.
RESULTS
Of 103 enrolled participants, 90 subjects completed the run-in phase and were randomly assigned, and 81 subjects completed the study (Supplemental Figure 1, Table 2). The group assignment (P = 0.72), sex (P = 0.72), age (P = 0.23), and preintervention physical activity level (P = 0.21), body fat percentage (P = 0.62), adjusted RMR (P = 0.68), fasting blood glucose (P = 0.66), and HOMA-IR (P = 0.16) of study completers did not differ from those of the 9 participants who withdrew after random assignment. However, a trend for study completers to have lower preintervention BMI was observed (P = 0.08).
TABLE 2.
Preintervention characteristics of study completers1
| Refined grain | Whole grain | |
| Sex, M/F, n | 25/15 | 24/17 |
| Race, n | ||
| Caucasian | 21 | 23 |
| Black | 9 | 9 |
| Hispanic | 2 | 2 |
| Asian | 3 | 6 |
| Other or not reported | 5 | 1 |
| Age, y | 54 ± 52 | 55 ± 6 |
| Weight, kg | 75.4 ± 12.0 | 74.7 ± 12.4 |
| BMI, kg/m2 | 25.7 ± 3.2 | 25.7 ± 3.9 |
| PAEE,3,4 kcal/d | 426 (685) | 508 (727) |
There were no significant differences (χ2 test or independent samples t test).
Mean ± SD (all such values).
PAEE, physical activity energy expenditure estimated with the use of the International Physical Activity Questionnaire.
All values are medians (IQRs).
Analyses of immune and inflammation variables have been reported in detail elsewhere (29). Briefly, changes in markers of immune function indicated modest favorable effects of the whole grain–rich diet relative to that of the refined grain–based diet on the immune response to pathogens, but there were no diet-mediated effects on phenotypic or functional immune variables or inflammation. Total short-chain fatty acid concentrations decreased in the RG compared with in the WG (P-time-by-diet interaction = 0.05), which was attributable to a decrease in stool propionate in both groups (P < 0.001) and a decrease in stool acetate in the RG but not in the WG (P-time-by-diet interaction = 0.02).
Adherence, weight change, and body composition
Plasma alkylresorcinol concentrations increased in the WG but did not change in the RG (P-time-by-diet interaction < 0.0001) (Figure 1). By design, body weight was maintained (P-main effect of time = 0.13), and did not differ between groups (P-time-by-diet interaction = 0.27) (Table 3). The number of participants who required an increase (RG: n = 10; WG: n = 10) or decrease (RG: n = 8; WG: n = 11) in prescribed energy intake did not differ between groups (χ2 = 0.56, P = 0.76). Changes in anthropometric measures (Supplemental Table 2, Table 3) and in total physical activity levels (P = 0.37) did not differ between groups in the primary and secondary analyses.
FIGURE 1.
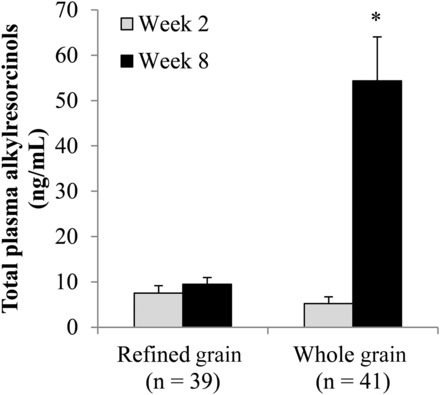
Geometric mean + SEM plasma total alkylresorcinol concentrations before and after the consumption of a refined grain–based diet or a whole grain–rich diet for 6 wk. *Significantly different from the refined-grain group at week 8 (P < 0.0001) and from the whole-grain group at week 2 (P < 0.0001) (repeated-measures ANOVA) (P-time-by-diet interaction < 0.0001).
TABLE 3.
Body composition and resting metabolism before and after 6 wk of consumption of a refined grain–based or whole grain–rich diet1
| Refined grain | Whole grain | P 2 | ||||||||
| n | Week 23 | ΔWeeks 2–84 | n | Week 23 | ΔWeeks 2–84 | β ± SE5 | Model 1 | Model 2 | Model 3 | |
| Body weight, kg | 40 | 75.4 ± 12.0 | −0.5 (−1.1, 0.1) | 41 | 74.7 ± 12.4 | −0.1 (−0.6, 0.5) | 0.4 ± 0.4 | 0.27 | 0.26 | — |
| Body fat, % | 40 | 30.8 ± 8.8 | −0.9 (−1.6, −0.2) | 41 | 31.2 ± 8.6 | −0.2 (−0.9, 0.5) | 0.7 ± 0.5 | 0.15 | 0.13 | 0.28 |
| Fat mass, kg | 40 | 23.2 ± 7.3 | −0.8 (−1.4, −0.2) | 41 | 23.6 ± 8.5 | −0.1 (−0.7, 0.5) | 0.7 ± 0.4 | 0.11 | 0.08 | 0.19 |
| Fat-free mass, kg | 40 | 52.2 ± 10.9 | 0.3 (−0.1, 0.7) | 41 | 51.1 ± 9.2 | 0.1 (−0.4, 0.5) | −0.3 ± 0.3 | 0.43 | 0.40 | 0.20 |
| WC, cm | 39 | 89.3 ± 10.9 | −0.2 (−1.2, 0.8) | 41 | 89.6 ± 11.8 | −0.6 (−1.4, 0.2) | −0.03 ± 0.6 | 0.58 | 0.60 | 0.21 |
| Waist-to-hip ratio | 39 | 0.9 ± 0.1 | −0.001 (−0.01, 0.01) | 41 | 0.9 ± 0.1 | −0.001 (−0.01, 0.01) | 0.0 ± 0.01 | 0.99 | 0.92 | 0.93 |
| RMR, kcal/d | 38 | 1407 ± 272 | −17 (−50, 15) | 40 | 1406 ± 262 | 26 (−16, 68) | 43 ± 25 | 0.09 | 0.04 | 0.04 |
| Adjusted RMR,6 kcal/d | 38 | 1405 ± 122 | −28 (−60, 4) | 40 | 1437 ± 139 | 6 (−36, 47) | 48 ± 23 | 0.04 | — | — |
| RQ | 38 | 0.83 ± 0.05 | 0.01 (−0.003, 0.03) | 40 | 0.82 ± 0.04 | 0.01 (−0.005, 0.03) | −0.01 ± 0.01 | 0.22 | 0.23 | 0.12 |
There were no significant differences during week 2. RMR, resting metabolic rate; RQ, respiratory quotient; WC, waist circumference.
Determined with the use of an ANCOVA. Model 1 was adjusted for the baseline value of the outcome; model 2 was adjusted as for model 1 and for age, sex, and baseline BMI; and model 3 was adjusted as for model 2 and for weight change.
All values are means ± SDs.
All values are means (95% CIs).
Obtained from model 1 with refined grain as the reference group.
Adjusted for age, sex, fat mass, and fat-free mass with the use of the residual method.
Stool characteristics
One participant in each group was noncompliant with one or more of the 72-h stool collections, and both subjects were excluded from analyses of stool characteristics. Changes in stool weight were greater in the WG than in the RG (Table 4). This outcome resulted in a greater change in total daily stool energy content in the WG because stool energy density did not differ between groups. Between-group differences in total stool energy content remained significant when values were recalculated to account for the estimated nonmetabolizable energy contribution of dietary fiber (Table 4) (44). Both changes in stool weight (r = 0.48, P < 0.0001) and changes in the stool energy content (r = 0.37, P = 0.001) were correlated with changes in plasma alkylresorcinol concentrations. Changes in stool total short-chain fatty acid concentrations were significantly correlated with changes in stool weight (r = 0.29, P = 0.01), but not in stool energy density (r = −0.01, P = 0.96). In the secondary analysis, the exclusion of participants who did not adhere to the diet resulted in a slight increase in between-group differences in changes in stool weight and energy content (Supplemental Table 2).
TABLE 4.
Stool characteristics before and after 6 wk of consumption of a refined grain–based or whole grain–rich diet1
| Refined grain | Whole grain | P 2 | ||||||||
| n | Week 23 | ΔWeeks 2–84 | n | Week 23 | ΔWeeks 2–84 | β ± SE5 | Model 1 | Model 2 | Model 3 | |
| Stool weight, g wet weight/d | 39 | 91 (84) | −10 (−26, 7) | 40 | 87 (101) | 62 (42, 82) | 76 ± 12 | <0.0001 | <0.0001 | <0.0001 |
| Stool energy density, kcal/g dry weight | 39 | 5.0 ± 0.3 | −0.03 (−0.13, 0.07) | 40 | 5.1 ± 0.4 | −0.07 (−0.18, 0.05) | −0.03 ± 0.06 | 0.67 | 0.69 | 0.67 |
| Total stool energy, kcal/d | 39 | 125 (98) | −23 (−46, 1) | 40 | 128 (107) | 69 (35, 102) | 96 ± 18 | <0.0001 | <0.0001 | <0.0001 |
| Fiber-adjusted total stool energy,6 kcal/d | 39 | 75 (103) | −23 (−46, −1) | 40 | 82 (111) | 30 (−4, 63) | 57 ± 17 | 0.001 | 0.002 | 0.003 |
There were no significant differences during week 2.
Determined with the use of an ANCOVA. Model 1 was adjusted for the baseline value of the outcome; model 2 was adjusted as for model 1 and for age, sex, and baseline BMI; and model 3 was adjusted as for model 2 and for weight change.
Values are means ± SDs or medians (IQRs).
All values are means (95% CIs).
Obtained from model 1 with refined grain as the reference group.
Calculated as total stool energy – total fiber intake × 2.2 kcal/g. The mean nonmetabolizable energy of fiber is 2.2 kcal/g (44).
RMR
One volunteer in each group did not complete the postintervention RMR measurement, and one individual within the RG was excluded from RMR analyses because of suspected noncompliance with premeasurement instructions in addition to being an outlier. Changes in the RMR were greater in the WG than in the RG (Table 3). This difference was not statistically significant when the participant who was noncompliant with premeasurement instructions was included or after the exclusion of participants who did not adhere to the diet (Supplemental Table 2, secondary analysis). Changes in the adjusted RMR were not associated with changes in plasma alkylresorcinol concentrations (r = 0.11, P = 0.35) or in stool total short-chain fatty acid concentrations (r = 0.07, P = 0.55). No between-group differences in breath hydrogen or methane concentrations were observed (Supplemental Table 3).
Combined changes in RMR and stool energy
Changes in the RMR (kilocalories per day) and changes in fiber-adjusted stool energy content (kilocalories per day) were summed for each participant to quantify the total energetic benefit that was attributable to the whole grain–rich diet. Compared between groups, the favorable energetic effects of the whole grain–rich diet translated into a 92-kcal/d (95% CI: 28-, 156-kcal/d) higher net daily energy loss compared with that of the refined grain–based diet (n = 76, P = 0.005) (Figure 2). This difference increased to 108 kcal/d (95% CI: 34, 182 kcal/d) (n = 61, P = 0.005) in the secondary analysis that excluded participants who did not adhere to the diet.
FIGURE 2.
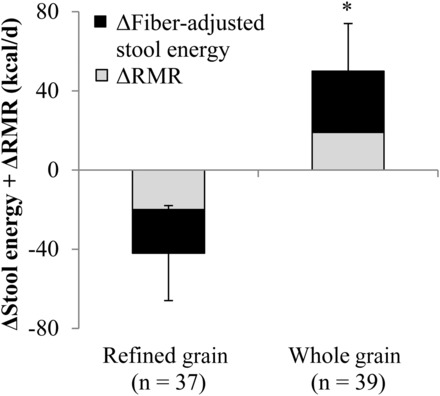
Mean ± SEM combined changes in the RMR and fiber-adjusted stool energy content while consuming a refined grain–based diet or a whole grain–rich diet for 6 wk. *Significantly different from the refined-grain group, P = 0.005 (independent-samples t test). RMR, resting metabolic rate
Glycemia
A total of 41 and 24 study completers opted to participate in the CGM and OGTT measurements, respectively (see Supplemental Results for comparison with other study completers). Usable 24-h CGM data could only be obtained from 34 subjects (RG: n = 17; WG: n = 17) because of technical difficulties with the CGM device or because of noncompliance with the finger-stick blood glucose measurements. One individual in the WG was excluded from the OGTT analyses for noncompliance with premeasurement instructions, and one individual in each group was excluded from the OGTT analysis because of missing data.
Changes in fasting glycemia, insulinemia, and 24-h glucose dynamics did not differ between groups in primary or secondary analyses (Supplemental Table 2, Table 5). Changes in the Glucose-OGTTAUC showed a trend to decrease in the WG compared with in the RG (model 3: P = 0.10) (Figure 3A), and changes in plasma alkylresorcinol concentrations were inversely associated with changes in the Glucose-OGTTAUC (Figure 3B). Changes in stool total short-chain fatty acid concentrations were not significantly correlated with changes in the Glucose-OGTTAUC (r = 0.08, P = 0.74). In the secondary analysis, when participants who were not adherent with the diet were excluded (RG: n = 2; WG: n = 1), the Glucose-OGTTAUC was significantly reduced in the WG compared with in the RG (Supplemental Table 2).
TABLE 5.
Glycemic control before and after 6 wk of consumption of a refined grain–based or whole grain–rich diet1
| Refined grain | Whole grain | P 2 | ||||||||
| n | Week 23 | ΔWeeks 2–84 | n | Week 23 | ΔWeeks 2–84 | β ± SE5 | Model 1 | Model 2 | Model 3 | |
| Fasting serum measure | ||||||||||
| Glucose, mg/dL | 40 | 91 ± 11 | 1 (−3, 4) | 40 | 91 ± 10 | −2 (−4, 1) | −2.0 ± 2.1 | 0.36 | 0.47 | 0.52 |
| Insulin, μU/mL | 40 | 9.5 (6.4) | −0.6 (−1.3, 1.2) | 40 | 8.5 (5.5) | −0.8 (−2.3, 0.7) | −0.7 ± 0.9 | 0.41 | 0.42 | 0.37 |
| HOMA-IR | 40 | 2.3 (1.5) | 0.02 (−0.4, 0.4) | 40 | 2.4 (1.4) | −0.2 (−0.6, 0.2) | −0.2 ± 0.3 | 0.36 | 0.39 | 0.35 |
| QUICKI6 | 40 | 0.35 ± 0.04 | 0 (−0.01, 0.01) | 40 | 0.35 ± 0.03 | 0.01 (0.001, 0.01) | 0.01 ± 0.07 | 0.26 | 0.31 | 0.29 |
| 24-h continuous glucose monitoring | ||||||||||
| 24-h mean, mg/dL | 17 | 97 ± 11 | 2 (−3, 7) | 17 | 100 ± 10 | 3 (−4, 10) | 2.0 ± 3.8 | 0.61 | 0.53 | 0.62 |
| 24-h CV, % | 17 | 11.1 (9.5) | 1.2 (−2.4, 4.8) | 17 | 14.6 (5.1) | 0.3 (−4.0, 4.6) | 1.5 ± 2.0 | 0.46 | 0.42 | 0.60 |
| 24-h SD, mg/dL | 17 | 10.6 (11.2) | 1.7 (−2.2, 5.5) | 17 | 14.9 (5.7) | 1.0 (−2.9, 5.0) | 1.0 ± 2.4 | 0.68 | 0.58 | 0.77 |
| AUC, h × mg/dL | 17 | 2333 ± 253 | 50 (−67, 167) | 17 | 2393 ± 237 | 71 (−100, 242) | 48 ± 92 | 0.60 | 0.54 | 0.62 |
| Oral-glucose-tolerance test | ||||||||||
| Matsuda index | 13 | 6.7 ± 3.1 | 0.2 (−0.7, 1.2) | 8 | 7.4 ± 4.1 | −0.9 (−3.2, 1.4) | −0.9 ± 0.8 | 0.28 | 0.52 | 0.44 |
There were no significant differences during week 2.
Determined with the use of an ANCOVA. Model 1 was adjusted for the baseline value of the outcome; model 2 was adjusted as for model 1 and for age, sex, and baseline BMI; and model 3 was adjusted as for model 2 and for weight change.
Values are means ± SDs or medians (IQRs).
All values are means (95% CIs).
Obtained from model 1 with refined grain as the reference group.
QUICKI, quantitative insulin-sensitivity check index.
FIGURE 3.
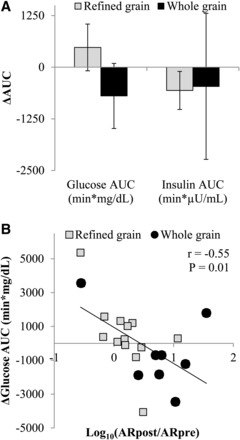
Mean ± SEM changes in the glucose AUC (P = 0.10) and insulin AUC (P = 0.54) that were measured during an oral-glucose-tolerance test that was administered before and after the consumption of a refined grain–based diet (n = 13) or a whole grain–rich diet (n = 8) for 6 wk (A). Change scores were compared with the use of an ANCOVA with the preintervention value, age, BMI, sex, and the weight change during the 6-wk intervention entered as covariates. (B) Changes in total plasma alkylresorcinol concentrations were correlated with changes in glucose AUC (Pearson correlation). Data are presented with outliers included. The exclusion of outliers did not change the significance of any test. ARpost, alkylresorcinol measured after intervention; ARpre, alkylresorcinol measured before intervention.
Appetite, eating behaviors, and food cravings
A trend for the mean self-reported prospective consumption (model 3: P-main effect of group = 0.07) (Figure 4) to be lower in the WG than in the RG was observed. This trend was not observed in the secondary analysis after the exclusion of participants who did not adhere to the diet (model 3: P-main effect of group = 0.16). Hunger, fullness, and diet satisfaction did not differ between groups in the primary analyses (Supplemental Figure 2) or in the secondary analyses. No between-group differences in eating-behavior or food-craving scores were observed (Supplemental Table 4).
FIGURE 4.
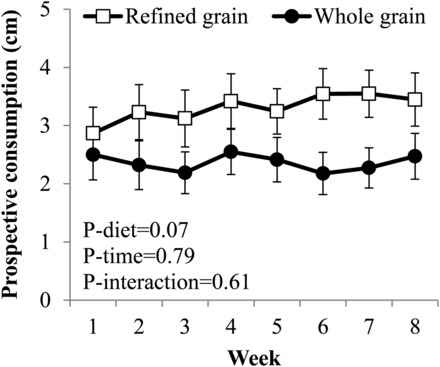
Mean ± SEM weekly self-reported prospective consumption ratings during consumption of a 2-wk run-in diet and while consuming a refined grain–based diet (n = 40) or a whole grain–rich diet (n = 41) for 6 wk. Main and interactive effects of time and diet were examined with the use of marginal models with an unstructured covariance structure. Covariates in the model were means of ratings measured during the run-in phase (weeks 1 and 2), age, BMI, sex, and the weight change during the 6-wk intervention.
Gut-microbiota composition and associations with clinical outcomes
Intervention effects on the composition of gut microbiota have been reported in detail elsewhere (29). Briefly, α diversity and β diversity differed between groups at baseline (P ≤ 0.05) but not after the intervention. Trends for the relative abundance of Enterobacteriaceae, which are a proinflammatory taxa, to decrease in the WG compared with in the RG (FDR-adjusted P = 0.25) and for butyrate-producing Lachnospira (FDR-adjusted P = 0.25) and Roseburia (FDR-adjusted P = 0.30) to increase in the WG compared with in the RG were observed. However, changes in the RMR, stool weight, stool energy content, and Glucose-OGTTAUC were not associated with changes in the relative abundance of any taxa (Supplemental Table 5).
DISCUSSION
This study tested current dietary recommendations to substitute whole grains for refined grains in the diet and to increase dietary fiber intake (45) and identified favorable energetic effects that cumulatively resulted in an ∼100-kcal/d energy deficit and evidence of improved oral glucose tolerance compared with the effects of a typical American diet that is low in whole grains and fiber. To our knowledge, these results provide new mechanistic insights that support the consistent inverse associations between whole-grain intake and BMI and adiposity that have been documented in epidemiologic studies (3–9), but which have been largely unsubstantiated in previous clinical trials (4, 10–17). As such, this study adds support for dietary guidance recommending the consumption of whole grains in place of refined grains.
A central feature of this study is the provision of all food to participants throughout the trial to enhance adherence and the accuracy of dietary intake calculations. With the use of this approach, we showed that the dietary substitution of whole grains for refined grains conferred favorable energetic benefits that were primarily attributable to a greater energy excretion in the stool. Moreover, the magnitude of the effect was estimated to be greater than that attributed to the nondigestible energy content of the fiber itself. The between-group differences in fiber intake and stool weight equated to a difference of 4 g stool/g fiber, which was consistent with recent reports on the relation between stool weight and cereal fiber intake (10, 46). Likewise, the increase in the stool energy content within the WG was consistent with multiple reports that have collectively shown that increasing dietary fiber intake reduces dietary energy digestibility (47, 48). The observation that fiber-adjusted energy excretion in the stool remained higher in the WG than in the RG may suggest that protein and fat digestibility were reduced by whole-grain consumption, which would have been consistent with previous reports on the relation between dietary fiber and macronutrient digestibility (47, 48). However, contributions from small between-diet differences in protein and fatty acid composition and between-group differences in stool short-chain fatty acid concentrations could not be excluded. These findings extend current knowledge as effects may be attributed to whole grains rather than to isolated fiber supplements or diets that contain multiple fiber sources, which, together, comprise much of the evidence base (47). In contrast, Kristensen et al. (15) did not observe increases in stool weight or energy content in a dietary intervention that achieved 105- and 7-g/d between-group differences in whole grain and fiber intakes, respectively, but the difference in fiber intake in the study may have been too small to detect an effect (49). Collectively, these observations suggest that the substitution of whole grains for refined grains in the diet in amounts that exceed current dietary recommendations and increase fiber intake from the population mean to recommended amounts increases stool output, which, in turn, increases energy loss in the stool.
To our knowledge, this study is the first to examine the effects of whole grains compared with refined grains on energy metabolism during weight stability. In one previous weight-loss study, whole-grain intake did not influence the RMR (13). However, weight loss causes reductions in the RMR (50), which may have masked any effect of whole grains on energy metabolism. In contrast, our study suggests that, during weight stability, the dietary substitution of whole grains for refined grains may result in a modest increase in the RMR. Favorable effects of whole-grain intake on energy expenditure are plausible on the basis of previous studies that have collectively shown the thermogenic effects of consuming fermentable fiber in both humans and animals (51). In addition, the between-group difference in the RMR exceeded that which would have been predicted to be due to the heat that is generated from fiber fermentation (0.6 kJ/g fiber) (44). As such, the observed effect of substituting whole grains for refined grains on the RMR is intriguing and plausible. However, note that the between-group difference in the RMR was sensitive to effects of dietary adherence, and cautious interpretation and replication are warranted.
The combined effect of the change in the RMR and the change in the net stool energy loss was clinically relevant. With the use of the energy-balance modeling approach of Hall et al. (52), the 92-kcal/d energy difference would translate into an ∼2.5-kg body weight loss over 1 y if it was uncompensated for by changes in energy consumption or physical activity. Furthermore, the observed trend of lower prospective consumption and the absence of differences in other appetite metrics in the WG than in the RG were consistent with previous controlled-feeding whole-grain studies (16, 27) and suggest that compensatory increases in appetite and energy intake may not occur. Note that this weight-loss estimate is remarkably consistent with the findings of Mozaffarian et al. (7), who reported a 0.2-kg/y decrease in body weight per 1-serving/d increase in whole-grain intake in an analysis of the Health Professionals Follow-Up and Nurses’ Health Study I and II cohorts. According to the value of Mozaffarian et al. (7), the mean between-group difference in whole-grain intake of 13 serving/d in this study would be estimated to result in a 2.6-kg/y weight loss. Taken together, these observations suggest that the energetic benefits of replacing whole grains for refined grains that were identified in this study are of sufficient magnitude to explain the consistent inverse associations between whole-grain intake and BMI that have been reported in epidemiologic studies.
The findings that the postprandial glucose response was reduced in the WG and that this response was associated with the change in plasma alkylresorcinol concentrations support an additional favorable effect of substituting whole grains for refined grains on glucose tolerance. The absence of an effect of whole grains on fasting glycemia and insulinemia, which was consistent with most (10–12, 14, 15, 21, 23, 24) but not all (4, 13, 27) studies, suggests that the underlying mechanism may be a second meal effect whereby short-chain fatty acids that are produced during fermentation of undigested carbohydrate stimulate peptide-YY and glucagon-like peptide-1 secretion from colonic enteroendocrine cells (53), thereby resulting in slowed gastric emptying (54) and potentiated glucose-mediated insulin secretion. Although they were not associated with changes in oral glucose tolerance, higher stool short-chain fatty acid concentrations were observed in the WG than in the RG. Although no between-group differences in 24-h glycemia were observed, this apparent inconsistency with the glucose-tolerance results may have been attributable to both the normal glycemic status of the study population and to the absence of differences in postabsorptive and fasting glycemia.
Study strengths included the provision of full run-in and intervention diets to study participants and the use of biomarkers to assess diet adherence. In addition, the generalizability of the findings was increased by the intentional use of commercially available whole-grain products. However, one limitation of the use of these products while attempting to maintain similar macronutrient distributions between groups is that other foods in the diet could not be exactly matched. In addition, the physiologic benefit of a whole grain–rich diet may have been attenuated by the use of commercially available products because most commercial whole-grain products are made from whole-grain flour rather than from minimally processed intact whole grains. We hypothesize that the use of foods that contain intact whole-grain kernels would elicit an even more pronounced benefit because the particle structure and intactness have been shown to favorably influence laxation, glycemia, and appetite (55, 56). The study findings must also be interpreted in the context of the generally healthy male and postmenopausal female population studied and may not extend to younger or less healthy populations. In addition, this study did not address whether individuals would substitute whole grains for refined grains if they were able to freely choose their diets. Note that the observation that diet satisfaction did not differ between groups suggests that the whole-grain foods were acceptable in this population. Additional study limitations are as follows: OGTT and CGM measurements were conducted in a self-selected subset of the full cohort, which resulted in these analyses being underpowered; nutrient databases were used to determine the energy contents and compositions of study diets; and a mean value was used for the combustible energy of fiber to correct stool energy values.
In conclusion, to our knowledge, these findings provide new evidence of energetic benefits and improved oral glucose tolerance when whole grains replace refined grains in the diet. These findings strengthen the support for basing dietary guidance pertaining to whole-grain consumption on favorable effects relating to the regulation of the energy balance.
Supplementary Material
Acknowledgments
We thank the Metabolic Research Unit staff at the Jean Mayer USDA Human Nutrition Research Center on Aging at Tufts University, Carrie Brown for statistical support, and Michael Thomas for assistance with the alkylresorcinol measurements.
The authors’ responsibilities were as follows—JPK: analyzed the data; JPK, JBB, SMV, BG, AK, and HR: conducted the research; JPK and SBR: wrote the manuscript and had primary responsibility for the final content of the manuscript; PV and DK: analyzed and interpreted the gut-microbiota data; and all authors: designed the research and read and approved the final manuscript. The General Mills Bell Institute of Health and Nutrition reviewed and approved the study protocol and manuscript but played no role in the data collection, analysis, or interpretation. Kerry Ingredients did not contribute financially or intellectually to this research study. SSJ was employed by the General Mills Bell Institute of Health and Nutrition during the study conception and conduct. The remaining authors reported no conflicts of interest related to the study.
ABBREVIATIONS
- CGM
continuous glucose monitoring
- FDR
false-discovery rate
- Glucose-OGTTAUC
AUC of the serum glucose response
- OGTT
oral-glucose-tolerance test
- RG
refined grain–based diet group
- RMR
resting metabolic rate
- WG
whole grain–rich diet group
FOOTNOTES
Supported by the Bell Institute of Health and Nutrition, General Mills Inc., and by the USDA/Agricultural Research Service under agreement 8050-15000-097-01S. JPK was supported by the Science, Mathematics, and Research Transformation Defense Education Program. SMV was supported by a Stanley N Gershoff scholarship from the Tufts University Friedman School of Nutrition Science and Policy; a National Research Service Award for the National Institute of Diabetes and Digestive and Kidney Diseases T32 Research Training Program in Nutrition and Chronic Disease (grant 2T32DK062032-21); and an ASN 2012 Kraft Foods Inc. predoctoral fellowship.
REFERENCES
- 1. Ferruzzi MG, Jonnalagadda SS, Liu S, Marquart L, McKeown N, Reicks M, Riccardi G, Seal C, Slavin J, Thielecke F, et al. Developing a standard definition of whole-grain foods for dietary recommendations: summary report of a multidisciplinary expert roundtable discussion. Adv Nutr 2014;5:164–76. [DOI] [PMC free article] [PubMed] [Google Scholar]
- 2. de Munter JS, Hu FB, Spiegelman D, Franz M, van Dam RM.. Whole grain, bran, and germ intake and risk of type 2 diabetes: a prospective cohort study and systematic review. PLoS Med 2007;4:e261. [DOI] [PMC free article] [PubMed] [Google Scholar]
- 3. Cho SS, Qi L, Fahey GC Jr, Klurfeld DM.. Consumption of cereal fiber, mixtures of whole grains and bran, and whole grains and risk reduction in type 2 diabetes, obesity, and cardiovascular disease. Am J Clin Nutr 2013;98:594–619. [DOI] [PubMed] [Google Scholar]
- 4. Ye EQ, Chacko SA, Chou EL, Kugizaki M, Liu S.. Greater whole-grain intake is associated with lower risk of type 2 diabetes, cardiovascular disease, and weight gain. J Nutr 2012;142:1304–13. [DOI] [PMC free article] [PubMed] [Google Scholar]
- 5. Jonnalagadda SS, Harnack L, Liu RH, McKeown N, Seal C, Liu S, Fahey GC.. Putting the whole grain puzzle together: health benefits associated with whole grains–summary of American Society for Nutrition 2010 Satellite Symposium. J Nutr 2011;141:1011S–22S. [DOI] [PMC free article] [PubMed] [Google Scholar]
- 6. Harland JI, Garton LE.. Whole-grain intake as a marker of healthy body weight and adiposity. Public Health Nutr 2008;11:554–63. [DOI] [PubMed] [Google Scholar]
- 7. Mozaffarian D, Hao T, Rimm EB, Willett WC, Hu FB.. Changes in diet and lifestyle and long-term weight gain in women and men. N Engl J Med 2011;364:2392–404. [DOI] [PMC free article] [PubMed] [Google Scholar]
- 8. McKeown NM, Yoshida M, Shea MK, Jacques PF, Lichtenstein AH, Rogers G, Booth SL, Saltzman E.. Whole-grain intake and cereal fiber are associated with lower abdominal adiposity in older adults. J Nutr 2009;139:1950–5. [DOI] [PMC free article] [PubMed] [Google Scholar]
- 9. McKeown NM, Troy LM, Jacques PF, Hoffmann U, O’Donnell CJ, Fox CS.. Whole- and refined-grain intakes are differentially associated with abdominal visceral and subcutaneous adiposity in healthy adults: the Framingham Heart Study. Am J Clin Nutr 2010;92:1165–71. [DOI] [PMC free article] [PubMed] [Google Scholar]
- 10. Ampatzoglou A, Atwal KK, Maidens CM, Williams CL, Ross AB, Thielecke F, Jonnalagadda SS, Kennedy OB, Yaqoob P.. Increased whole grain consumption does not affect blood biochemistry, body composition, or gut microbiology in healthy, low-habitual whole grain consumers. J Nutr 2015;145:215–21. [DOI] [PubMed] [Google Scholar]
- 11. Brownlee IA, Moore C, Chatfield M, Richardson DP, Ashby P, Kuznesof SA, Jebb SA, Seal CJ.. Markers of cardiovascular risk are not changed by increased whole-grain intake: the WHOLEHEART study, a randomised, controlled dietary intervention. Br J Nutr 2010;104:125–34. [DOI] [PMC free article] [PubMed] [Google Scholar]
- 12. Giacco R, Lappi J, Costabile G, Kolehmainen M, Schwab U, Landberg R, Uusitupa M, Poutanen K, Pacini G, Rivellese AA, et al. Effects of rye and whole wheat versus refined cereal foods on metabolic risk factors: a randomised controlled two-centre intervention study. Clin Nutr 2013;32:941–9. [DOI] [PubMed] [Google Scholar]
- 13. Harris Jackson K, West SG, Vanden Heuvel JP, Jonnalagadda SS, Ross AB, Hill AM, Grieger JA, Lemieux SK, Kris-Etherton PM.. Effects of whole and refined grains in a weight-loss diet on markers of metabolic syndrome in individuals with increased waist circumference: a randomized controlled-feeding trial. Am J Clin Nutr 2014;100:577–86. [DOI] [PMC free article] [PubMed] [Google Scholar]
- 14. Katcher HI, Legro RS, Kunselman AR, Gillies PJ, Demers LM, Bagshaw DM, Kris-Etherton PM.. The effects of a whole grain-enriched hypocaloric diet on cardiovascular disease risk factors in men and women with metabolic syndrome. Am J Clin Nutr 2008;87:79–90. [DOI] [PubMed] [Google Scholar]
- 15. Kristensen M, Toubro S, Jensen MG, Ross AB, Riboldi G, Petronio M, Bugel S, Tetens I, Astrup A.. Whole grain compared with refined wheat decreases the percentage of body fat following a 12-week, energy-restricted dietary intervention in postmenopausal women. J Nutr 2012;142:710–6. [DOI] [PubMed] [Google Scholar]
- 16. Saltzman E, Moriguti JC, Das SK, Corrales A, Fuss P, Greenberg AS, Roberts SB.. Effects of a cereal rich in soluble fiber on body composition and dietary compliance during consumption of a hypocaloric diet. J Am Coll Nutr 2001;20:50–7. [DOI] [PubMed] [Google Scholar]
- 17. Pol K, Christensen R, Bartels EM, Raben A, Tetens I, Kristensen M.. Whole grain and body weight changes in apparently healthy adults: a systematic review and meta-analysis of randomized controlled studies. Am J Clin Nutr 2013;98:872–84. [DOI] [PubMed] [Google Scholar]
- 18. Slavin J.. Why whole grains are protective: biological mechanisms. Proc Nutr Soc 2003;62:129–34. [DOI] [PubMed] [Google Scholar]
- 19. Karl JP, Saltzman E.. The role of whole grains in body weight regulation. Adv Nutr 2012;3:697–707. [DOI] [PMC free article] [PubMed] [Google Scholar]
- 20. Fardet A.. New hypotheses for the health-protective mechanisms of whole-grain cereals: what is beyond fibre? Nutr Res Rev 2010;23:65–134. [DOI] [PubMed] [Google Scholar]
- 21. Andersson A, Tengblad S, Karlstrom B, Kamal-Eldin A, Landberg R, Basu S, Aman P, Vessby B.. Whole-grain foods do not affect insulin sensitivity or markers of lipid peroxidation and inflammation in healthy, moderately overweight subjects. J Nutr 2007;137:1401–7. [DOI] [PubMed] [Google Scholar]
- 22. Bodinham CL, Hitchen KL, Youngman PJ, Frost GS, Robertson MD.. Short-term effects of whole-grain wheat on appetite and food intake in healthy adults: a pilot study. Br J Nutr 2011;106:327–30. [DOI] [PubMed] [Google Scholar]
- 23. Giacco R, Clemente G, Cipriano D, Luongo D, Viscovo D, Patti L, Di Marino L, Giacco A, Naviglio D, Bianchi MA, et al. Effects of the regular consumption of wholemeal wheat foods on cardiovascular risk factors in healthy people. Nutr Metab Cardiovasc Dis 2010;20:186–94. [DOI] [PubMed] [Google Scholar]
- 24. McIntosh GH, Noakes M, Royle PJ, Foster PR.. Whole-grain rye and wheat foods and markers of bowel health in overweight middle-aged men. Am J Clin Nutr 2003;77:967–74. [DOI] [PubMed] [Google Scholar]
- 25. McKeown NM, Marklund M, Ma J, Ross AB, Lichtenstein AH, Livingston KA, Jacques PF, Rasmussen HM, Blumberg JB, Chen CY.. Comparison of plasma alkylresorcinols (AR) and urinary AR metabolites as biomarkers of compliance in a short-term, whole-grain intervention study. Eur J Nutr 2016;55:1235–44. [DOI] [PubMed] [Google Scholar]
- 26. Tighe P, Duthie G, Vaughan N, Brittenden J, Simpson WG, Duthie S, Mutch W, Wahle K, Horgan G, Thies F.. Effect of increased consumption of whole-grain foods on blood pressure and other cardiovascular risk markers in healthy middle-aged persons: a randomized controlled trial. Am J Clin Nutr 2010;92:733–40. [DOI] [PubMed] [Google Scholar]
- 27. Pereira MA, Jacobs DR Jr, Pins JJ, Raatz SK, Gross MD, Slavin JL, Seaquist ER.. Effect of whole grains on insulin sensitivity in overweight hyperinsulinemic adults. Am J Clin Nutr 2002;75:848–55. [DOI] [PubMed] [Google Scholar]
- 28. Ross AB, Bruce SJ, Blondel-Lubrano A, Oguey-Araymon S, Beaumont M, Bourgeois A, Nielsen-Moennoz C, Vigo M, Fay LB, Kochhar S, et al. A whole-grain cereal-rich diet increases plasma betaine, and tends to decrease total and LDL-cholesterol compared with a refined-grain diet in healthy subjects. Br J Nutr 2011;105:1492–502. [DOI] [PubMed] [Google Scholar]
- 29. Vanegas SM, Meydani M, Barnett JB, Goldin B, Kane A, Rasmussen H, Brown C, Vangay P, Knights D, Jonnalagadda S, et al. Substituting whole grains for refined grains in a 6-wk randomized trial has a modest effect on gut microbiota and immune and inflammatory markers of healthy adults. Am J Clin Nutr 2017;105:635–50. [DOI] [PMC free article] [PubMed] [Google Scholar]
- 30. Ross AB.. Present status and perspectives on the use of alkylresorcinols as biomarkers of wholegrain wheat and rye intake. J Nutr Metab 2012;2012:462967. [DOI] [PMC free article] [PubMed] [Google Scholar]
- 31. World Health Organization. Waist circumference and waist-hip ratio: report of a WHO expert consultation. Geneva (Switzerland): World Health Organization; 2008. [Google Scholar]
- 32. Fields DA, Goran MI, McCrory MA.. Body-composition assessment via air-displacement plethysmography in adults and children: a review. Am J Clin Nutr 2002;75:453–67. [DOI] [PubMed] [Google Scholar]
- 33. Matthews DR, Hosker JP, Rudenski AS, Naylor BA, Treacher DF, Turner RC.. Homeostasis model assessment: insulin resistance and beta-cell function from fasting plasma glucose and insulin concentrations in man. Diabetologia 1985;28:412–9. [DOI] [PubMed] [Google Scholar]
- 34. Katz A, Nambi SS, Mather K, Baron AD, Follmann DA, Sullivan G, Quon MJ.. Quantitative insulin sensitivity check index: a simple, accurate method for assessing insulin sensitivity in humans. J Clin Endocrinol Metab 2000;85:2402–10. [DOI] [PubMed] [Google Scholar]
- 35. Weir JB.. New methods for calculating metabolic rate with special reference to protein metabolism. J Physiol 1949;109:1–9. [DOI] [PMC free article] [PubMed] [Google Scholar]
- 36. Karl JP, Roberts SB, Schaefer EJ, Gleason JA, Fuss P, Rasmussen H, Saltzman E, Das SK.. Effects of carbohydrate quantity and glycemic index on resting metabolic rate and body composition during weight loss. Obesity (Silver Spring) 2015;23:2190–8. [DOI] [PMC free article] [PubMed] [Google Scholar]
- 37. Caporaso JG, Lauber CL, Walters WA, Berg-Lyons D, Huntley J, Fierer N, Owens SM, Betley J, Fraser L, Bauer M, et al. Ultra-high-throughput microbial community analysis on the Illumina HiSeq and MiSeq platforms. ISME J 2012;6:1621–4. [DOI] [PMC free article] [PubMed] [Google Scholar]
- 38. Caporaso JG, Kuczynski J, Stombaugh J, Bittinger K, Bushman FD, Costello EK, Fierer N, Pena AG, Goodrich JK, Gordon JI, et al. QIIME allows analysis of high-throughput community sequencing data. Nat Methods 2010;7:335–6. [DOI] [PMC free article] [PubMed] [Google Scholar]
- 39. McDonald D, Price MN, Goodrich J, Nawrocki EP, DeSantis TZ, Probst A, Andersen GL, Knight R, Hugenholtz P.. An improved Greengenes taxonomy with explicit ranks for ecological and evolutionary analyses of bacteria and archaea. ISME J 2012;6:610–8. [DOI] [PMC free article] [PubMed] [Google Scholar]
- 40. Edgar RC.. Search and clustering orders of magnitude faster than BLAST. Bioinformatics 2010;26:2460–1. [DOI] [PubMed] [Google Scholar]
- 41. Matsuda M, DeFronzo RA.. Insulin sensitivity indices obtained from oral glucose tolerance testing: comparison with the euglycemic insulin clamp. Diabetes Care 1999;22:1462–70. [DOI] [PubMed] [Google Scholar]
- 42. Gross TM, Mastrototaro JJ.. Efficacy and reliability of the continuous glucose monitoring system. Diabetes Technol Ther 2000;2(Suppl 1):S19–26. [DOI] [PubMed] [Google Scholar]
- 43. Rodbard D.. New and improved methods to characterize glycemic variability using continuous glucose monitoring. Diabetes Technol Ther 2009;11:551–65. [DOI] [PubMed] [Google Scholar]
- 44. Elia M, Cummings JH.. Physiological aspects of energy metabolism and gastrointestinal effects of carbohydrates. Eur J Clin Nutr 2007;61(Suppl 1):S40–74. [DOI] [PubMed] [Google Scholar]
- 45. US Department of Health and Human Services, USDA. 2015-2020 Dietary Guidelines for Americans. 8th ed. Washington (DC): Institute of Medicine; 2015. [Google Scholar]
- 46. de Vries J, Miller PE, Verbeke K.. Effects of cereal fiber on bowel function: a systematic review of intervention trials. World J Gastroenterol 2015;21:8952–63. [DOI] [PMC free article] [PubMed] [Google Scholar]
- 47. Livesey G.. Energy values of unavailable carbohydrate and diets: an inquiry and analysis. Am J Clin Nutr 1990;51:617–37. [DOI] [PubMed] [Google Scholar]
- 48. Buchholz AC, Schoeller DA.. Is a calorie a calorie? Am J Clin Nutr 2004;79:899S–906S. [DOI] [PubMed] [Google Scholar]
- 49. Baer DJ, Rumpler WV, Miles CW, Fahey GC Jr.. Dietary fiber decreases the metabolizable energy content and nutrient digestibility of mixed diets fed to humans. J Nutr 1997;127:579–86. [DOI] [PubMed] [Google Scholar]
- 50. Müller MJ, Bosy-Westphal A.. Adaptive thermogenesis with weight loss in humans. Obesity (Silver Spring) 2013;21:218–28. [DOI] [PubMed] [Google Scholar]
- 51. Livesey G.. Thermogenesis associated with fermentable carbohydrate in humans, validity of indirect calorimetry, and implications of dietary thermogenesis for energy requirements, food energy and body weight. Int J Obes Relat Metab Disord 2002;26:1553–69. [DOI] [PubMed] [Google Scholar]
- 52. Hall KD, Sacks G, Chandramohan D, Chow CC, Wang YC, Gortmaker SL, Swinburn BA.. Quantification of the effect of energy imbalance on bodyweight. Lancet 2011;378:826–37. [DOI] [PMC free article] [PubMed] [Google Scholar]
- 53. Macfarlane GT, Macfarlane S.. Bacteria, colonic fermentation, and gastrointestinal health. J AOAC Int 2012;95:50–60. [DOI] [PubMed] [Google Scholar]
- 54. Maljaars PW, Peters HP, Mela DJ, Masclee AA.. Ileal brake: a sensible food target for appetite control. A review. Physiol Behav 2008;95:271–81. [DOI] [PubMed] [Google Scholar]
- 55. Holt SH, Miller JB.. Particle size, satiety and the glycaemic response. Eur J Clin Nutr 1994;48:496–502. [PubMed] [Google Scholar]
- 56. Wrick KL, Robertson JB, Van Soest PJ, Lewis BA, Rivers JM, Roe DA, Hackler LR.. The influence of dietary fiber source on human intestinal transit and stool output. J Nutr 1983;113:1464–79. [DOI] [PubMed] [Google Scholar]
Associated Data
This section collects any data citations, data availability statements, or supplementary materials included in this article.