Abstract
With the rapid accumulation of gene expression data, gene functional module identification has become a widely used approach in functional analysis. However, tools to identify organelle functional modules and analyze their relationships are still missing. We present a soft thresholding approach to construct networks of functional modules using gene expression datasets, in which nodes are strongly co-expressed genes that encode proteins residing in the same subcellular localization, and links represent strong inter-module connections. Our algorithm has three steps. First, we identify functional modules by analyzing gene expression data. Next, we use a self-adaptive approach to construct a mixed network of functional modules and genes. Finally, we link functional modules that are tightly connected in the mixed network. Analysis of experimental data from Arabidopsis demonstrates that our approach is effective in improving the interpretability of high-throughput transcriptomic data and inferring function of unknown genes.
Keywords: Arabidopsis thaliana, Organelle, Functional module, Biological network, Gene expression
1. INTRODUCTION
With emerging high-throughput sequencing and phenotyping techniques [1, 2], gene functional module analysis has been extensively applied to explore the system-level functionality of gene groups in microorganisms, plants, animals and humans [3-5]. A gene functional module can be considered as a separated substructure of a biological network [6], i.e., a group of genes that are related by one or more types of biological interactions such as gene co-expression/co-regulation, protein-protein interaction and functional association [7]. In principle, a functional module is topologically and functionally separable from other modules, suggesting that genes in the same module often have tighter relations among themselves than with genes of other modules. These relationships could be better revealed when the network topology is visualized [6]. Zooming in from a whole network to functional modules allows biological researchers to focus on meso-scale gene groups with specific functions and interactions, thus generating testable hypotheses for unknown-function genes more effectively [8].
Functional module analysis is particularly useful for exploring organelle functions [9]. In cell biology, an organelle is a specialized subcellular compartment that has a specific set of functions, and is usually enclosed within its own lipid bilayer [10]. While some organelles are part of the endomembrane system and can receive and send materials through membranous vesicle trafficking, others rely on proteins and enzymes that are regulated at transcriptional, post-transcriptional and allosteric mechanisms [11].
Organelles need to communicate with each other to collaborate and perform complex functions that they cannot do individually [11], and the complex interactions between organelles are often vital for the survival of organisms [12]. However, the underlining mechanism of how organelles coordinate their functions in a cell is still largely unknown [13, 14]. A systematic study of functional modules among multiple functionally-associated organelles in a cell may provide key information to understand how organelles coordinate their functions.
The existing computational work to study organelle-organelle or organelle-nucleus interactions largely relies on gene co-expression analysis. For instance, to examine functional association between mitochondrial and nuclear proteins in humans, gene expression correlation tests have been performed to identify genes encoding nuclear proteins (called nuclear genes in the following text) whose expressions are significantly correlated with genes encoding organelle proteins (called organelle genes in the following text). In such studies, nuclear genes positively-correlated with mitochondrial genes are often thought to be involved in transcriptional regulation, and negatively-correlated genes are more likely to be involved in translation of the mitochondrial genes [15].
While the current organelle interaction models have revealed significant information, they basically ignore the fact that gene expression correlations may vary vastly among proteins that target to the same organelle [15]. For example, under osmotic stress conditions, ribosome genes in Arabidopsis thaliana, a model plant, are strongly co-expressed, but genes that encode endoplasmic reticulum (ER) proteins are weakly co-expressed (Pearson correlation values being 0.89 and 0.64 respectively, (see Table 1) for the overview of the Pearson correlation values of all organelles under seven abiotic stresses) [16]. Many organelles perform a variety of biochemical functions, so it is not surprising that genes encoding these proteins display different levels of gene expression correlation coefficients. Therefore, it makes more sense biologically to identify functional modules within each organelle and then connect these modules to build a network.
Table 1. Averaged Pearson correlation values of all the Arabidopsis genes in each organelle or nucleus under 7 abiotic stress conditions. NA means there are less than 5 significantly expressed genes.
| Treatment | Nucleus | Mitochondria | Chloroplast | ER | Golgi | Vacuole | Vesicle | Ribosome | Peroxisome |
|---|---|---|---|---|---|---|---|---|---|
| Cold | 0.57 | 0.57 | 0.59 | 0.62 | 0.59 | 0.60 | 0.46 | 0.49 | 0.69 |
| drought | 0.54 | 0.50 | 0.46 | 0.46 | 0.47 | 0.48 | NA | 0.66 | 0.56 |
| salt | 0.58 | 0.59 | 0.66 | 0.68 | 0.65 | 0.61 | NA | 0.60 | 0.69 |
| wounding | 0.52 | 0.51 | 0.50 | 0.52 | 0.53 | 0.51 | NA | 0.38 | 0.57 |
| osmotic | 0.64 | 0.71 | 0.76 | 0.64 | 0.67 | 0.70 | 0.58 | 0.89 | 0.75 |
| heat | 0.47 | 0.50 | 0.49 | 0.48 | 0.50 | 0.51 | 0.42 | 0.63 | 0.54 |
| UV | 0.53 | 0.58 | 0.60 | 0.61 | 0.57 | 0.57 | 0064 | 0.62 | 0.54 |
Functional modules need to be studied in context, as high-level biological functions often need the collaboration of multiple organelles to accomplish [12]. For example, exploring functional modules in sensory organelles has successfully revealed the role of cilia-related trafficking in higher organisms [9]. In this article, we introduce a new computational approach to construct networks of organelle functional modules in silico using transcriptomics data. Although by definition the nucleus is also a type of organelle, for simplicity here we only refer to subcellular compartments other than the nucleus as organelles. Analysis of Arabidopsis gene expression data under seven abiotic stresses demonstrates that constructing a summary map of functional modules has significantly improved the interpretability of high-throughput transcriptomic data.
2. BACKGROUND
Methods to infer functional modules from multiple types of biological datasets have been extensively described [17-20]. In general, there are two categories of approaches to discover functional modules.
In the first category, functional modules are detected from well-constructed biological networks, similar to detecting communities in a social network [21]. Heuristic methods have been proposed to identify tightly interacted nodes in a network by devising a network scoring function and then finding all high-score subnetworks [17-20]. While the aforementioned algorithms detect non-overlapped modules, they fail to detect highly overlapping functional modules [21]. To this end, a soft clustering approach was presented to identify overlapping functional modules based on the idea of iteratively executing Markov clustering [21]. This soft clustering method was shown to outperform many approaches in terms of accuracy in functional module inference [21].
In the second category, functional modules are directly detected from high-throughput biological datasets in a matrix format without using biological networks. For example, functional modules are expected to be identified directly from a matrix of gene expression data instead of a network. It is standard to use the Pearson correlation coefficient (PCC) as a co-expression measurement, and to apply a threshold on PCC such that genes are connected if they have a significant pairwise expression profile association across various environmental perturbations [22-24]. However, this is a hard thresholding strategy that may cause loss of information and is sensitive to the choice of the hard threshold [2, 23]. As an alternative approach, algorithm WGCNA was proposed for soft thresholding, which weighs each gene pair and then uses average linkage hierarchical clustering to identify gene groups with highly correlated gene expression profiles across multiple conditions [2].
Some of the current functional module identification approaches use well-constructed gene networks as input, but for most organisms these networks are unavailable. Some other approaches treat every gene equally and disregard the fact that gene correlation coefficients may vary dramatically in different organelles. Therefore, traditional approaches are unfit for organelle functional module discoveries. Furthermore, none of these algorithms study the relationships among functional modules, because identifying such type of relationships, especially to separate causative events from their effects, is often difficult [25, 26].
In-network association pattern discovery has been extensively studied in both social and biological networks. These studies include mining frequent subgraphs to extract communication patterns in data centers [27], inferring friendship network structure by using mobile phone data [28], and identifying spreading pattern of influenza epidemic [29]. The discovered association patterns are tightly associated with node or edge topological properties, such as betweenness and node degree [30]. Applying these algorithms to the network of organelle functional modules may discover in-network associations, which can be explored further for a variety of purposes.
In this article, we present a new platform to construct and analyze networks of organelle functional modules. Our platform has the following advantages:
It can identify functional modules in organelles and nucleus using gene expression data. It does not require a biological network as input, which could be difficult to build due to vastly different gene expression correlation levels in different organelles.
Our soft thresholding algorithm allows us to build a network of functional modules for nucleus and multiple functionally associated organelles. The connections between functional modules of the nucleus and other organelles may reveal regulatory or signal transduction events.
Through analysis of experimental data obtained from Arabidopsis thaliana, we demonstrate the effectiveness of our method over the hard threshold approaches in interpreting Arabidopsis gene expression datasets.
3. METHOD
We propose a new algorithm to discover organelle-to-organelle and organelle-to-nucleus functional associations. Our method has three steps (see Fig. 1). First, we identify functional modules by analyzing gene expression data. Second, we use a self-adaptive thresholding approach to connect each functional module with the rest of the genes, resulting in a mixed network. Finally, we identify strong links between functional modules in the mixed network.
Fig. (1).
Workflow to construct the network of organelle functional modules.
Different from the method proposed by Amar and Shamir 2014 [12], which connects two functional modules by checking whether their genes are directly connected in an extra dataset (often being protein-protein interactions or genetic interactions), we examine functional module connectivity via the third party, i.e., genes not in any functional modules. A clear advantage of our method is that it does not rely on extra datasets. Using extra dataset may cause information loss and limit the use of the tool only to well-studied organisms, since pair-wise gene interaction datasets usually have much fewer number of genes than gene expression datasets.
3.1. Organelle Functional Module Identification
In order to identify organelle and nuclear functional modules, we first denote the subcellular localization information to every Arabidopsis gene by selecting twelve organelle terms in the cellular component category of Gene Ontology [31] (Table S1 (3.8MB, pdf) ), and associating a gene with an organelle if the gene is contained in the annotation gene set of the corresponding organelle term (after gene annotation propagation in GO). We notice that the vast majority of organelle (such as mitochondrial and plastid) proteins are encoded in the nucleus, synthesized by cytosolic ribosomes and subsequently imported into the organelles via active protein transport systems. Protein targeting is usually highly specific. However, despite the profound differences in the organelle import machineries, a certain number of proteins are imported into multiple organelles. Specifically, the proportion of the cross-organelle genes in the Arabidopsis genome is constantly low in all the abiotic treatment data (see details in Table S2 (3.8MB, pdf) ). Therefore, for genes that appear in multiple organelles, we make a copy of them for each corresponding organelle. Genes that lack location information are discarded.
In the next step, we identify functional modules in each organelle using algorithm WGCNA, where each module is a cluster of densely interconnected genes in the same organelle. WGCNA firstly measures the similarities between gene expression profiles across all conditions using PCC and normalize them using jackknifed correlation coefficient. The normalized similarities are then transformed into an adjacency matrix. To avoid unnecessary loss of information, WGCNA uses two soft adjacency functions instead of a hard threshold. Next, an average linkage hierarchical clustering approach is used to group genes with coherent expression profiles. On the hierarchical clustering tree, a height cutoff is chosen to cut branches off the tree, resulting in gene functional modules, i.e., sets of highly co-expressed genes. The choice of the height cut-off is guided by the topological overlap matrix plot [2]. For each functional module, WGCNA computes its eigengene expression profile for further use.
Finally, a GO enrichment test using GOTermFinder [32] is applied to all the functional modules identified by WGCNA. The background set of the enrichment test is all the significantly expressed genes in the input gene expression dataset. A functional module is considered to be functionally enriched if there exists at least one GO biological process term with its adjusted p-value less than 0.05. Only the enriched functional modules are outputted to the next step.
3.2. Mixed Network of Functional Modules and Genes
After identifying all the GO enriched functional modules, we connect them to construct a network of organelle functional modules. A straightforward approach is to use the soft adjacency matrix built by WGCNA to connect the functional modules. However, a clear drawback of the soft adjacency matrix is that it is not clear what the direct neighbors of a given functional module are. In particular, when neighbors of a functional module need to be explicitly listed, we have to binarize the values in the adjacency matrix. This is equivalent to the standard approach of hard thresholding the co-expression similarities, which are clearly not applicable to the identification of associations of organelle functional modules, since gene correlation coefficients vary greatly across all organelles (as shown in Table 1). Therefore, the WGCNA soft adjacency matrix cannot be directly used.
To solve this problem, we identify the relationships between organelle functional modules by constructing a mixed network. The mixed network has two types of nodes: functional modules and individual genes that do not belong to any functional modules. The latter type of nodes is important because they may indicate the coordination pattern between functional modules.
In a mixed network, two nodes are connected if they are significantly correlated in gene expression. Specifically, we calculate PCC pair-wisely for all the nodes (for functional modules, their eigengene expressions are used), and then compare this PCC with a soft threshold (see discussion below). If a PCC value is greater than its soft threshold, the corresponding entry in the adjacency matrix Madj is 1, otherwise, it is 0. To efficiently construct the mixed network, we set Madj(i,j) to 0 if the PCC value of node i and j is smaller than a user-provided lower-bound threshold. The lower-bound threshold is set to avoid high computational cost in network construction. It is based on the assumption that an organelle association network, similar to the other biological networks, is a sparse network [33].
The key challenge here is to define a reasonable soft thresholding criterion to determine whether an edge in Madj should be preserved or deleted. It has been found that genes that encode proteins functional in the same biological process or pathway are often well co-expressed [34, 35]. For example, in a pathway including a functional module m and a gene g, the gene expression correlations between the genes in m is similar to that between g and at least one gene in m. In the context of a mixed network where pathways are not well defined, we assume the probability that both functional module m and gene g are in the same pathway is anti-correlated with the distance between m and g. We construct the mixed network in two steps.
Step 1. Determine the Core Threshold
Given a functional module m, we determine its core threshold (CT) using Equation 1:
where sim(m) is the averaged PCC value in functional module m when the genes in m are sparsely connected, meaning that the number of nodes and the number of edges are comparable (in our experiment, we set the ratio of the two to be 1:1). Function neighbor(m) returns all the direct neighbor genes of m after applying the user-provided lower-bound threshold. The direct neighbor genes of m are genes which PCC scores with m are greater than the lower-bound threshold. Function sim(m, neighbor(m)) is the averaged PCC value between the eigengene expression profile of m and its neighbors. sim(m), the first part of Equation 1 is the internal PCC of a functional module, and the second part (sim(m,neighbor(m))) is added to avoid high false positives when the functional module internal PCC value is too small.
Step 2. Constructing a Mixed Network
Next, we compute a soft threshold for each gene pair (or gene-module pair) using gene expression values and the topological character of the mixed network. Mathematically, we define soft threshold ST for functional module m and gene g as the sum of two components, shown in Equation 2:
where HT is a user-provided hard threshold and CT(m) is the core threshold of m (Equation 1). We assume that the chance for both functional module m and gene g to be in the same pathway decreases gradually as the distance between them increases. Therefore, the influence coefficient function ic(m,g) is defined as a transformed sigmoid function such that the influence of functional module m decreases from one to zero with the increasing distance from m. Mathematically, ic(m,g) is defined in Equation 3:
where dist(m,g) is the length of the shortest path between m and g; and CT(m) is the core threshold of m (Equation 1).
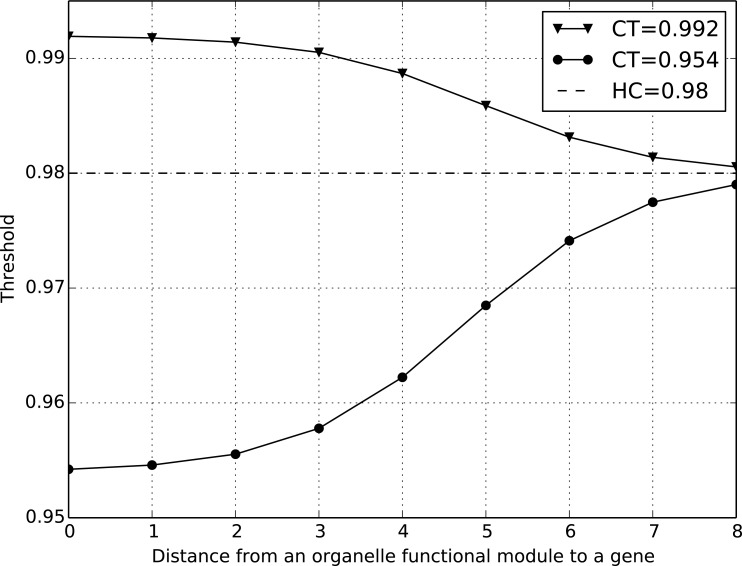
Here HT is used to identify genes far from a module. For example, if gene g is 10 steps away from module m, then ic(m, g) is close to 0, i.e. ST(m,g) ≈ HT. An illustrative example of soft thresholding is shown in (Fig. 2). The soft threshold ST changes gradually as the distance between an organelle functional module and a gene increases. For the functional module represented by the green line, its CT is smaller than HT, so the ST gradually increases from CT to HT as the distance from m to g increases. For another functional module (blue line), its CT is greater than HT. Therefore, its ST smoothly decreases from CT to HT.
Fig. (2).
An example of the soft thresholding approach. The soft threshold ST changes gradually with the change of distance between an organelle functional module and a gene.
Computationally, we adopt the breadth-first search algorithm [36] to construct the mixed network G(m) for each functional module m (see details in function GenerateMixedNetwork in Algorithm 1). In the algorithm, we start with G(m) that only has one node, i.e., m, and then iteratively add genes and links to the boundary gene set of G(m) (see Definition 1). In the kth iteration, a mixed network G(m) includes functional module m and the k gene. For any gene (g) not in G(m), we compute the edge correlation coefficient between g and all the genes in the boundary gene set of G(m). If at least one edge correlation coefficient value is greater than ST(m,g), we add g and the corresponding links into the mixed network G(m). Particularly, for edge e between genes g1 and g2, which are in the boundary gene set, we add e to G(m) if its edge correlation coefficient value is greater than ST(m,g1) or ST(m,g2). In our experiment, we stop the iteration when the ic(m,g) decrease to 0.05.
Definition 1. Boundary gene set. Given a mixed network G(m), the boundary genes are the genes whose distance to m is greater than any of its neighbors in G(m).
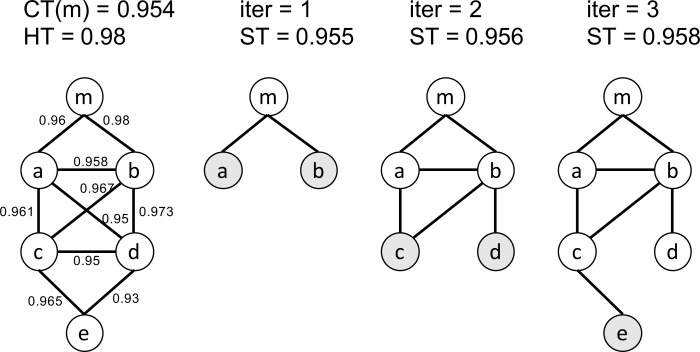
An illustrative example is shown in (Fig. 3). Given a functional module m, the initial mixed network G(m) has only one node m and the initial boundary gene set is {m}. Given two threshold CT(m) = 0.954 and HT = 0.980, we iteratively add nodes and edges to G(m). In the first iteration, ST = 0.955 according to Eq 2. We check all the nodes that are connectable to the boundary gene set and identify two edges <m, a> and <m, b>. Since their weights are both larger than ST, nodes a, b and edges <m, a>, <m, b> are added to G(m). In the next iteration, the boundary gene set is updated to to {a, b}. We check the edges between the boundary genes, i.e. a and b, and all the nodes that are connectable to the boundary gene set. The process continues until no genes can be added to G(m).
Fig. (3).
An example of the soft thresholding algorithm. Nodes in dark color represent the boundary gene set in each iteration. The leftmost network represents the adjacency matrix Madj after applying the user-given lower bound threshold. The numbers on the edges indicate the weights of the edges (PCC values).
We construct the final mixed network with all the gene modules in two steps. First, we generate all the single-module mixed networks. Second, we adopt a voting process to integrate all the single-module mixed networks (see details in function VoteMixedNetworks in Algorithm 2). The soft threshold list of each edge has k elements, which can be divided to two groups depending on whether a soft threshold is greater or smaller than the PCC value of the edge. If the summed difference between the PCC and the soft thresholds in the former group is larger than that in the latter group, we add the edge to the final mixed network.
3.3. Network of Organelle/Nucleus Functional Modules
After establishing the final mixed network, we build a network of organelle/nuclear functional modules to explore how nuclear genes regulate the expression of organelle genes and how organelle genes are coordinately expressed. For simplicity, we require that in the network each organelle functional module connects to at most one nuclear functional module, while a nuclear functional module can connect to multiple organelle functional modules. Subsequently, a nuclear functional module becomes a hub node surrounded by organelle functional modules.
In addition to GO based sematic similarity [37-39] between all corresponding gene pairs, we adopt three network topological measurements to measure organelle-nuclear functional module connection, i.e., maximal flow [40], minimum edge cut [41], shortest path length [42] in the mixed network. For fair comparison, we rescale the values in each measurement to the same range (between 0 and 100) and add up all of the four rescaled values. Note that we reverse the shortest path length, because the shorter the path between two functional modules, the more likely they have coordinated functions. If a final score is above 75% percentile of all the values, we connect the corresponding organelle and nuclear functional modules.
4. EXPERIMENTAL RESULTS
We next determine whether this method can be applied to transcriptomic data obtained from Arabidopsis plants under various stress conditions. The responses of the model plant Arabidopsis thaliana to abiotic stresses are accompanied by significant changes in transcriptome composition of genes that encode both nuclear and organellar proteins [16]. In order to obtain a comprehensive view of how stresses may coordinately change the expression of organelle and nuclear genes, we analyzed the effects of salt, osmotic, cold, UV, drought, wounding, and heat stresses using publically available microarray data.
We implemented the organelle functional module network construction method using python version 2.7.5 (http://www.python.org/download/releases/2.7.5) and package networkx-1.9.1 (http://networkx.github.io). The experiments were run on an Ubuntu 13.10 computer with 4 GB RAM.
4.1. Experimental Data and Preprocessing
The Arabidopsis abiotic gene expression data set was downloaded from GEO website under accession number GSE 13584. The Gene Ontology data set and the Arabidopsis gene annotation data set were downloaded from the Gene Ontology website dated on July 2013.
In the abiotic gene expression data analysis, three biological replicates for abiotic stress lines under either salt, osmotic, cold, heat, UV, wounding, or drought were compared against three biological replicates of mock control lines at the same time points. Statistically significant differences in gene expression between treatment and control plants were detected at a fold change of 2 and FDR of 0.01 using the LIMMA (Bioconductor) package [43].
We denoted the subcellular localization information in Gene Ontology to every significantly expressed gene under each stress condition, and discarded the genes that lack location information. We also discarded organelles such as glyoxysome and lysosome, since glyoxysome is a type of peroxisome and has only one significantly expressed gene in our datasets, and plants do not have lysosomes.
4.2. Organelle Functional Module Identification
We identified functional modules in each organelle using algorithm WGCNA, where each module is a cluster of densely connected genes in the same organelle. The parameters of WGCNA that we used are as follows:
The parameters in function adjacency: softPower = 6, type = “signed hybrid”;
Hierarchical clustering function: flashClust, method = “average”;
We used “cutreeDynamic” function to identify all the functional modules. The parameters are pamStage = FALSE, deepSplit =4, and minClusterSize = 5.
For each functional module, we computed its eigengene expression profile. We then applied GO enrichment test on all the functional modules. The GO enrichment test shows that 50.0% of the functional modules identified by WGCNA are GO enriched (see summary in Table 2 and detailed gene lists in Supplementary Table S3 (3.8MB, pdf) ).
Table 2. Number of modules WGCNA detected and number of GO enriched modules in each organelle or nucleus under 7 abiotic stress conditions. For x/y filled in each cell, x represents number of modules WGCNA detected, and y indicates number of GO enriched modules.
| Treatment | Nucleus | Mitochondria | Chloroplast | ER | Golgi | Vacuole | Vesicle | Ribosome | Peroxisome |
|---|---|---|---|---|---|---|---|---|---|
| Cold | 34/92 | 7/28 | 30/43 | 7/9 | 7/15 | 7/18 | 1/1 | 3/3 | 3/4 |
| drought | 15/34 | 4/12 | 9/15 | 1/4 | 3/5 | 3/6 | 0/0 | 1/1 | 1/1 |
| salt | 18/48 | 8/15 | 17/27 | 4/5 | 1/8 | 4/11 | 0/0 | 3/3 | 3/3 |
| wounding | 10/38 | 6/10 | 8/17 | 2/4 | 4/6 | 1/6 | 0/0 | 0/0 | 1/1 |
| osmotic | 28/63 | 12/25 | 19/32 | 8/9 | 6/11 | 11/13 | 1/1 | 4/4 | 3/3 |
| heat | 32/81 | 16/28 | 23/43 | 6/8 | 7/10 | 10/14 | 0/0 | 6/6 | 2/2 |
| UV | 47/100 | 12/22 | 20/42 | 5/9 | 7/13 | 11/20 | 0/0 | 4/5 | 4/4 |
4.3. Mixed Network of Functional Modules and Genes
We generated a mixed network for each stress condition. In our experiment, the lower bound threshold of PCC and HT were set to be 0.95 and 0.98 respectively for all stress conditions.
(Table 3) shows the number of nodes and edges of each mixed network, and the number of functional modules. The number of significantly expressed genes is the highest under osmotic and the lowest under drought conditions. Therefore, the osmotic mixed network is the largest among all the seven networks, whereas the drought network is the smallest. The network of UV has the highest number of nuclear and organellar functional modules (in total 105 functional modules).
Table 3. Number of nodes, edges and functional modules of each mixed network under 7 abiotic stress conditions.
| Treatment | #Nodes | #Edges | #Nucleus-Modules | #Organelle-Modules |
|---|---|---|---|---|
| Cold | 3064 | 32301 | 34 | 62 |
| drought | 550 | 1236 | 14 | 16 |
| salt | 1562 | 8938 | 12 | 37 |
| wounding | 791 | 2620 | 8 | 18 |
| osmotic | 3318 | 37412 | 28 | 62 |
| heat | 1341 | 3150 | 27 | 58 |
| UV | 2209 | 8810 | 45 | 60 |
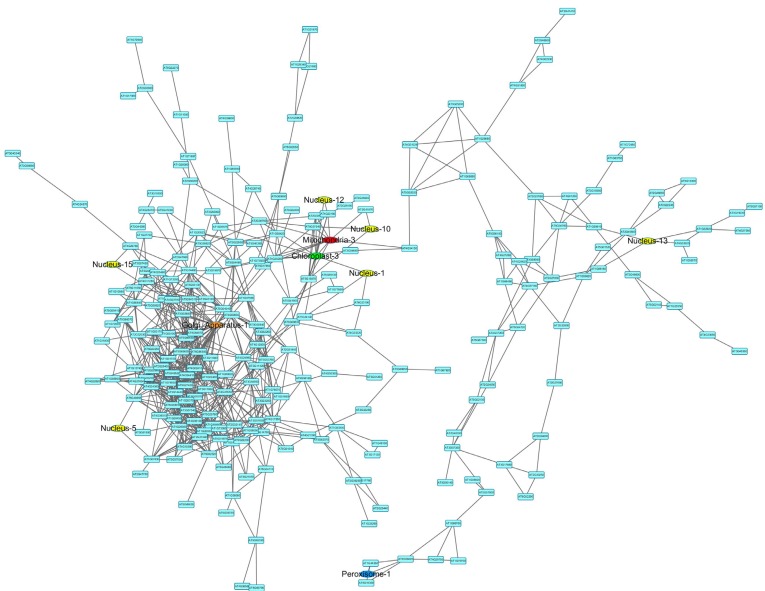
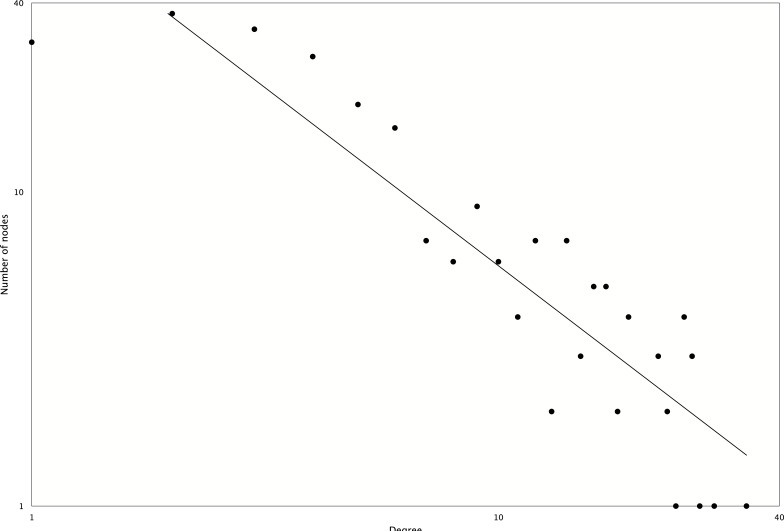
Among all the mixed networks, the drought network is composed of one large and several small subnetworks. The largest connected subnetwork was visualized in (Fig. 4) using Cytoscape version 3.02 [44]. Network topological analysis shows that it is a scale-free network with an r2 value of 0.84 (see degree distribution in Fig. 5). The network has six nuclear functional modules (see yellow colored nodes in Fig. 5), and three of them are closely connected to a mitochondrial and a chloroplast functional module. Gene Ontology analysis reveals that the genes in the closely connected functional modules are enriched in signal transduction and immune response (adjusted p-value<0.05).
Fig. (4).
The mixed network of Arabidopsis thaliana under drought conditions. In the network, blue colored nodes are genes that do not belong to any functional modules, yellow colored nodes are nuclear functional modules, and nodes in other colors are organelle functional modules as indicated. A higher-resolution figure is available in supplemental document.
Fig. (5).
Degree distribution of the mixed network of drought. The r2 of power law curve fitting is 0.84.
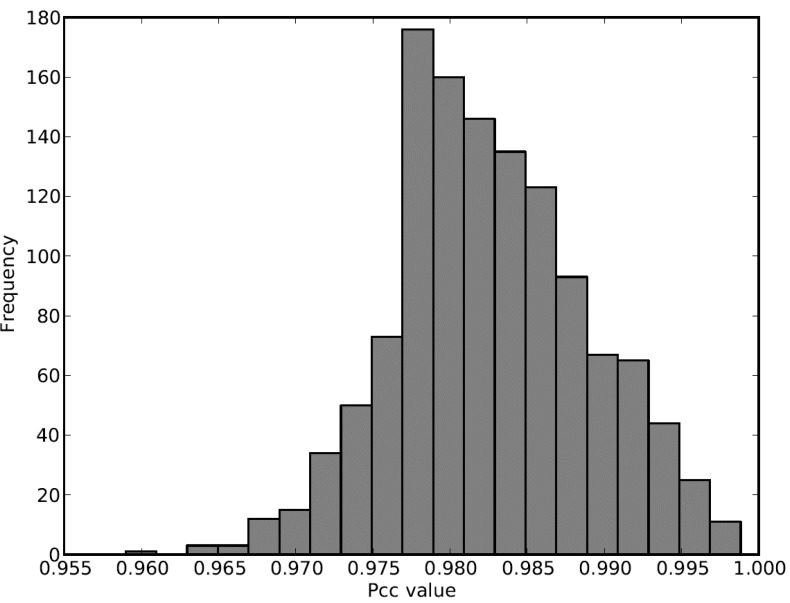
The distribution of PCC values of all the edges shown in (Fig. 6) reveals that at least half of the existing edges will be deleted if a hard threshold approach is applied (HT=0.98), making all the weakly co-expressed functional modules into orphan nodes. With our soft thresholding approach, even using the same threshold (HT=0.98), we could adaptively connect the weakly co-expressed organelle functional modules to the rest of the network.
Fig. (6).
Distribution of PCC values for all the edges in the mixed network of drought, where ST ranges from 0.955 to 0.980 and HT is fixed at 0.980.
Surprisingly, unlike the network of drought, the mixed networks of cold, osmotic, UV, salt, wounding and heat conditions each have two or three large and similar-sized subnetworks (see Suppl Fig. S1 (3.8MB, pdf) -S6 (3.8MB, pdf) ), suggesting a different pattern of genomic response under these stress conditions.
We generated multiple networks under drought treatment using different LT and HT thresholds, in order to test the sensitivity of our algorithm. First, we fixed the HT threshold as 0.98 and varied LT from 0.8 to 0.95 by 0.05 (see Table S4 (3.8MB, pdf) ). Second, we fixed the LT threshold as 0.95 and varied HT from 0.96 to 0.99 by 0.01 (see Table S5 (3.8MB, pdf) ). Third, we fixed LT as 0.8 and varied HT from 0.85 to 0.98 (see Table S6 (3.8MB, pdf) ). The results show that when one of the thresholds is selected appropriately, our algorithm is not sensitive to the change of the other one (see Table S4 (3.8MB, pdf) and 5). However, if both thresholds are improperly set, the network can change a lot (see Table S6 (3.8MB, pdf) ).
We compared our mixed networks with the networks generated by using a hard threshold. To ensure fair comparison, the hard-threshold networks have the same number of genes as our networks. First, we compared the number of chloroplast genes in the hard-threshold network vs. our network. The result shows that our network can remains more organelle genes than the hard-threshold network under all the abiotic stress conditions (see Table S7 (3.8MB, pdf) ). Second, we counted the number of genes involved in the GO enriched functional modules in our networks and compared it with that in the hard-threshold networks. The result shows that our algorithm can constantly identify more GO enriched genes than the hard-threshold networks (see Fig. S8 (3.8MB, pdf) ).
4.4. Network of Functional Modules
On the mixed network of each stress condition, we measured the connections between the organelle and the nuclear functional modules pair-wisely using the method described in subsection 3.3. For each stress condition, we generated a hub-like functional module network, in which the center nodes are nuclear functional modules, the surrounding nodes are organelle functional modules, and the edges represent strong functional associations between them. The network of functional modules may lead to new hypotheses on how organelles are co-regulated or signal transduction events between nucleus and organelles.
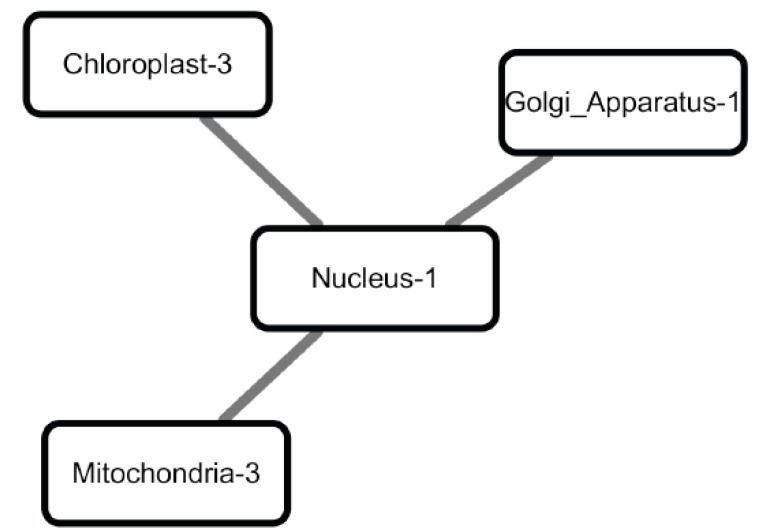
Our data analysis results support some of the previous reports on nuclear regulation in stress conditions. For example, the network of functional modules in drought consists of one nuclear functional module and three organelle functional modules (chloroplast, mitochondria and Golgi), forming a star graph (Fig. 7). The centered nuclear functional module contains 11 transcription factors (see the full gene lists in Table 4), among them bZIP60 (AT1G42990) is a transcription factor activated under conditions that induce unfolded protein response (UPR), a signaling pathway that up-regulates the expression of ER-chaperones [45]. After its activation and translocation into the nucleus, bZIP60 regulates the expression of genes that encode components of the UPR [46, 47]. Our model predicts that some of the genes in the Golgi, mitochondrial and chloroplast functional modules may be targets of bZIP60 and/or other proteins in the nuclear module.
Fig. (7).
The network of functional modules under drought conditions. Gene Ontology analysis reveals that these genes are enriched in signal transduction and immune system process.
Table 4. The lists of genes in the nuclear functional modules and the three organelle functional modules in Figure 7.
| Nucleus-1 | Golgi_Apparatus-1 | Chloroplast-3 | Mitochondria-3 |
|---|---|---|---|
| AT5G52760 | AT2G47770 | AT1G18740 | AT1G73500 |
| AT1G42990 | AT5G59220 | AT5G44070 | AT5G61810 |
| AT4G17230 | AT1G27200 | AT3G14050 | AT5G43150 |
| AT3G50260 | AT3G28340 | AT2G26530 | AT2G35710 |
| AT5G26920 | AT3G50760 | AT1G66090 | AT1G21790 |
| AT3G46110 | AT1G29330 | AT1G72520 | AT1G50740 |
| AT1G77450 | AT5G67210 | AT5G54300 | AT5G06320 |
| AT1G73805 | AT2G23810 | AT5G63790 | AT5G10695 |
| AT5G63790 | AT5G06320 | AT3G48090 | AT3G06500 |
| AT2G17040 | AT4G19120 | AT5G56980 | AT4G01950 |
| AT2G22080 | AT5G47910 | AT4G23810 | AT1G02390 |
| AT1G76650 | AT1G43910 | AT1G27770 | AT4G36500 |
| AT2G46510 | AT3G25600 | AT1G61890 | AT3G55840 |
| AT5G59550 | AT5G37770 | AT5G66210 | |
| AT1G74430 | AT2G20370 | ||
| AT3G08720 | AT4G30280 | ||
| AT3G15210 | AT1G05170 | ||
| AT4G18880 | |||
| AT3G16720 | |||
| AT4G23810 | |||
| AT5G52750 | |||
| AT4G14365 | |||
| AT5G62020 | |||
| AT4G35110 |
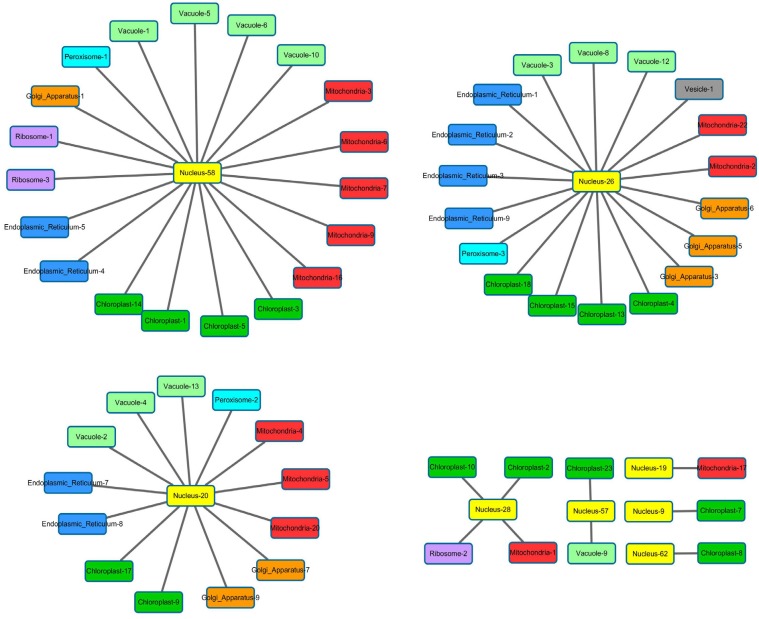
The network of functional modules under osmotic stress consists of three major star graphs that each contains more than ten functional modules (Fig. 8). Here, a nuclear functional module connects to functional modules in six to seven organelles. Gene Ontology analysis reveals that the genes in (Fig. 8A) are enriched in primary metabolic process and organic substance biosynthetic process, whereas genes in (Fig. 8B) are enriched in vesicle-mediated transport, Golgi vesicle transport, intracellular transport, cellular catabolic process and vacuolar transport. Genes in (Fig. 8C) are enriched in fatty acid beta-oxidation, lipid oxidation, lipid modification and fatty acid catabolic process. ATH1 (AT4G32980) was found in nuclear functional module No. 28, which is connected to ribosome, mitochondria and chloroplast functional modules. ATH1 encodes a transcription factor in chlorophyll biosynthetic and chlorophyll metabolic processes [48, 49], suggesting that some of the genes in the chloroplast modules may be targets for ATH1.
Fig. (8).
The network of functional modules under osmotic stress consists of three major star graphs. Color represents different type of organelles. Each star graph has multiple types of organelles, suggesting organelles need to interact with each other to deliver complex functions, and according to Gene Ontology the three star graphs have distinct functions.
There are only one or two major star graphs under the other stress conditions (see Suppl Fig. S7 (3.8MB, pdf) -12 (3.8MB, pdf) ). Under all the stress conditions a nuclear functional module always connects to multiple types of organelles, suggesting that these different organelles may need to coordinate their function in various stress conditions [11].
4. CONCLUSION
With the rapid accumulation of omics data, gene functional module identification has become a powerful approach in gene function analysis. However, gene expression correlation coefficients change greatly among genes that encode proteins localized to different organelles. It is not suitable to use a fixed and relatively high threshold to discover connections between weakly co-expressed organelle gene groups.
In this article, we hypothesize that for an organelle functional module, the in-module gene expression correlation should be similar to that of the genes directly connected to the functional module, and the influence of the module to the other genes gradually decreases as the distance between them increases. Subsequently, we propose a soft thresholding approach to construct networks of functional modules under seven stress conditions, where nodes are co-expressed genes in the same subcellular location and edges represent inter-module connections. Compared with studying each individual functional modules separately, the ability to construct a summary map of all functional modules allows us to improve the interpretability of the transcriptomics data.
The experiment results on Arabidopsis abiotic stress data sets show that our method is able to identify biologically interesting organelle and nuclear functional module connections from high-throughput transcriptomic data. With our new method to group and link genes, we may be able to identify new functions of genes in certain processes and reveal mechanisms that underlie the communication between organelles.
Fig. (A1).
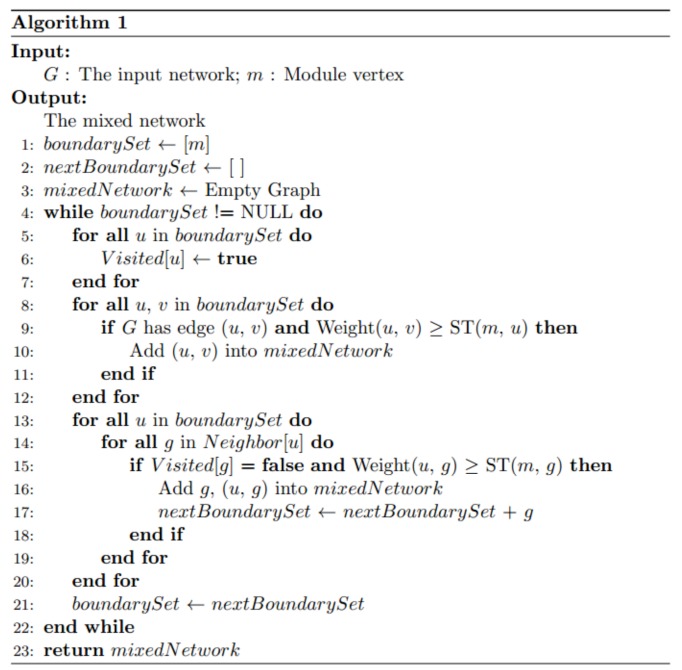
Generating a mixed network for each functional module using a soft thresholding strategy.
Fig. (A2).
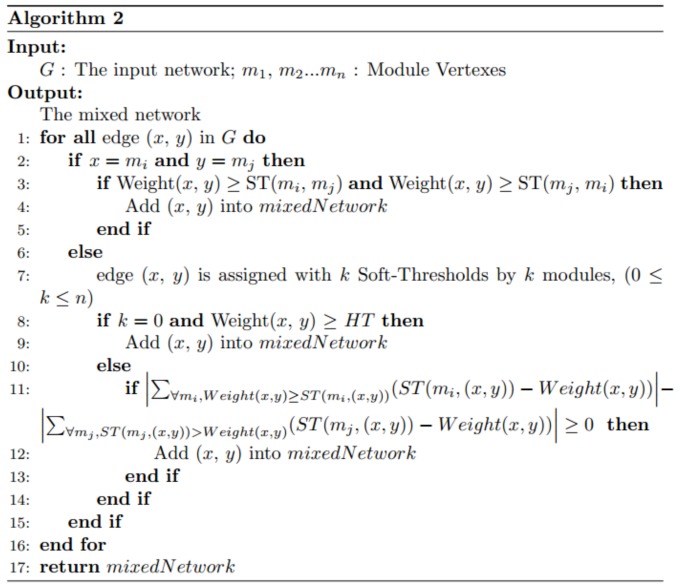
Integrating all the mixed networks using a voting process.
ACKNOWLEDGEMENTS
This work was supported by US Department of Energy, Office of Basic Energy Sciences (no. DE-FG02-91ER 20021), National High Technology Research and Development Program of China (no. 2012AA020404, 2012AA 02A602 and 2012AA02A604), and China Scholarship Council.
SUPPLEMENTARY MATERIALS
Supplementary material is available on the publisher’s web site along with the published article.
CONFLICT OF INTEREST
The author(s) confirm that this article content has no conflict of interest.
REFERENCES
- 1.Wang X., Castro M.A., Mulder K.W., Markowetz F. Posterior association networks and functional modules inferred from rich phenotypes of gene perturbations. PLOS Comput. Biol. 2012;8(6):e1002566. doi: 10.1371/journal.pcbi.1002566. [DOI] [PMC free article] [PubMed] [Google Scholar]
- 2.Langfelder P., Horvath S. WGCNA: an R package for weighted correlation network analysis. BMC Bioinformatics. 2008;9(1):559. doi: 10.1186/1471-2105-9-559. [DOI] [PMC free article] [PubMed] [Google Scholar]
- 3.Eisen M.B., Spellman P.T., Brown P.O., Botstein D. Cluster analysis and display of genome-wide expression patterns. Proc. Natl. Acad. Sci. USA. 1998;95(25):14863–14868. doi: 10.1073/pnas.95.25.14863. [DOI] [PMC free article] [PubMed] [Google Scholar]
- 4.Boruc J., Van den Daele H., Hollunder J., Rombauts S., Mylle E., Hilson P., Inzé D., De Veylder L., Russinova E. Functional modules in the Arabidopsis core cell cycle binary protein–protein interaction network. Plant Cell. 2010;22(4):1264–1280. doi: 10.1105/tpc.109.073635. [DOI] [PMC free article] [PubMed] [Google Scholar]
- 5.Basso K., Margolin A.A., Stolovitzky G., Klein U., Dalla-Favera R., Califano A. Reverse engineering of regulatory networks in human B cells. Nat. Genet. 2005;37(4):382–390. doi: 10.1038/ng1532. [DOI] [PubMed] [Google Scholar]
- 6.Tornow S., Mewes H. Functional modules by relating protein interaction networks and gene expression. Nucleic Acids Res. 2003;31(21):6283–6289. doi: 10.1093/nar/gkg838. [DOI] [PMC free article] [PubMed] [Google Scholar]
- 7.Hartwell L.H., et al. From molecular to modular cell biology. Nature. 1999;402:C47–C52. doi: 10.1038/35011540. [DOI] [PubMed] [Google Scholar]
- 8.Hwang W., Cho Y-R., Zhang A., Ramanathan M. A novel functional module detection algorithm for protein-protein interaction networks. Algorithms Mol. Biol. 2006;1(1):24. doi: 10.1186/1748-7188-1-24. [DOI] [PMC free article] [PubMed] [Google Scholar]
- 9.Sung C-H., Leroux M.R. The roles of evolutionarily conserved functional modules in cilia-related trafficking. Nat. Cell Biol. 2013;15(12):1387–1397. doi: 10.1038/ncb2888. [DOI] [PMC free article] [PubMed] [Google Scholar]
- 10.Mendoza E. Encyclopedia of Systems Biology. Springer; 2013. Organelle and Functional Module Resources. pp. 1609–1611. [Google Scholar]
- 11.Gillham N.W. Organelle genes and genomes. Oxford University Press; 1994. [Google Scholar]
- 12.Amar D., Shamir R. Constructing module maps for integrated analysis of heterogeneous biological networks. Nucleic Acids Res. 2014;42(7):4208–4219. doi: 10.1093/nar/gku102. [DOI] [PMC free article] [PubMed] [Google Scholar]
- 13.Agrawal G.K., Bourguignon J., Rolland N., Ephritikhine G., Ferro M., Jaquinod M., Alexiou K.G., Chardot T., Chakraborty N., Jolivet P. Plant organelle proteomics: collaborating for optimal cell function. Mass Spectrom. Rev. 2011;30(5):772–853. doi: 10.1002/mas.20301. [DOI] [PubMed] [Google Scholar]
- 14.Kaura N., Crossc L., Theodouloue F.L., Bakerd A., Hua J. Plant Peroxisomes: Protein Import, Dynamics, and Metabolite Transport. Cell Biol. (Henderson NV) 2014;10(1):1–25. [Google Scholar]
- 15.Wang G., Yang E., Mandhan I., Brinkmeyer-Langford C.L., Cai J.J. Population-level expression variability of mitochondrial DNA-encoded genes in humans. Eur. J. Hum. Genet. 2014;22(9):1093–1099. doi: 10.1038/ejhg.2013.293. [DOI] [PMC free article] [PubMed] [Google Scholar]
- 16.Zeller G., Henz S.R., Widmer C.K., Sachsenberg T., Ratsch G., Weigel D., Laubinger S. Stress-induced changes in the Arabidopsis thaliana transcriptome analyzed using whole-genome tiling arrays. Plant J. 2009;58(6):1068–1082. doi: 10.1111/j.1365-313X.2009.03835.x. [DOI] [PubMed] [Google Scholar]
- 17.Tang X., Wang J., Liu B., Li M., Chen G., Pan Y. A comparison of the functional modules identified from time course and static PPI network data. BMC Bioinformatics. 2011;12(1):339. doi: 10.1186/1471-2105-12-339. [DOI] [PMC free article] [PubMed] [Google Scholar]
- 18.Ideker T., Ozier O., Schwikowski B., Siegel A.F. Discovering regulatory and signalling circuits in molecular interaction networks. Bioinformatics. 2002;18(Suppl. 1):S233–S240. doi: 10.1093/bioinformatics/18.suppl_1.s233. [DOI] [PubMed] [Google Scholar]
- 19.Nacu Ş., Critchley-Thorne R., Lee P., Holmes S. Gene expression network analysis and applications to immunology. Bioinformatics. 2007;23(7):850–858. doi: 10.1093/bioinformatics/btm019. [DOI] [PubMed] [Google Scholar]
- 20.Rajagopalan D., Agarwal P. Inferring pathways from gene lists using a literature-derived network of biological relationships. Bioinformatics. 2005;21(6):788–793. doi: 10.1093/bioinformatics/bti069. [DOI] [PubMed] [Google Scholar]
- 21.Shih Y-K., Parthasarathy S. Identifying functional modules in interaction networks through overlapping Markov clustering. Bioinformatics. 2012;28(18):i473–i479. doi: 10.1093/bioinformatics/bts370. [DOI] [PMC free article] [PubMed] [Google Scholar]
- 22.Davidson G.S., Wylie B.N., Boyack K.W. Cluster stability and the use of noise in interpretation of clustering.; in Information Visualization, IEEE Symposium on.; 2001. [Google Scholar]
- 23.Carter S.L., Brechbühler C.M., Griffin M., Bond A.T. Gene co-expression network topology provides a framework for molecular characterization of cellular state. Bioinformatics. 2004;20(14):2242–2250. doi: 10.1093/bioinformatics/bth234. [DOI] [PubMed] [Google Scholar]
- 24.Butte A.J., Kohane I.S. Mutual information relevance networks: functional genomic clustering using pairwise entropy measurements. Pac. Symp. Biocomput; 2000. [DOI] [PubMed] [Google Scholar]
- 25.Miklos G.L., Maleszka R. Microarray reality checks in the context of a complex disease. Nat. Biotechnol. 2004;22(5):615–621. doi: 10.1038/nbt965. [DOI] [PubMed] [Google Scholar]
- 26.Carvunis A-R., Ideker T. Siri of the cell: what biology could learn from the iPhone. Cell. 2014;157(3):534–538. doi: 10.1016/j.cell.2014.03.009. [DOI] [PMC free article] [PubMed] [Google Scholar]
- 27.Natu M., Sadaphal V., Patil S., Mehrotra A. Distributed Computing and Networking. Springer; 2011. Mining frequent subgraphs to extract communication patterns in data-centres. pp. 239–250. [Google Scholar]
- 28.Eagle N., Pentland A.S., Lazer D. Inferring friendship network structure by using mobile phone data. Proc. Natl. Acad. Sci. USA. 2009;106(36):15274–15278. doi: 10.1073/pnas.0900282106. [DOI] [PMC free article] [PubMed] [Google Scholar]
- 29.Khan K., Arino J., Hu W., Raposo P., Sears J., Calderon F., Heidebrecht C., Macdonald M., Liauw J., Chan A. Spread of a novel influenza A (H1N1) virus via global airline transportation. N. Engl. J. Med. 2009;361(2):212–214. doi: 10.1056/NEJMc0904559. [DOI] [PubMed] [Google Scholar]
- 30.Brandes U. On variants of shortest-path betweenness centrality and their generic computation. Soc. Networks. 2008;30(2):136–145. [Google Scholar]
- 31.Consortium G.O., Gene Ontology Consortium going forward. Nucleic Acids Res. 2015;43(D1):D1049–D1056. doi: 10.1093/nar/gku1179. [DOI] [PMC free article] [PubMed] [Google Scholar]
- 32.Boyle E.I., Weng S., Gollub J., Jin H., Botstein D., Cherry J.M., Sherlock G. GO: TermFinder—open source software for accessing Gene Ontology information and finding significantly enriched Gene Ontology terms associated with a list of genes. Bioinformatics. 2004;20(18):3710–3715. doi: 10.1093/bioinformatics/bth456. [DOI] [PMC free article] [PubMed] [Google Scholar]
- 33.Barabasi A-L., Oltvai Z.N. Network biology: understanding the cell's functional organization. Nat. Rev. Genet. 2004;5(2):101–113. doi: 10.1038/nrg1272. [DOI] [PubMed] [Google Scholar]
- 34.D’haeseleer P., Liang S., Somogyi R. Genetic network inference: from co-expression clustering to reverse engineering. Bioinformatics. 2000;16(8):707–726. doi: 10.1093/bioinformatics/16.8.707. [DOI] [PubMed] [Google Scholar]
- 35.van Noort V., Snel B., Huynen M.A. Predicting gene function by conserved co-expression. Trends Genet. 2003;19(5):238–242. doi: 10.1016/S0168-9525(03)00056-8. [DOI] [PubMed] [Google Scholar]
- 36.Hansen E.A. Breadth-first heuristic search. Artif. Intell. 2006;170(4/5):385–408. [Google Scholar]
- 37.Peng J., Li H., Jiang Q., Wang Y., Chen J. An integrative approach for measuring semantic similarities using gene ontology. BMC Syst. Biol. 2014;8(Suppl. 5):S8. doi: 10.1186/1752-0509-8-S5-S8. [DOI] [PMC free article] [PubMed] [Google Scholar]
- 38.Peng J., Wang T., Wang J., Wang Y., Chen J. Extending gene ontology with gene association networks. Bioinformatics. 2016;32(8):1185–1194. doi: 10.1093/bioinformatics/btv712. [DOI] [PubMed] [Google Scholar]
- 39.Peng J., Uygun S., Kim T., Wang Y., Rhee S.Y., Chen J. Measuring semantic similarities by combining gene ontology annotations and gene co-function networks. BMC Bioinformatics. 2015;16(1):44. doi: 10.1186/s12859-015-0474-7. [DOI] [PMC free article] [PubMed] [Google Scholar]
- 40.Schrijver A. On the history of the transportation and maximum flow problems. Math. Program. 2002;91(3):437–445. [Google Scholar]
- 41.Hao J.X., Orlin J.B. A Faster Algorithm for Finding the Minimum Cut in a Directed Graph. J. Algorithms. 1994;17(3):424–446. [Google Scholar]
- 42.Cherkassky B.V., Goldberg A.V., Radzik T. Shortest paths algorithms: Theory and experimental evaluation. Math. Program. 1996;73(2):129–174. [Google Scholar]
- 43.Wettenhall J.M., Smyth G.K. limmaGUI: a graphical user interface for linear modeling of microarray data. Bioinformatics. 2004;20(18):3705–3706. doi: 10.1093/bioinformatics/bth449. [DOI] [PubMed] [Google Scholar]
- 44.Shannon P., Markiel A., Ozier O., Baliga N.S., Wang J.T., Ramage D., Amin N., Schwikowski B., Ideker T. Cytoscape: a software environment for integrated models of biomolecular interaction networks. Genome Res. 2003;13(11):2498–2504. doi: 10.1101/gr.1239303. [DOI] [PMC free article] [PubMed] [Google Scholar]
- 45.Wiwatwattana N., Kumar A., Organelle D.B. a cross-species database of protein localization and function. Nucleic Acids Res. 2005;33(Suppl. 1):D598–D604. doi: 10.1093/nar/gki071. [DOI] [PMC free article] [PubMed] [Google Scholar]
- 46.Moreno A.A., Mukhtar M.S., Blanco F., Boatwright J.L., Moreno I., Jordan M.R., Chen Y., Brandizzi F., Dong X., Orellana A. IRE1/bZIP60-mediated unfolded protein response plays distinct roles in plant immunity and abiotic stress responses. PLoS One. 2012;7(2):e31944. doi: 10.1371/journal.pone.0031944. [DOI] [PMC free article] [PubMed] [Google Scholar]
- 47.Iwata Y., Koizumi N. Plant transducers of the endoplasmic reticulum unfolded protein response. Trends Plant Sci. 2012;17(12):720–727. doi: 10.1016/j.tplants.2012.06.014. [DOI] [PubMed] [Google Scholar]
- 48.Khurana J.P., Kochhar A., Tyagi A.K. Photosensory perception and signal transduction in higher plants—molecular genetic analysis. Crit. Rev. Plant Sci. 1998;17(5):465–539. [Google Scholar]
- 49.Gómez-Mena C., de Folter S., Costa M.M., Angenent G.C., Sablowski R. Transcriptional program controlled by the floral homeotic gene AGAMOUS during early organogenesis. Development. 2005;132(3):429–438. doi: 10.1242/dev.01600. [DOI] [PubMed] [Google Scholar]
Associated Data
This section collects any data citations, data availability statements, or supplementary materials included in this article.
Supplementary Materials
Supplementary material is available on the publisher’s web site along with the published article.


