

Abstract
The relative contributions of glycolysis and oxidative phosphorylation to neuronal presynaptic energy demands are unclear. In rat hippocampal neurons, ATP production by either glycolysis or oxidative phosphorylation alone sustained basal evoked synaptic transmission for up to 20 min. However, combined inhibition of both ATP sources abolished evoked transmission. Neither action potential propagation failure nor depressed Ca2+ influx explained loss of evoked synaptic transmission. Rather, inhibition of ATP synthesis caused massive spontaneous vesicle exocytosis, followed by arrested endocytosis, accounting for the disappearance of evoked postsynaptic currents. In contrast to its weak effects on basal transmission, inhibition of oxidative phosphorylation alone depressed recovery from vesicle depletion. Local astrocytic lactate shuttling was not required. Instead, either ambient monocarboxylates or neuronal glycolysis was sufficient to supply requisite substrate. In summary, basal transmission can be sustained by glycolysis, but strong presynaptic demands are met preferentially by oxidative phosphorylation, which can be maintained by bulk but not local monocarboxylates or by neuronal glycolysis.
SIGNIFICANCE STATEMENT Neuronal energy levels are critical for proper CNS function, but the relative roles for the two main sources of ATP production, glycolysis and oxidative phosphorylation, in fueling presynaptic function in unclear. Either glycolysis or oxidative phosphorylation can fuel low-frequency synaptic function and inhibiting both underlies loss of synaptic transmission via massive vesicle release and subsequent failure to endocytose lost vesicles. Oxidative phosphorylation, fueled by either glycolysis or endogenously released monocarboxylates, can fuel more metabolically demanding tasks such as vesicle recovery after depletion. Our work demonstrates the flexible nature of fueling presynaptic function to maintain synaptic function.
Keywords: astrocyte, glutamate, glycolysis, neuroenergetics, presynaptic
Introduction
Neurons are energetically demanding cells, requiring a staggering amount of ATP to maintain ion gradients during signaling and to power presynaptic vesicle cycling and filling. Although postsynaptic function is especially demanding (Attwell and Laughlin, 2001; Harris et al., 2012), the energetic cost of presynaptic function has been highlighted recently (Rangaraju et al., 2014; Pathak et al., 2015; Jang et al., 2016; Lujan et al., 2016). With >20,000 presynaptic ATP molecules consumed per glutamate vesicle (Attwell and Laughlin, 2001; Harris et al., 2012), not including the ATP used for the restoration of presynaptic sodium and potassium gradients, the estimated 1 × 10⁶ molecules of ATP at the presynaptic terminal would be exhausted rapidly without resupply (Rangaraju et al., 2014).
Glucose is the predominant source of ATP in the CNS. After crossing the blood–brain barrier, glucose is used by neurons and astrocytes to produce ATP through glycolysis and oxidative phosphorylation. Glycolysis quickly converts glucose into two molecules of pyruvate and a net total of two ATP. This provides cells with a rapid source of ATP for a short period of time, particularly in the absence of oxygen. Mitochondrial oxidative phosphorylation produces ATP at a slower rate, but has a higher yield (32 ATP vs 2 produced with glycolysis; Pfeiffer et al., 2001). Substrates other than metabolically derived pyruvate can also feed the TCA cycle and oxidative phosphorylation. These include astrocyte-derived lactate (Schurr et al., 1988; Izumi et al., 1997; Gallagher et al., 2009; Ivanov et al., 2011; Wyss et al., 2011), ketone bodies (Edmond et al., 1987; Auestad et al., 1991; Izumi et al., 1998; McKenna, 2012; Takahashi et al., 2014), and glutamate (Hertz et al., 1988; Sonnewald et al., 1996; McKenna, 2007, 2012).
The relative importance of glycolysis and oxidative phosphorylation in fueling presynaptic function remains unclear. Glycolysis may be particularly vital for vesicle endocytosis (Rangaraju et al., 2014), localization of synaptic vesicle machinery to synaptic terminals (Jang et al., 2016), and glutamate accumulation in synaptic vesicles (Ikemoto et al., 2003). Recent evidence also suggests that glycolytic failure quickly alters the presynaptic action potential waveform to depress transmission at the calyx of Held synapse (Lujan et al., 2016). However, other studies have demonstrated a prime effect of oxidative phosphorylation in powering synaptic transmission and information processing (Schurr et al., 1988; Izumi et al., 1997; Ivanov et al., 2011; Wyss et al., 2011; Hall et al., 2012).
Some of the confusion may arise because few of the above studies queried the relative roles of glycolysis and oxidative phosphorylation on presynaptic function directly under controlled conditions that reduce secondary explanations for transmission deficits. In a reduced, controlled environment, we found that, although continuous ATP production is indeed important to sustain transmitter release, ablation of evoked transmission requires tandem inhibition of glycolysis and oxidative phosphorylation. We tracked the loss of transmission to massive vesicle exocytosis, which, in the absence of ATP synthesis, failed to elicit commensurate vesicle endocytosis and recovery. We also found a privileged role for oxidative phosphorylation in fueling recovery of synaptic transmission after rapid-depolarization-induced vesicle depletion even when glycolysis was inhibited, suggesting the availability of alternative substrates for oxidative phosphorylation. Neurons appear to power oxidative phosphorylation with either the glycolytic breakdown of glucose or the utilization of extracellular monocarboxylates, presumably from surrounding astrocytes. However, inhibiting either fuel source alone did not affect recovery. We conclude that evoked transmission exhibits flexibility in ATP sourcing that yields resilience of presynaptic function to changes in metabolic conditions.
Materials and Methods
Hippocampal cell culture.
Cell cultures were produced and maintained as described previously (Mennerick and Zorumski, 1995; Moulder et al., 2007). Briefly, hippocampal (neuron) and cortical (astrocyte) tissue of postnatal day 1–4 Sprague Dawley rat pups of both sexes (85% female) were harvested using protocols approved by the Washington University Animal Studies Committee. The tissue was digested by 1 mg/ml papain and mechanically dispersed. First, astrocytes were plated on collagen microcultures in Eagle's medium (Life Technologies) supplemented with 5% heat-inactivated horse serum, 5% fetal bovine serum, 17 mm d-glucose, 400 μm glutamine, 500 U/ml penicillin, and 50 μg/ml streptomycin and maintained at 37°C in a humidified incubator (5% CO2/95% air) before neuronal plating. Neurons were plated at a low density (∼100 cells/mm−2). Positive and negative astrocyte microcultures were prepared as described previously (Sobieski et al., 2015). Briefly, 25 mm glass coverslips were stamped with a polydimethylsiloxane microstamp coated with 0.5 mg/ml collagen to create 150- to 200-μm-diameter microdots and backfilled with a nonpermissive substrate poly-l-lysine grafted polyethylene glycol [PLL(20 kDa)-g(3.5)-PEG(2 kDa); Surface Solutions] at a concentration of 10 μg/ml in PBS for 1 h and then washed with 1× PBS. Unless otherwise stated, experiments were performed between 9 and 14 d in vitro.
Electrophysiology.
Whole-cell electrophysiological recordings were performed at room temperature on the stage of an Eclipse TE2000-S inverted microscope. Data were collected using with a Multiclamp 700B amplifier and Digidata 1550 data acquisition board (Molecular Devices) using pClamp 10 software. During experiments in which both GABAergic and glutamatergic autaptic PSCs were studied, the intracellular pipette solution consisted of the following (in mm): 140 potassium chloride, 4 NaCl, 10 4-(2-hydroxyethyl)-1-piperazineethanesulfonic acid (HEPES), 5 EGTA, and 0.5 CaCl2. The pH was adjusted to 7.25 with KOH. Experiments designed to examine EPSCs alone used an internal solution containing 140 mm potassium gluconate instead of potassium chloride to isolate glutamate-mediated currents. No exogenous ATP or MgATP was added via the whole-cell pipette solution. Previous work on autaptic hippocampal neurons has demonstrated that at least 10 min of recording time is required for ∼10% of the pipette contents to reach presynaptic terminals (Rosenmund and Stevens, 1996). Therefore, whole-cell recordings obtained shortly after break-in should establish postsynaptic ion gradients rapidly but effectively isolate presynaptic events compromised by preceding metabolic manipulations.
Extracellular solution during voltage-clamp recordings typically consisted of the following (in mm): 138 NaCl, 4 KCl, 10 HEPES, 10 glucose, 2 CaCl2, 1 MgCl2, and 0.01 d-2-amino-5-phosphonovalerate (D-APV; Tocris Bioscience), pH 7.25, adjusted with NaOH. Miniature PSCs and experiments evoking vesicle release directly from synaptic terminals were recorded in saline containing 1 μm TTX. For current-clamp recordings, saline contained NBQX (1 μm) and bicuculline (50 μm). All PSCs were autaptic, recorded from single-neuron microcultures, except for mPSC analysis during metabolic inhibition shown in Figure 3, in which recordings were performed on cells in multineuron microcultures. This was done to ensure that the majority of presynaptic events arose from cells in a metabolic state that was not influenced by the whole-cell recording pipette over the time periods required to monitor mPSCs.
Figure 3.
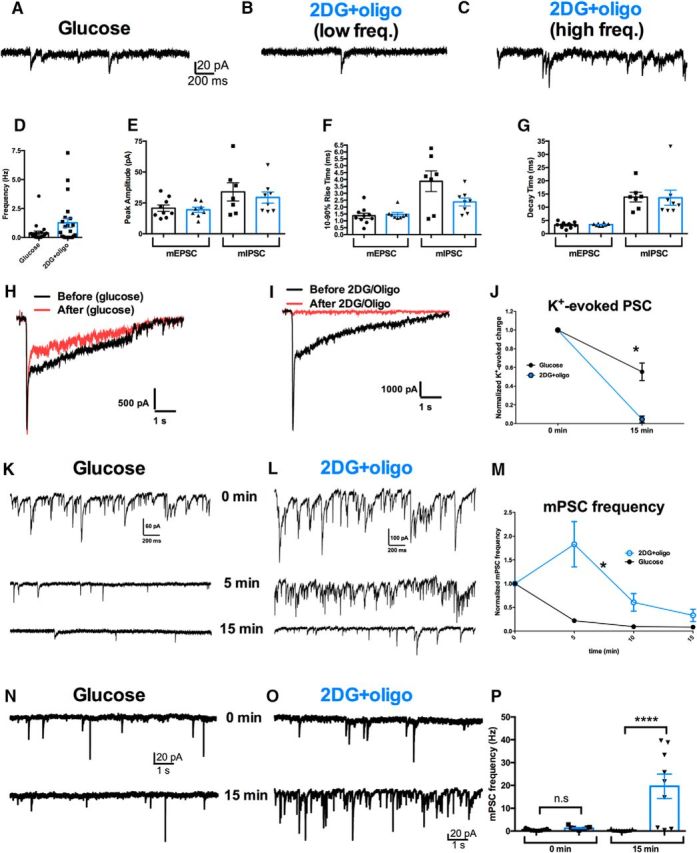
Metabolically compromised neurons exhibit high variance in mPSC frequency and display gradual, massive exocytosis. A–C, Representative traces of the indicated experimental conditions. Drug concentrations are as in Figures 1 and 2. Examples B and C represent different cells in the same condition with different spontaneous mPSC release frequency. D, Summary of pooled mPSC frequency in the two conditions, revealing the higher variance in mPSC frequency in 2DG+oligo (n = 21, 22 neurons in glucose and 2DG+oligo conditions, respectively; p = 0.0002, F test). The difference between conditions was not significantly different (p > 0.05, unpaired, two-tailed Student's t test with Bonferroni corrections). E–G, Summary of mPSC parameters, separated by mEPSCs (n = 9, 7 neurons in glucose and 2DG+oligo conditions, respectively) and mIPSCs (n = 8, 8 neurons in glucose and 2DG+oligo conditions, respectively). No significant differences were found on any of the parameters between glucose and 2DG+oligo (p > 0.05, unpaired, two-tailed Student's t test with Bonferroni corrections). H, I, Representative traces documenting the effect of control (glucose) or 2DG+oligo application on evoked and spontaneous release during recordings from a neuron on a multineuron island. During recordings in TTX, K+ was applied as in Figure 2 to elicit transmitter release from surrounding terminals. Shown are antagonist-subtracted currents at baseline (black) and after 15 min of control or 2DG+oligo application. J, Summary of the change in total antagonist-subtracted (receptor-generated) charge after 15 min of incubation. Some depression in control K+-evoked PSCs (n = 7) was noted. However, 2DG+oligo (n = 6) caused a complete loss of evoked PSC. A repeated-measures ANOVA revealed a significant interaction between treatment condition and time (*p < 0.01). K, L, mPSC recordings from the neurons shown in H and I. The traces document mPSCs at three 30 s epochs after the baseline K+ application, as labeled. Initially (time = 0), mPSC frequency is high in both cells, a residual effect of K+ application. M, Summary of mPSC frequency change from 30 s epochs during incubation in 2DG+oligo. Same 13 cells represented in J. 2DG+oligo elicited a significantly more sustained mPSC frequency than control (*p < 0.005 main effect of treatment and interaction between time and treatment). N–P, The increased mPSC frequency increase was not the result of interaction with K+ stimulation. N, O, Sample records from control and poisoned neurons without preceding K+ stimulation. P, Summary data from multiple cells at early and late time points. A two-way, repeated-measures ANOVA revealed a main effect of poison and a drug by time interaction (p < 0.05). Asterisks indicate Bonferroni corrected post hoc testing. ****p ≤ 0.0001; n.s, not significant. Individual data points represent neurons and bars represent mean ± SEM.
Whole-cell recording pipettes were pulled from borosilicate glass capillary tubes (World Precision Instruments) and had final open-tip resistances of 2–6 MΩ. Unless otherwise stated, neurons in voltage-clamp mode were held at −70 mV. Evoked autaptic PSCs were elicited with a 1.5 ms depolarizing pulse to 0 mV. Data were sampled at 20 kHz and filtered at 10 kHz for PSC recordings. Access resistance was compensated to 90% for evoked autaptic PSC recordings. Miniature PSCs were sampled at 5 kHz and filtered at 1 kHz; access resistance was not compensated. For recording action potentials in current-clamp mode, neurons were biased with small, tonic current injection when necessary to hold the membrane potential near −65 mV. Depolarizing current pulses in increments of 5–10 pA were applied for 1200 ms until a single action potential was elicited. When solution exchange or drug delivery was performed, solutions were dispensed to the target neuron by a gravity-driven local perfusion system from a common tip with an exchange time of ∼100 ms.
Endocytosis measurement.
Fixable FM1–43 (FM1–43FX) dye labeling of vesicle cycling was performed as described previously (Moulder et al., 2010). High-density cell cultures were subjected various metabolic conditions in the presence of 0.5–1 μm TTX and 1 μm NBQX, 25 μm d-APV for 20 min before probing for vesicle cycling with FM1–43FX. The probe was conducted by challenging cells for 2 min with 5 μm FM1–43FX (Thermo Fisher Scientific) in 45 mm KCl to induce vesicle cycling. In the case of labeling in 0 Ca2+ solution, 100 μm EGTA was included to chelate residual Ca2+ during the probe. In other experiments, FM1–43FX was included during the 20 min metabolic challenge. In all cases, noninternalized FM1–43FX fluorescence was removed with a brief application of saline supplemented with 500 μm Advasep-7 (CyDex). Cultures were washed 5 times with saline and then fixed for immunostaining with 4% paraformaldehyde and 0.2% glutaraldehyde in PBS for 10 min at room temperature. Cultures were then washed with PBS followed by a 10 min incubation in 4% NGS and 0.04% Triton in PBS. Primary antibody, antisynapsin I (1:1000) was applied for 3 h at room temperature and washed twice in PBS followed by 30 min incubation in secondary antibody Alexa Fluor 633 conjugate (Thermo Fisher Scientific) and glass coverslipping with Fluoromount G (Southern Biotech).
FM1–43FX and anti-synapsin I images were captured on an inverted Eclipse TE2000-S microscope using a 60× objective with a 1.4 numerical aperture and a C1 scanning confocal laser (488 and 633 nm) with EZ-C1 software (Nikon). Z-stack images were acquired with alternating laser lines while all gain and acquisition settings were held constant within a given experiment. Two-dimensional projected images were created and analyzed using ImageJ software and regions of interest to measure FM1–43FX uptake/intensity were selected blindly using synapsin I-labeled puncta. FM1–43FX fluorescence intensity was background subtracted and puncta with intensity values below background were assigned a value of 0.
Data analysis.
Data were analyzed and plotted using MetaMorph 7, Clampfit 10 (Molecular Devices), MiniAnalysis 6 (Synaptosoft), Excel 2011 (Microsoft), Prism 6 (GraphPad), and ImageJ software. Unless otherwise stated, data in figures and text are given as mean ± SEM. Student's two-tailed unpaired t test was used to compare two groups unless otherwise noted. If more than two parameters were compared between two groups, a Bonferroni correction was applied. One-way ANOVA was used when comparing more than two experimental conditions and two-way ANOVA was used when comparing the effects of at least two parameters over time. To test differences in variance between groups, an F test was conducted. Nonparametric data were analyzed using a Kruskal–Wallis one-way ANOVA followed by Dunn's multiple-comparisons test. Significance was defined as a corrected p-value < 0.05. The reported n refers to the number of neurons in each group within a particular experiment except in imaging experiments, where it refers to the number of presynaptic terminals. In all cases, at least three independent cultures were surveyed, each contributing equally to final n values.
Materials.
D-APV, NBQX, and TTX were from Tocris Biosciences. All materials without identified suppliers above were obtained from Sigma-Aldrich. 2-Deoxy-d-glucose (2DG, 10 mm), oligomycin (oligo; 1 μm), and α-cyano-4-hydroxycinnamic acid (4-CIN, 100 μm) are key pharmacological reagents used herein. 2DG and oligo are commonly used at these concentrations to inhibit glycolysis and oxidative phosphorylation, respectively (Schurr et al., 1999; Rangaraju et al., 2014; Pathak et al., 2015; Lujan et al., 2016; 5–20 min). At concentrations <250 μm, 4-CIN blocks lactate transport into neurons effectively with very few off-target effects (Izumi et al., 1997; Erlichman et al., 2008; Choi et al., 2012; Tang et al., 2014), although, at higher concentrations, it may have off-target effects (Chih et al., 2001). In our studies, an effect of 4-CIN was observed only when 4-CIN was combined with another metabolic manipulation (2DG). This strongly suggests that 4-CIN at the concentration used acted through the intended mechanism.
Results
Acute inhibition of both glycolysis and oxidative phosphorylation is required to interfere with evoked synaptic transmission
We initially tested the effect of acute inhibition of glycolysis and/or oxidative phosphorylation on action potential-evoked synaptic transmission. Incubations in metabolic poisons (2DG to inhibit glycolysis, oligo to inhibit oxidative phosphorylation, or the combination) were performed 15 min before establishing whole-cell, patch-clamp recordings from autaptic hippocampal neurons (Fig. 1A). The whole-cell recording configuration allowed direct control of postsynaptic ion gradients, so presynaptic variables were effectively isolated by metabolic manipulations (see Materials and Methods). Evoked PSCs were recorded immediately after break-in and were typically measured for ∼5 min at a 0.04 Hz stimulation frequency. Inhibiting either glycolysis with 2DG (Fig. 1B) or oxidative phosphorylation with an ATP synthase inhibitor, oligo (Fig. 1C), had no significant effect on the ability to evoke PSCs in hippocampal neurons (Fig. 1E). We observed no difference in effects on glutamate- (n = 10 cells, 2DG; n = 7 cells, oligo) and GABA-mediated (n = 6 cells, 2DG; n = 10 cells, oligo) PSCs, so results were pooled. Average evoked PSC amplitude was variable but did not differ among the control (6.0 ± 0.7 nA, n = 19), oligo (4.3 ± 1.3 nA, n = 20), and 2DG conditions (6.8 ± 3.6 nA, n = 17). However, combined oligo and 2DG (2DG+oligo) treatment significantly suppressed PSC amplitude (0.15 ± 0.02 nA, n = 16), in most cases completely suppressing evoked PSCs (Fig. 1D,E). PSCs were not altered further during whole-cell recordings (5 min duration) in metabolic inhibitors; there was no time-dependent decrement in PSCs with continued treatment with 2DG or oligo alone (Fig. 1F) and PSCs did not emerge during recording in the continued combined presence of 2DG+oligo.
Figure 1.

Acute inhibition of glycolysis and oxidative phosphorylation impairs evoked vesicle release. A–D, Representative evoked autaptic EPSCs elicited in each of the indicated conditions after 15 min of preincubation in the conditions before establishing the whole-cell recording. “2DG” designates substitution of 2DG (10 mm) for glucose. Oligo was applied at 1 μm. The dashed boxes indicate presynaptic stimulation currents, including an inward sodium current highlighted in G. E, Neurons exhibiting PSCs or no detectable PSC, from the four conditions, color-coded according to the text labels in A–D (n = 16–20 neurons per condition). 2DG+oligo exhibited significantly more neurons lacking evoked PSCs than control glucose (χ2 = 30.35, p < 0.0001). F, Summary of evoked PSCs obtained after 5 min of stimulation (0.04 Hz) normalized to initial currents obtained on membrane break-in. There was no significant difference in PSC peak size of glucose, 2DG, or oligo alone after 5 min of recording compared with immediate break-in (p > 0.05 for all conditions; two-way repeated-measures ANOVA with Bonferroni corrections performed on raw data). No PSCs were evident at time 0 or 5 min after break-in in the 2DG+oligo condition, hence the lack of a bar. G, Representative sodium currents measured immediately on break-in in the four experimental conditions taken from the time period indicated by the dashed boxes in A–D. Colors correspond to the text labels in A–D. H, Summary of sodium current obtained immediately after break-in and after 5 min of stimulation normalized to 0 min sodium current in glucose. At 0 min, the oligo and 2DG+oligo conditions were significantly smaller than glucose controls (p < 0.01, 0.0001 for oligo and 2DG+oligo, respectively; two-way repeated-measures ANOVA with Bonferroni corrections performed on raw data) At 5 min, there was no significant difference between glucose and the three remaining conditions (p > 0.05 for all conditions, two-way repeated-measures ANOVA with Bonferroni corrections performed on raw data). Data are represented as mean ± SEM. **p ≤ 0.01; ***p ≤ 0.001; n.s, nonsignificant. I, Action potential waveform changes resulting from oligo-only treatment. Current-clamp recordings were established after incubations as above and a family of depolarizing currents (5–10 pA increment, 1200 ms) was injected to elicit a just-suprathreshold action potential. Peak and maximum rate of rise were measured in 27 control neurons and 25 oligo-treated neurons. The inset shows an exemplar action potential from one cell in each condition superimposed.
Interestingly, inhibition of oxidative phosphorylation alone or in the presence of 2DG was initially associated with suppressed axosomatic voltage-gated sodium currents (Fig. 1G,H), which drive presynaptic action potentials (Bekkers and Stevens, 1991; Prakriya and Mennerick, 2000). This is in contrast to recent results at the calyx of Held, where axonal action potentials were particularly sensitive to glycolytic inhibition (Lujan et al., 2016). In our experiments, the sodium currents in both oligo treatment groups grew over time and were not significantly different from the glucose control group by 5 min recording time despite the lack of ATP in the pipette solution (Fig. 1H). We posit that the growth of sodium currents likely reflects the reestablishment of K+ and Na+ gradients during cell dialysis with the patch pipette solution. We conclude that oxidative phosphorylation is most important for maintaining these ion gradients and that glycolysis alone is not sufficient.
To further characterize the effect of oligo on excitability, we examined somatic action potentials in current-clamp recordings using just-suprathreshold current injection titrated for each cell. In this independent sample of neurons, both maximum rise rate and peak amplitude of action potentials were depressed after 15 min of oligo incubation compared with sibling control cells (Fig. 1I). Despite initial suppression of sodium currents in both oligo-treated groups (Fig. 1H) and the effects of oligo on action potential waveform (Fig. 1I), transmission failure occurred only in neurons in which both glycolysis and oxidative phosphorylation were inhibited (Fig. 1E). PSCs in this condition did not recover despite the recovery of sodium current (Fig. 1H). These observations suggest indirectly that the disruption of sodium current alone is unlikely to account for the depressed transmission when both glycolysis and oxidative phosphorylation are inhibited.
Inhibition of glycolysis and oxidative phosphorylation abolishes evoked vesicle release.
To test more directly whether action potential propagation deficits solely underlie suppressed evoked PSCs, we challenged 2DG+oligo-treated cells with 100 mm K+ (substituted for Na+) in the presence of TTX (0.5–1 μm) immediately after the 15 min incubation in saline with metabolic inhibitors or glucose control. This evoked vesicle exocytosis occurs through direct depolarization of terminals in the absence of action potential firing (Prakriya and Mennerick, 2000). Direct depolarization of unclamped presynaptic terminals elicited antagonist-sensitive PSCs in control neurons (Fig. 2A), but not in 2DG+oligo-treated cells (Fig. 2B). Metabolically poisoned neurons lost both the antagonist-sensitive peak (synchronous) release and sustained release (Fig. 2C,D).
Figure 2.
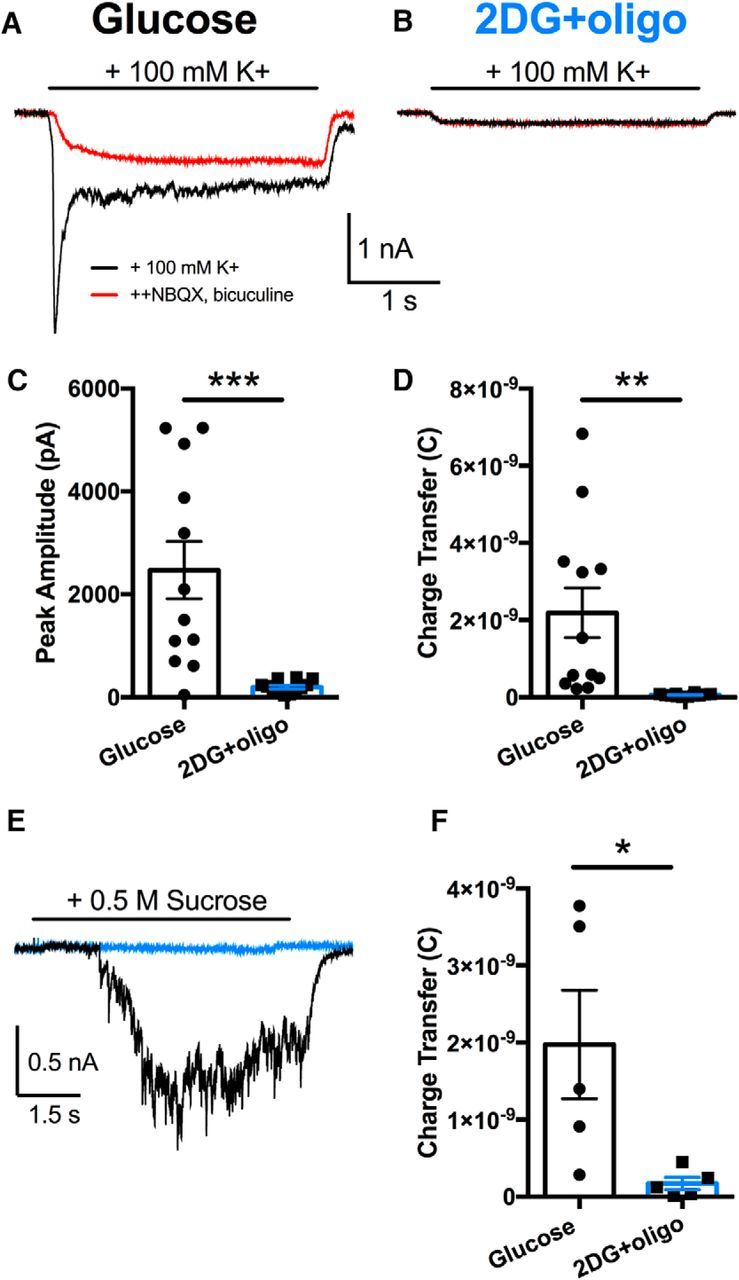
Presynaptic vesicle release is also impaired when action potentials and calcium influx are bypassed. A, B, Representative autaptic currents evoked by 100 mm K+ for 3 s, as indicated by the horizontal bar. Red traces indicate the same treatment, but in the presence of a mixture of postsynaptic receptor blockers (1 μm NBQX, 50 μm bicuculline), revealing nonsynaptic currents elicited by K+. C, D, Summary of antagonist-sensitive peak PSC amplitude and total charge transfer for the two conditions (n = 12,12; p < 0.001, 0.01, respectively, unpaired, two-tailed Student's t test with Bonferroni corrections) measured from the antagonist-subtracted currents. E, Representative traces of hypertonic sucrose (0.5 m) used to elicit exocytosis of releasable vesicles from neurons in the glucose control (black trace) and 2DG+oligo-treated (blue trace) neurons. F, Summary of sucrose-elicited charge transfer from glucose-treated (n = 5 neurons) and 2DG+oligo-treated (n = 5 neurons) cells (p < 0.05, unpaired, two-tailed Student's t test). Individual data points represent single neurons, bars represent mean ± SEM. *p ≤ 0.05; **p ≤ 0.01; ***p ≤ 0.001.
Both action potentials and hyperkalemia require Ca2+ influx for exocytosis. Depression of presynaptic Ca2+ influx after ATP loss could explain PSC loss. To by-pass Ca2+ influx, we used hypertonic sucrose, a Ca2+-independent secretagogue (Rosenmund and Stevens, 1996). Sucrose (0.5 m) elicited antagonist-sensitive PSCs from control neurons (Fig. 2E,F, black trace), but not from 2DG+oligo-treated cells (Fig. 2E,F, blue trace). The loss of evoked release when action potentials and Ca2+ influx are circumvented strongly suggests that neither action potential propagation nor Ca2+ influx is the primary dysfunction underlying the loss of evoked PSCs after combined inhibition glycolysis and oxidative phosphorylation. This outcome suggests that releasable synaptic vesicles may be unavailable after metabolic inhibition.
Metabolic poisoning fosters massive spontaneous vesicle release
Although K+- and sucrose-evoked vesicle release was completely abolished, we were surprised that spontaneous miniature PSCs (mPSCs) were still present in 2DG+oligo-treated cells (Fig. 3B,C) and were comparable to mPSCs in controls (Fig. 3A). We found no significant difference in the mean frequency (Fig. 3D), amplitude (Fig. 3E), 10–90% rise time (Fig. 3F), or decay time (Fig. 3G) between control and 2DG+oligo-treated excitatory mPSCs (mEPSCs) and inhibitory mPSCs (mIPSCs). These data suggest the presence of synaptic vesicles in the terminals, at least initially, despite the inability to evoke release. On closer inspection of mPSCs, we realized that metabolically compromised cells exhibited significantly greater variance in mPSC frequency than control cells (Fig. 3D; F = 6.052, p < 0.0002). We reasoned that loss of ATP production may initiate vesicle release and the large variance in release frequency may correspond to different stages of metabolic poisoning in different neurons.
We hypothesized that loss of presynaptic ATP induces massive spontaneous vesicle exocytosis, which may contribute to the loss of evoked vesicle release. Therefore, neurons may experience increased mPSC frequency throughout incubation in the metabolic poisons as presynaptic ATP levels are diminished; after 15 min of incubation, 2DG+oligo neurons with a high mPSC frequency were still exocytosing, whereas cells with low mPSC frequency had exhausted the ability to exocytose. Any exocytosis would be independent of action potentials because TTX was present during incubation of 2DG+oligo.
We tested directly whether loss of ATP affects vesicle fusion by recording neurons throughout the 15 min incubation period in 2DG+oligo (Fig. 3H–M) instead of after the incubation period (Fig. 3A–G). The protocol allowed us to observe changes in mPSC frequency and evoked transmission within individual cells during metabolic inhibition. We first evoked release in the presence of TTX with K+ application as shown in Figure 2, A–D (Fig. 3H,I, black traces) and then measured mPSC frequency in the presence of either glucose control or metabolic inhibitors over the course of 15 min. After 15 min of glucose (control) or 2DG+oligo treatment, we reassessed evoked PSCs. PSCs were mildly depressed in control cells, but were abolished after 2DG+oligo treatment (Fig. 3H–J). In the same cells, mPSC frequency was initially high after the initial K+ challenge, reflecting residual presynaptic Ca2+ (Fig. 3K,L). In control neurons, mPSC frequency subsided immediately, but in 2DG+oligo cells, the mPSC frequency remained elevated before decreasing to near control levels by 15 min (Fig. 3K–M).
In a separate experiment, mPSC frequency was quantified over the 15 min incubation in either 2DG+oligo or glucose controls without the accompanying K+-evoked PSC challenge. We once again observed a significant increase in mPSC frequency in the presence of 2DG+oligo compared with glucose controls (Fig. 3N–P). Therefore, the large initial mPSC frequency elicited by K+ shown in Figure 3, H–M, was not necessary to initiate the sustained elevation of mPSC frequency in metabolically poisoned cells. These observations suggest that tandem inhibition of glycolysis and oxidative phosphorylation produces massive synaptic exocytosis. Although some degree of spontaneous release still persists after 15 min of poisoning, evoked release is nearly abolished.
Endocytic failure after metabolic poisoning
Because vesicles are recycled, mass exocytosis alone would not account for the loss of evoked vesicle release after incubation in 2DG+oligo. Recent work has shown that ATP levels also influence vesicle endocytosis, with glycolysis playing a particularly important role (Rangaraju et al., 2014; Pathak et al., 2015; Jang et al., 2016). To test whether endocytosis was arrested in metabolically poisoned neurons, we measured vesicle cycling with FM1–43FX to label vesicle internalization at presynaptic terminals, identified with synapsin I (Fig. 4A). Cultures were incubated for 20 min in the indicated conditions. After incubation, vesicle cycling was probed by adding FM1–43FX and 45 mm K+ for 2 min. Neither 2DG (Fig. 4C,G, burgundy bar) nor oligo (Fig. 4D,G, teal bar) altered vesicle cycling, but coadministration of 2DG+oligo reduced vesicle cycling significantly during the probe period (Fig. 4E,G, blue bar).
Figure 4.
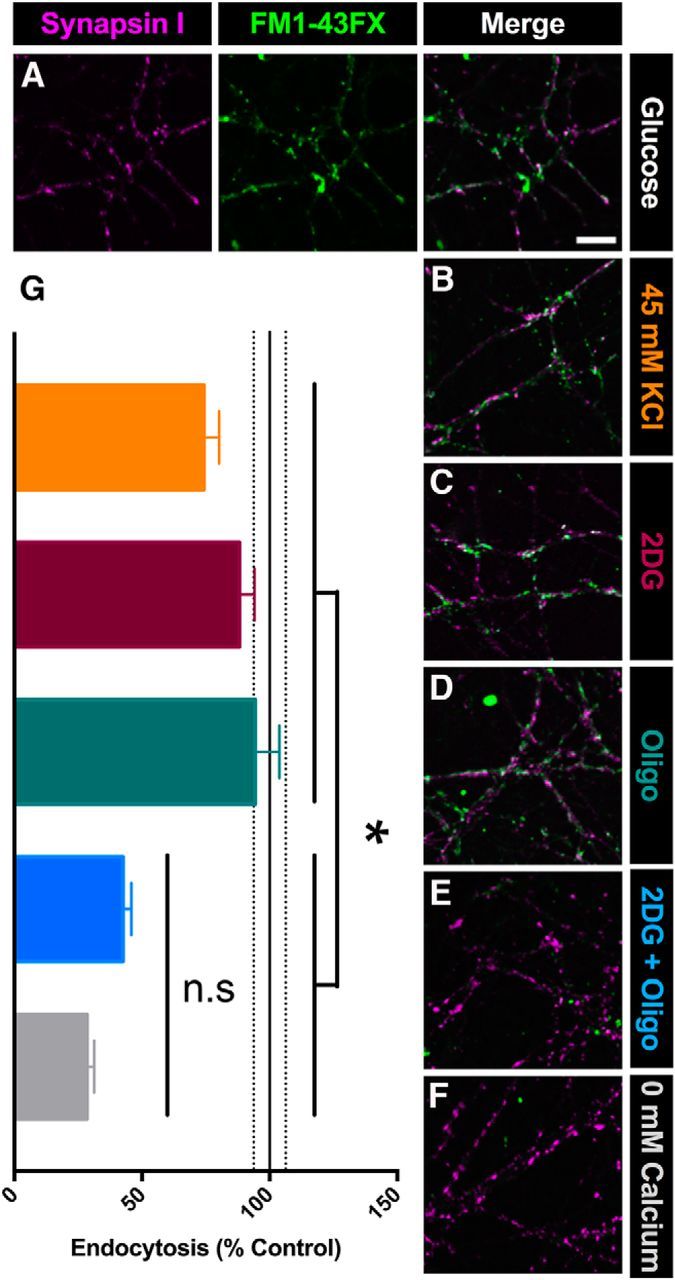
Synaptic vesicle cycling is impaired after combined inhibition of glycolysis and oxidative phosphorylation. A, Representative images of presynaptic terminals immunopositive for synapsin I (left, magenta) after induced vesicle cycling in the presence of FM1–43FX (center, green) and merged (right, white), showing the internalization of FM1–43FX during vesicle endocytosis in the presence of glucose. B–F, Example merged images after 20 min of preincubation in solution containing 45 mm KCl (B), 2DG (C), oligo (D), 2DG+oligo (E), or 0 mm Ca2+ (F). G, Summary of cycling (A; n = 150 presynaptic terminals for each condition from three replications). Scale bar, 10 μm. *p < 0.05 for all the comparisons between each of the 45 mm KCl, 2DG, and oligo conditions and either the 2DG+oligo or 0 mm Ca2+ condition (45 mm KCl vs 2DG + oligo, p = 0.0127; 2DG vs 2DG+oligo, p < 0.0001; oligo vs 2DG + oligo, p = 0.0026; 45 mm KCl vs 0 mm Ca2+, p < 0.0001; 2DG vs 0 mm Ca2+, p < 0.0001; oligo vs 0 mm Ca2+, p < 0.001). The 2DG+oligo condition was not significantly different from the 0 mm Ca2+ condition (NS, p = 0.0746, Kruskal–Wallis one-way ANOVA followed by Dunn's multiple-comparisons test). Data are represented as mean ± SEM. *p ≤ 0.05; n.s, nonsignificant.
To confirm that diminished cycling resulted from metabolic poisoning and not from prolonged vesicle exocytosis, we simulated the extended exocytosis observed in 2DG+oligo-treated cells using 45 mm K+ (substituted for Na+) present for 20 min with TTX but without any metabolic inhibition. Exposure to 45 mm K+ produced a similar steady-state mPSC frequency compared with 2DG+oligo treatment (25.74 ± 11.72 Hz, n = 5 K+-challenged cells), but vesicle cycling during a subsequent 2 min probe in FM1–43FX was not affected significantly (Fig. 4B,G, orange bar). Finally, we measured FM1–43FX labeling in a control group lacking Ca2+ in the probe condition to diminish vesicle cycling during FM1–43FX loading. Cycling was reduced significantly (Fig. 4F,G, gray bar), comparable to when neurons were metabolically poisoned. This control condition also confirms the synaptic nature of labeling.
Experiments shown in Figure 4 confirm that vesicle cycling, rather than vesicle filling or other potential explanations, is associated with the loss of evoked transmission during combined 2DG+oligo treatment. However, the experiments do not determine specifically whether arrested endocytosis contributes. To test this, we incubated cells in FM1–43FX throughout the entire 20 min period of poisoning, during which massive exocytosis occurs (Fig. 3M). As a control, we again depolarized cells in the presence of TTX to produce a comparably stimulated rate of exocytosis, but without metabolic inhibition. The net FM1–43FX labeling during the 20 min incubation in 2DG+oligo (Fig. 5A,B, blue bar) was no different from control (Fig. 5A,B, black bar), whereas K+ stimulation produced the FM1–43FX labeling expected of ongoing vesicle cycling (Fig. 5A,B, orange bar). The lack of staining in the unstimulated control (Fig. 5A, left, B, black bar) presumably reflects the low rate of mPSCs per synapse in the 15 min incubation. Overall, the results demonstrate that the massive exocytosis during metabolic inhibition is not followed by compensatory endocytosis. Therefore, arrested endocytosis likely explains the loss of evoked vesicle release. The results demonstrate an important role for continuous ATP production, flexibly driven by either glycolysis or oxidative phosphorylation, in synaptic vesicle cycling.
Figure 5.

Endocytosis is inhibited during metabolic arrest despite continued exocytosis. FM1–43FX incubation occurred during 20 min of glucose (control), sustained depolarization, or 2DG+oligo. A, Representative images show merged fluorescence of synapsin labeling (magenta) and FM1–43 uptake (green). Scale bar, 10 μm. B, Summary of 150 terminals from three independent experiments reveals that, although continued cycling is evident with sustained depolarization, FM1–43 uptake is lost during metabolic arrest despite strong, prolonged exocytosis evident in Figure 3. ***p < 0.001.
Oxidative phosphorylation powers recovery after intense presynaptic transmission.
Although either glycolysis or oxidative phosphorylation proved capable of sustaining basal transmission (Fig. 1), we wondered whether a more energetically demanding stimulus would reveal a privileged role for presynaptic glycolysis or oxidative phosphorylation. We examined the recovery of EPSCs after a brief, strong depolarization designed to empty all recycling vesicles (Sara et al., 2002; Chung et al., 2010). Glutamate synaptic signaling and uptake may be more energetically demanding than GABA signaling (Waldvogel et al., 2000; Chatton et al., 2003), so we focused on EPSCs. As schematized in Figure 6A, we measured baseline evoked EPSCs, applied 90 mm K+ for 30 s to deplete the vesicle pool, and then measured the recovery of EPSCs with action potential stimulation every 25 s for ∼2 min.
Figure 6.
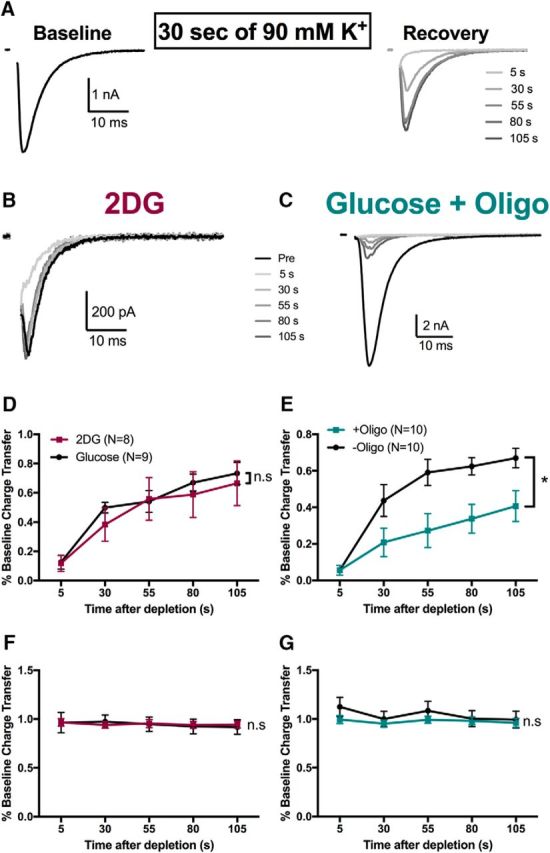
Oxidative phosphorylation plays a privileged role in recovery from intense presynaptic activity. A, Schematic and representative data showing autaptic EPSCs evoked by action potentials in normal glucose solution before (left) and after (right) vesicle depletion with strong, sustained depolarization with 90 mm K+ for 30 s. Stimulus action currents in this figure and subsequent figures are blanked for clarity. B, C, Representative recovery traces from 2DG (B) and oligo-alone (C) treatments showing poor recovery from vesicle depletion in the oligo alone condition. D, E, Summary of recovery of action-potential-evoked EPSCs after the depletion protocol for 2DG compared with glucose control (D, p > 0.05, two-way ANOVA) and glucose saline in the presence (+oligo) or absence (-oligo) of 1 μm oligomycin (E, p < 0.05 two-way ANOVA). F, G, Summary of axosomatic sodium currents after the depletion protocol for 2DG compared with glucose control (F, p > 0.05, two-way ANOVA) and glucose saline in the presence or absence of oligomycin (G, p > 0.05, two-way ANOVA). Data are represented as mean ± SEM. *p ≤ 0.05; n.s, nonsignificant.
2DG incubation did not affect EPSC recovery significantly after vesicle depletion compared with glucose-incubated controls (Fig. 6B,D). However, oligo alone diminished recovery significantly (Fig. 6C,E). Slower recovery did not result from action potential deficits because sodium action currents remained at prechallenge levels for both oligo-treated cells and control cells (Fig. 6G). These data suggest that glycolysis alone cannot adequately sustain presynaptic recovery after a high-demand stimulus. Rather, oxidative phosphorylation, perhaps because of its larger ATP yield, has a privileged role in fueling recovery of presynaptic function after vesicle depletion. Further, the lack of a 2DG effect implies that on-demand glycolysis is not necessary to supply pyruvate for oxidative phosphorylation during the challenge. This suggests that neurons power presynaptic function with reserve or alternative substrates for oxidative phosphorylation when glycolysis is inhibited.
Endogenous monocarboxylate powers oxidative phosphorylation when glycolysis is inhibited
Attractive candidates for alternative metabolic substrates during glycolytic inhibition include monocarboxylates, such as lactate (Schurr et al., 1988; Izumi et al., 1997; Ivanov et al., 2011; Wyss et al., 2011). Extracellular recording solutions do not contain exogenous monocarboxylates, so, based on prevailing views, lactate would be shuttled on demand from astrocytes to neurons during increased glutamate signaling (e.g., after vesicle depletion) to supply the TCA cycle with pyruvate (Pellerin and Magistretti, 1994, 2012). Microcultures provide a unique opportunity to test local shuttling and we tested the local shuttle hypothesis by culturing neurons in the absence of contact with an astrocyte bed (Sobieski et al., 2015). We showed previously that neurons without astrocyte contact exhibit altered synchrony of evoked glutamate release (−astrocyte; Fig. 7B) compared with astrocyte-supported controls (+astrocyte; Fig. 7A), but many other facets of evoked transmission are intact (Sobieski et al., 2015). Recovery of EPSCs after the vesicle depletion challenge was slightly depressed in −astrocyte neurons compared with +astrocyte neurons when recorded in control medium (Fig. 7C), but this effect was not statistically significant. Furthermore, incubation/recording in saline with lactate (1.5 mm) in place of glucose did not increase EPSC recovery after vesicle depletion (Fig. 7D). Therefore, any deficit in the recovery of −astrocyte EPSCs cannot be accounted for by the loss of astrocyte-derived lactate.
Figure 7.
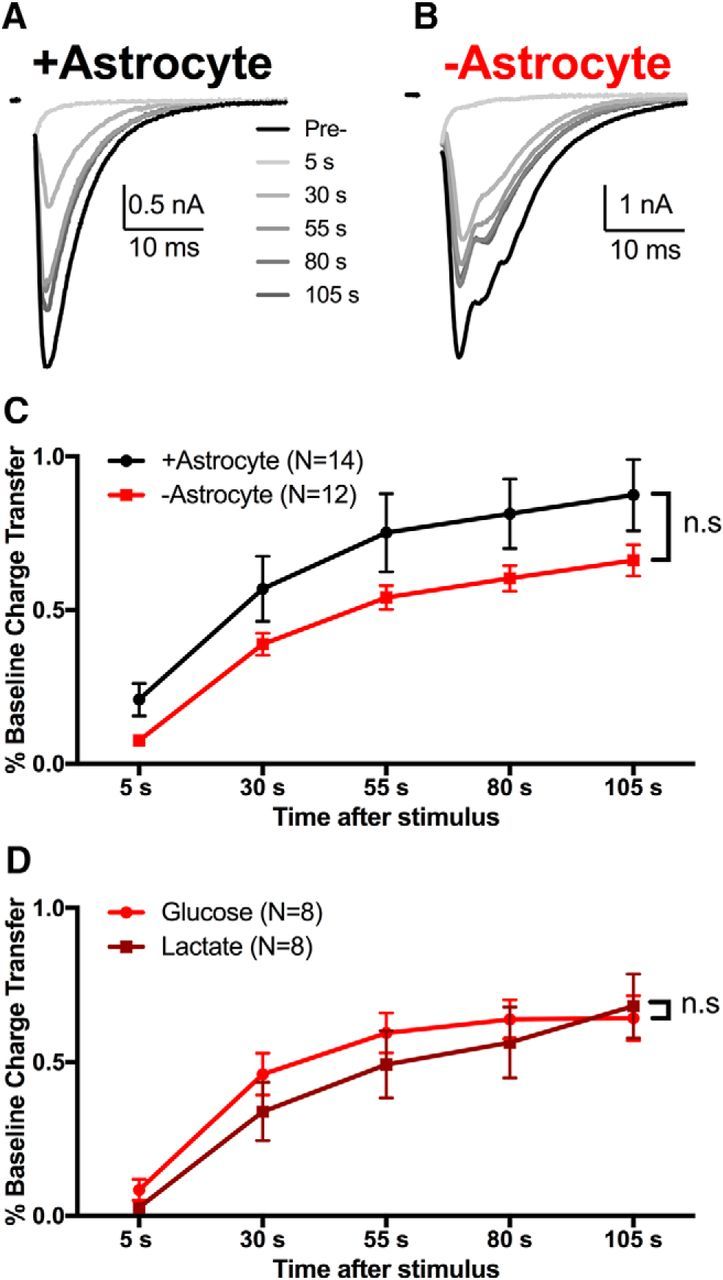
Local, on-demand monocarboxylate shuttling does not support the oxidative phosphorylation required for recovery. A, B, Recovery of evoked EPSCs after 30 s of 90 mm K+ from microcultures containing (+astrocyte) or missing (−astrocyte) a local astrocyte bed. Note that both +astrocyte and −astrocyte microcultures were obtained from the same plates. C, Summary of recovery after vesicle depletion in +astrocyte (black) and −astrocyte (red) microcultures (p > 0.05, two-way ANOVA). D, Summary of recovery of sibling −astrocyte EPSCs incubated in control medium (light red) or in lactate (dark red, 1.5 mm, 15 min; p > 0.05, two-way ANOVA). Data are represented as mean ± SEM. n.s, nonsignificant.
Although these observations exclude a strong role for local, on-demand monocarboxylate shuttling as envisioned by the astrocyte–neuron lactate shuttle hypothesis (Pellerin and Magistretti, 1994, 2012), it is possible that bulk lactate levels derived from the summed contributions of surrounding astrocytes participates in fueling recovery from vesicle depletion. We tested the importance of global lactate efflux by pharmacologically inhibiting monocarboxylate transport with the monocarboxylate transport inhibitor 4-CIN (100 μm) for 15 min. 4-CIN had no effect on EPSC recovery after total vesicle depletion (Fig. 8A,C). These results suggest that either neuronal glycolysis or perhaps the breakdown of alternative fuel reserves can support synaptic transmission when lactate shuttling alone is inhibited.
Figure 8.

Oxidative phosphorylation fueling presynaptic recovery is flexibly supplied by neuronal glycolysis or by monocarboxylate transport. A, B, Representative traces of EPSC recovery after monocarboxylate transport inhibition alone (A; 4-CIN, 100 μm) or combined inhibition of glycolysis and monocarboxylate transport (B; 2DG+4-CIN) for 15 min. C, D, Summary of recovery after 30 s of 90 mm K+ after incubation in 4-CIN alone (C, p > 0.05, two-way ANOVA) or combined 2DG+4-CIN (D, p < 0.05, two-way ANOVA). Data are represented as mean ± SEM. *p ≤ 0.05; n.s, nonsignificant.
Reducing either neuronal glycolysis (Fig. 6D) or monocarboxylate transport (Fig. 8C) to diminish supply of substrates to the TCA cycle yielded little effect on EPSC recovery after vesicle depletion. These data suggest two sources of fuel for oxidative phosphorylation, either of which can support EPSC recovery after depletion. We next examined the combined effects of inhibition of monocarboxylate transport and glycolysis. Coadministration of 2DG and 4-CIN reduced EPSC recovery significantly after vesicle depletion (Fig. 8B,D). Therefore, although inhibition of neither monocarboxylate transport (Fig. 8A,C) nor neuronal glycolysis alone (Fig. 6B,D) altered recovery, combined inhibition of both partially arrested EPSC recovery, equivalent to the effect of oligo (Fig. 6C,E). These data suggest that oxidative phosphorylation continuously supplies ATP necessary for synaptic vesicle recovery after depletion and substrate for oxidative phosphorylation can originate from either extracellular monocarboxylates or from neuronal glycolysis.
Discussion
In this study, we investigated the sources of ATP synthesis that drive basal presynaptic function and recovery of function after high energetic demand. Our work shows that ongoing ATP production, either through glycolysis or oxidative phosphorylation, sustains evoked synaptic transmission for up to 20 min. Only the combined inhibition of glycolysis and oxidative phosphorylation abolished PSCs evoked at low frequency. The loss of evoked transmission likely results from massive spontaneous vesicle release and subsequent failure to endocytose vesicles. Our data also suggest that oxidative phosphorylation has a privileged role in powering the rapid recovery of EPSCs after vesicle depletion. Neuronal presynaptic oxidative phosphorylation appears to be flexible in the use of energetic substrates because either neuronal glycolysis or astrocyte-derived monocarboxylates sufficed to fuel recovery. Overall, our work elucidates the sources of presynaptic ATP during basal and high-demand activity.
Our work adds mechanistic details to previous studies that have highlighted the energetic demand of neurons in brain slices. EPSPs in hippocampal slices are very sensitive to glucose deprivation (Schurr et al., 1988; Izumi et al., 1994, 1997). However, the roles of presynaptic and postsynaptic factors and of glycolysis versus oxidative phosphorylation have been unclear. In slices, energetic depression leads to accumulation of neurotransmitters and other secondary changes. It can be difficult to know whether changes to transmission are a direct consequence of changes to ATP levels or to these secondary consequences. Further, the trauma of tissue preparation can cause important metabolic changes that affect results (Takano et al., 2014). Although cultures have their own limitations, they allow experimental control not possible in situ, including our isolation of local versus global astrocyte contributions.
Several of our observations appear to conflict with other recent studies. Figure 1H suggests that ion gradients are rapidly compromised by inhibition of ATP produced by oxidative phosphorylation. Other recent work found that the Na+/K+ ATPase is a relatively light burden on presynaptic ATP levels (Rangaraju et al., 2014). One reconciliation could be that ATP demands are compartmentalized, with more ATPase burden near the soma, where our whole-cell recordings of sodium currents and action potentials were made. However, another complication is that, at the calyx of Held synapse, presynaptic axonal action potential waveform is quite sensitive to glycolytic inhibition due to collapse of ion gradients (Lujan et al., 2016). There are two surprising things about these results compared with ours. First, we found that inhibition of oxidative phosphorylation alone, rather than glycolysis alone, produced changes to sodium current and action potential waveform. Second, because hippocampal glutamate release is quite sensitive to changes in action potential waveform (Prakriya and Mennerick, 2000; Meeks and Mennerick, 2004; Sobieski et al., 2015; Lujan et al., 2016), if the somatic action potential waveform changes that we observed after oligo treatment alone were propagated to terminals, then we would have expected strong alteration of transmitter release. Instead, we found that the changes to excitability produced by oligo alone were not associated with deficits in evoked PSCs.
Our results also differ from others with regard to the role of glycolysis on endocytosis. Previous work suggests that endocytosis relies heavily on glycolysis (Rangaraju et al., 2014; Pathak et al., 2015). In contrast, we observed that vesicle endocytosis, measured by FM1–43FX fluorescence (Fig. 4C,G, burgundy bar), and PSCs recovered well after sole inhibition of glycolysis (Fig. 6D). The reasons for the discrepancies are unclear, but could relate to use of different methods to measure presynaptic activity.
Our observations uncovered massive vesicle exocytosis during combined glycolytic and oxidative phosphorylation inhibition. Similar effects have been observed after oxygen–glucose deprivation (Allen et al., 2004; Fujimoto et al., 2004) or pharmacological manipulation of glycolysis and oxidative phosphorylation (Lujan et al., 2016). Endocytic failure after the mass vesicle exocytosis appears sufficient to explain the loss of evoked PSCs (Fig. 5); however, we cannot exclude other mechanisms, such as ATP-dependent vesicle filling or vesicle priming, contributing to the loss of evoked PSCs. The precise cause of the massive exocytosis remains unclear. Collapse of ion gradients and consequent depolarization-dependent calcium influx or mitochondrial efflux could participate (Lujan et al., 2016). Other Ca2+-independent possibilities include electrostatic effects of ATP on synaptogatmin-1 function and ATP-dependent SNARE complex disassembly (Park et al., 2012).
The persistence of spontaneous mPSCs after metabolic inhibition could suggest differential sensitivity of vesicle pools underlying spontaneous and evoked neurotransmission (for review, see Crawford and Kavalali, 2015). It is tempting to speculate that the different molecular identities of the two pools afford them different energetic sensitivity or that ATP depletion shifts the evoked pool of vesicles into a spontaneous-only mode of release. Alternatively, the residual mPSCs during the period of abolished evoked transmission could simply reflect a few remaining functional terminals that were not readily detected in our measures of evoked release. In the future, it will be important to explore the differential neuroenergetics of spontaneous and evoked release in more detail.
An important conclusion from our work is that oxidative phosphorylation plays a more prominent role than glycolysis in fueling recovery of transmission after brief, intense metabolic challenge. Vesicle endocytosis, as probed by FM1–43FX uptake (Fig. 4D,G, teal bar), was unperturbed by pretreatment with oligo. This suggests that the depression of recovery of evoked EPSCs after depolarizing challenge (Fig. 6C,E) likely results from a mechanism other than endocytic arrest, such as a deficit in replenishment of vesicles from the reserve pool or vesicle filling.
The importance of oxidative phosphorylation for EPSC recovery after a strong presynaptic stimulus could implicate the astrocyte–neuron lactate shuttle (Pellerin and Magistretti, 1994; Takahashi et al., 1995; Bittner et al., 2010). However, neither pharmacological inhibition of monocarboxylate transport (Fig. 8A,C) nor removal of local astrocyte support (Fig. 7A–C) altered EPSC recovery. Therefore, local, on-demand lactate shuttling from astrocytes in response to increased activity does not account for presynaptic recovery. In fact, EPSC recovery after vesicle depletion was only reduced by obstructing both glycolysis and monocarboxylate transport to neurons (Fig. 8B,D), effectively cutting off two main fuel supplies for oxidative phosphorylation. These findings suggest that oxidative phosphorylation fueling presynaptic recovery can be effectively sourced by either neuronal glycolysis or by ambient, global monocarboxylates.
Interestingly, basal synaptic transmission was not ablated with coincubation of 2DG and 4-CIN as it was with 2DG and oligo (Fig. 1D,E). The inability of combined 2DG/4-CIN to depress basal evoked synaptic transmission most likely results from incomplete inhibition of monocarboxylate transport by 4-CIN. Alternatively, additional substrates for oxidative phosphorylation could maintain basal function. One alternative is glutamate, which can be converted to α-ketoglutarate, an important TCA intermediate and potential source of pyruvate (McKenna, 2007). Ketone bodies represent another alternative fuel and direct source for acetyl-Co-A (Izumi et al., 1998). Typically, ketone bodies are derived peripherally, with questionable relevance to dissociated cultures, but they also may be produced by astrocytes (Takahashi et al., 2014). In future work, it would be intriguing to query to roles of these fuel sources in fueling synaptic transmission and presynaptic function.
The relative importance of oxidative phosphorylation over glycolysis is also interesting because of the presynaptic compartmentalization of glycolysis and oxidative phosphorylation within the neuron. Early and more recent work has found that glycolytic machinery in the presynaptic cytosol maintains K+ homeostasis by fueling Na+/K+-ATPase activity (Knull, 1978; Lipton and Whittingham, 1982; Lujan et al., 2016). Conversely, mitochondria reside in only 25–40% of presynaptic terminals (Chavan et al., 2015; Pathak et al., 2015). Despite the sporadic localization of mitochondria to presynaptic terminals, our work and that of others demonstrates that oxidative phosphorylation is important for presynaptic function (Verstreken et al., 2005; Kang et al., 2008; Hall et al., 2012; Sun et al., 2013; Pathak et al., 2015). Therefore, sparse mitochondria apparently produce sufficient ATP to supply neighboring boutons (Pathak et al., 2015).
In conclusion, synaptic transmission is surprisingly resilient to changes in metabolic substrate availability. Either glycolysis or oxidative phosphorylation suffices to fuel basal synaptic transmission, but loss of both leads to a massive release of synaptic vesicles, diminished vesicle endocytosis, and evoked PSC loss. Further metabolic challenges, such as strong depolarization, reveal a preferential role of oxidative phosphorylation in producing the ATP required for presynaptic recovery. In turn, oxidative phosphorylation is fueled by either neuronal glycolysis or the transport of ambient monocarboxylates, likely from astrocytes. Impeding both fuel supplies weakens EPSC recovery. Together, our data showcase the flexibility of neurons to changes in metabolic substrate availability to maintain presynaptic function.
Footnotes
This work was supported by the National Institutes of Health (Grants MH078823, MH099658, MH104506, and MH106198). We thank Ann Benz and Amanda Taylor for technical help with cultures and laboratory members for advice and discussion.
The authors declare no competing financial interests.
References
- Allen NJ, Rossi DJ, Attwell D (2004) Sequential release of GABA by exocytosis and reversed uptake leads to neuronal swelling in simulated ischemia of hippocampal slices. J Neurosci 24:3837–3849. 10.1523/JNEUROSCI.5539-03.2004 [DOI] [PMC free article] [PubMed] [Google Scholar]
- Attwell D, Laughlin SB (2001) An energy budget for signaling in the grey matter of the brain. J Cereb Blood Flow Metab 21:1133–1145. [DOI] [PubMed] [Google Scholar]
- Auestad N, Korsak RA, Morrow JW, Edmond J (1991) Fatty acid oxidation and ketogenesis by astrocytes in primary culture. J Neurochem 56:1376–1386. 10.1111/j.1471-4159.1991.tb11435.x [DOI] [PubMed] [Google Scholar]
- Bekkers JM, Stevens CF (1991) Excitatory and inhibitory autaptic currents in isolated hippocampal neurons maintained in cell culture. Proc Natl Acad Sci U S A 88:7834–7838. 10.1073/pnas.88.17.7834 [DOI] [PMC free article] [PubMed] [Google Scholar]
- Bittner CX, Loaiza A, Ruminot I, Larenas V, Sotelo-Hitschfeld T, Gutiérrez R, Córdova A, Valdebenito R, Frommer WB, Barros LF (2010) High resolution measurement of the glycolytic rate. Front Neuroenergetics 2: pii: 26. 10.3389/fnene.2010.00026 [DOI] [PMC free article] [PubMed] [Google Scholar]
- Chatton JY, Pellerin L, Magistretti PJ (2003) GABA uptake into astrocytes is not associated with significant metabolic cost: implications for brain imaging of inhibitory transmission. Proc Natl Acad Sci U S A 100:12456–12461. 10.1073/pnas.2132096100 [DOI] [PMC free article] [PubMed] [Google Scholar]
- Chavan V, Willis J, Walker SK, Clark HR, Liu X, Fox MA, Srivastava S, Mukherjee K (2015) Central presynaptic terminals are enriched in ATP but the majority lack mitochondria. PLoS One 10:e0125185. 10.1371/journal.pone.0125185 [DOI] [PMC free article] [PubMed] [Google Scholar]
- Chih CP, He J, Sly TS, Roberts EL Jr (2001) Comparison of glucose and lactate as substrates during NMDA-induced activation of hippocampal slices. Brain Res 893:143–154. 10.1016/S0006-8993(00)03306-0 [DOI] [PubMed] [Google Scholar]
- Choi HB, Gordon GR, Zhou N, Tai C, Rungta RL, Martinez J, Milner TA, Ryu JK, McLarnon JG, Tresguerres M, Levin LR, Buck J, MacVicar BA (2012) Metabolic communication between astrocytes and neurons via bicarbonate-responsive soluble adenylyl cyclase. Neuron 75:1094–1104. 10.1016/j.neuron.2012.08.032 [DOI] [PMC free article] [PubMed] [Google Scholar]
- Chung C, Barylko B, Leitz J, Liu X, Kavalali ET (2010) Acute dynamin inhibition dissects synaptic vesicle recycling pathways that drive spontaneous and evoked neurotransmission. J Neurosci 30:1363–1376. 10.1523/JNEUROSCI.3427-09.2010 [DOI] [PMC free article] [PubMed] [Google Scholar]
- Crawford DC, Kavalali ET (2015) Molecular underpinnings of synaptic vesicle pool heterogeneity. Traffic 16:338–364. 10.1111/tra.12262 [DOI] [PMC free article] [PubMed] [Google Scholar]
- Edmond J, Robbins RA, Bergstrom JD, Cole RA, de Vellis J (1987) Capacity for substrate utilization in oxidative metabolism by neurons, astrocytes, and oligodendrocytes from developing brain in primary culture. J Neurosci Res 18:551–561. 10.1002/jnr.490180407 [DOI] [PubMed] [Google Scholar]
- Erlichman JS, Hewitt A, Damon TL, Hart M, Kurascz J, Li A, Leiter JC (2008) Inhibition of monocarboxylate transporter 2 in the retrotrapezoid nucleus in rats: a test of the astrocyte-neuron lactate-shuttle hypothesis. J Neurosci 28:4888–4896. 10.1523/JNEUROSCI.5430-07.2008 [DOI] [PMC free article] [PubMed] [Google Scholar]
- Fujimoto S, Katsuki H, Kume T, Kaneko S, Akaike A (2004) Mechanisms of oxygen glucose deprivation-induced glutamate release from cerebrocortical slice cultures. Neurosci Res 50:179–187. 10.1016/j.neures.2004.06.013 [DOI] [PubMed] [Google Scholar]
- Gallagher CN, Carpenter KL, Grice P, Howe DJ, Mason A, Timofeev I, Menon DK, Kirkpatrick PJ, Pickard JD, Sutherland GR, Hutchinson PJ (2009) The human brain utilizes lactate via the tricarboxylic acid cycle: a 13C-labelled microdialysis and high-resolution nuclear magnetic resonance study. Brain 132:2839–2849. 10.1093/brain/awp202 [DOI] [PubMed] [Google Scholar]
- Hall CN, Klein-Flügge MC, Howarth C, Attwell D (2012) Oxidative phosphorylation, not glycolysis, powers presynaptic and postsynaptic mechanisms underlying brain information processing. J Neurosci 32:8940–8951. 10.1523/JNEUROSCI.0026-12.2012 [DOI] [PMC free article] [PubMed] [Google Scholar]
- Harris JJ, Jolivet R, Attwell D (2012) Synaptic energy use and supply. Neuron 75:762–777. 10.1016/j.neuron.2012.08.019 [DOI] [PubMed] [Google Scholar]
- Hertz L, Drejer J, Schousboe A (1988) Energy metabolism in glutamatergic neurons, GABAergic neurons and astrocytes in primary cultures. Neurochem Res 13:605–610. 10.1007/BF00973275 [DOI] [PubMed] [Google Scholar]
- Ikemoto A, Bole DG, Ueda T (2003) Glycolysis and glutamate accumulation into synaptic vesicles: role of glyceraldehyde phosphate dehydrogenase and 3-phosphoglycerate kinase. J Biol Chem 278:5929–5940. 10.1074/jbc.M211617200 [DOI] [PubMed] [Google Scholar]
- Ivanov A, Mukhtarov M, Bregestovski P, Zilberter Y (2011) Lactate effectively covers energy demands during neuronal network activity in neonatal hippocampal slices. Front Neuroenergetics 3:2. 10.3389/fnene.2011.00002 [DOI] [PMC free article] [PubMed] [Google Scholar]
- Izumi Y, Benz AM, Zorumski CF, Olney JW (1994) Effects of lactate and pyruvate on glucose deprivation in rat hippocampal slices. Neuroreport 5:617–620. 10.1097/00001756-199401000-00021 [DOI] [PubMed] [Google Scholar]
- Izumi Y, Benz AM, Katsuki H, Zorumski CF (1997) Endogenous monocarboxylates sustain hippocampal synaptic function and morphological integrity during energy deprivation. J Neurosci 17:9448–9457. [DOI] [PMC free article] [PubMed] [Google Scholar]
- Izumi Y, Ishii K, Katsuki H, Benz AM, Zorumski CF (1998) beta-Hydroxybutyrate fuels synaptic function during development. Histological and physiological evidence in rat hippocampal slices. J Clin Invest 101:1121–1132. 10.1172/JCI1009 [DOI] [PMC free article] [PubMed] [Google Scholar]
- Jang S, Nelson JC, Bend EG, Rodríguez-Laureano L, Tueros FG, Cartagenova L, Underwood K, Jorgensen EM, Colón-Ramos DA (2016) Glycolytic enzymes localize to synapses under energy stress to support synaptic function. Neuron 90:278–291. 10.1016/j.neuron.2016.03.011 [DOI] [PMC free article] [PubMed] [Google Scholar]
- Kang JS, Tian JH, Pan PY, Zald P, Li C, Deng C, Sheng ZH (2008) Docking of axonal mitochondria by syntaphilin controls their mobility and affects short-term facilitation. Cell 132:137–148. 10.1016/j.cell.2007.11.024 [DOI] [PMC free article] [PubMed] [Google Scholar]
- Knull HR. (1978) Association of glycolytic enzymes with particulate fractions from nerve endings. Biochim Biophys Acta 522:1–9. 10.1016/0005-2744(78)90316-9 [DOI] [PubMed] [Google Scholar]
- Lipton P, Whittingham TS (1982) Reduced ATP concentration as a basis for synaptic transmission failure during hypoxia in the in vitro guinea-pig hippocampus. J Physiol 325:51–65. 10.1113/jphysiol.1982.sp014135 [DOI] [PMC free article] [PubMed] [Google Scholar]
- Lujan B, Kushmerick C, Banerjee TD, Dagda RK, Renden R (2016) Glycolysis selectively shapes the presynaptic action potential waveform. J Neurophysiol 116:2523–2540. 10.1152/jn.00629.2016 [DOI] [PMC free article] [PubMed] [Google Scholar]
- McKenna MC. (2007) The glutamate-glutamine cycle is not stoichiometric: fates of glutamate in brain. J Neurosci Res 85:3347–3358. 10.1002/jnr.21444 [DOI] [PubMed] [Google Scholar]
- McKenna MC. (2012) Substrate competition studies demonstrate oxidative metabolism of glucose, glutamate, glutamine, lactate and 3-hydroxybutyrate in cortical astrocytes from rat brain. Neurochem Res 37:2613–2626. 10.1007/s11064-012-0901-3 [DOI] [PMC free article] [PubMed] [Google Scholar]
- Meeks JP, Mennerick S (2004) Selective effects of potassium elevations on glutamate signaling and action potential conduction in hippocampus. J Neurosci 24:197–206. 10.1523/JNEUROSCI.4845-03.2004 [DOI] [PMC free article] [PubMed] [Google Scholar]
- Mennerick S, Zorumski CF (1995) Paired-pulse modulation of fast excitatory synaptic currents in microcultures of rat hippocampal neurons. J Physiol 488:85–101. 10.1113/jphysiol.1995.sp020948 [DOI] [PMC free article] [PubMed] [Google Scholar]
- Moulder KL, Jiang X, Taylor AA, Shin W, Gillis KD, Mennerick S (2007) Vesicle pool heterogeneity at hippocampal glutamate and GABA synapses. J Neurosci 27:9846–9854. 10.1523/JNEUROSCI.2803-07.2007 [DOI] [PMC free article] [PubMed] [Google Scholar]
- Moulder KL, Jiang X, Taylor AA, Benz AM, Mennerick S (2010) Presynaptically silent synapses studied with light microscopy. J Vis Exp 35: pii: e1676. 10.3791/1676 [DOI] [PMC free article] [PubMed] [Google Scholar]
- Park Y, Hernandez JM, van den Bogaart G, Ahmed S, Holt M, Riedel D, Jahn R (2012) Controlling synaptotagmin activity by electrostatic screening. Nat Struct Mol Biol 19:991–997. 10.1038/nsmb.2375 [DOI] [PMC free article] [PubMed] [Google Scholar]
- Pathak D, Shields LY, Mendelsohn BA, Haddad D, Lin W, Gerencser AA, Kim H, Brand MD, Edwards RH, Nakamura K (2015) The role of mitochondrially derived ATP in synaptic vesicle recycling. J Biol Chem 290:22325–22336. 10.1074/jbc.M115.656405 [DOI] [PMC free article] [PubMed] [Google Scholar]
- Pellerin L, Magistretti PJ (1994) Glutamate uptake into astrocytes stimulates aerobic glycolysis: a mechanism coupling neuronal activity to glucose utilization. Proc Natl Acad Sci U S A 91:10625–10629. 10.1073/pnas.91.22.10625 [DOI] [PMC free article] [PubMed] [Google Scholar]
- Pellerin L, Magistretti PJ (2012) Sweet sixteen for ANLS. J Cereb Blood Flow Metab 32:1152–1166. 10.1038/jcbfm.2011.149 [DOI] [PMC free article] [PubMed] [Google Scholar]
- Pfeiffer T, Schuster S, Bonhoeffer S (2001) Cooperation and competition in the evolution of ATP-producing pathways. Science 292:504–507. 10.1126/science.1058079 [DOI] [PubMed] [Google Scholar]
- Prakriya M, Mennerick S (2000) Selective depression of low-release probability excitatory synapses by sodium channel blockers. Neuron 26:671–682. 10.1016/S0896-6273(00)81203-9 [DOI] [PubMed] [Google Scholar]
- Rangaraju V, Calloway N, Ryan TA (2014) Activity-driven local ATP synthesis is required for synaptic function. Cell 156:825–835. 10.1016/j.cell.2013.12.042 [DOI] [PMC free article] [PubMed] [Google Scholar]
- Rosenmund C, Stevens CF (1996) Definition of the readily releasable pool of vesicles at hippocampal synapses. Neuron 16:1197–1207. 10.1016/S0896-6273(00)80146-4 [DOI] [PubMed] [Google Scholar]
- Sara Y, Mozhayeva MG, Liu X, Kavalali ET (2002) Fast vesicle recycling supports neurotransmission during sustained stimulation at hippocampal synapses. J Neurosci 22:1608–1617. [DOI] [PMC free article] [PubMed] [Google Scholar]
- Schurr A, West CA, Rigor BM (1988) Lactate-supported synaptic function in the rat hippocampal slice preparation. Science 240:1326–1328. 10.1126/science.3375817 [DOI] [PubMed] [Google Scholar]
- Schurr A, Miller JJ, Payne RS, Rigor BM (1999) An increase in lactate output by brain tissue serves to meet the energy needs of glutamate-activated neurons. J Neurosci 19:34–39. [DOI] [PMC free article] [PubMed] [Google Scholar]
- Sobieski C, Jiang X, Crawford DC, Mennerick S (2015) Loss of local astrocyte support disrupts action potential propagation and glutamate release synchrony from unmyelinated hippocampal axon terminals in vitro. J Neurosci 35:11105–11117. 10.1523/JNEUROSCI.1289-15.2015 [DOI] [PMC free article] [PubMed] [Google Scholar]
- Sonnewald U, White LR, Odegård E, Westergaard N, Bakken IJ, Aasly J, Unsgård G, Schousboe A (1996) MRS study of glutamate metabolism in cultured neurons/glia. Neurochem Res 21:987–993. 10.1007/BF02532408 [DOI] [PubMed] [Google Scholar]
- Sun T, Qiao H, Pan PY, Chen Y, Sheng ZH (2013) Motile axonal mitochondria contribute to the variability of presynaptic strength. Cell Rep 4:413–419. 10.1016/j.celrep.2013.06.040 [DOI] [PMC free article] [PubMed] [Google Scholar]
- Takahashi S, Driscoll BF, Law MJ, Sokoloff L (1995) Role of sodium and potassium ions in regulation of glucose metabolism in cultured astroglia. Proc Natl Acad Sci U S A 92:4616–4620. 10.1073/pnas.92.10.4616 [DOI] [PMC free article] [PubMed] [Google Scholar]
- Takahashi S, Iizumi T, Mashima K, Abe T, Suzuki N (2014) Roles and regulation of ketogenesis in cultured astroglia and neurons under hypoxia and hypoglycemia. ASN Neuro 6: pii: 1759091414550997. 10.1177/1759091414550997 [DOI] [PMC free article] [PubMed] [Google Scholar]
- Takano T, He W, Han X, Wang F, Xu Q, Wang X, Oberheim Bush NA, Cruz N, Dienel GA, Nedergaard M (2014) Rapid manifestation of reactive astrogliosis in acute hippocampal brain slices. Glia 62:78–95. 10.1002/glia.22588 [DOI] [PMC free article] [PubMed] [Google Scholar]
- Tang F, Lane S, Korsak A, Paton JF, Gourine AV, Kasparov S, Teschemacher AG (2014) Lactate-mediated glia-neuronal signalling in the mammalian brain. Nat Commun 5:3284. 10.1038/ncomms4284 [DOI] [PMC free article] [PubMed] [Google Scholar]
- Verstreken P, Ly CV, Venken KJ, Koh TW, Zhou Y, Bellen HJ (2005) Synaptic mitochondria are critical for mobilization of reserve pool vesicles at Drosophila neuromuscular junctions. Neuron 47:365–378. 10.1016/j.neuron.2005.06.018 [DOI] [PubMed] [Google Scholar]
- Waldvogel D, van Gelderen P, Muellbacher W, Ziemann U, Immisch I, Hallett M (2000) The relative metabolic demand of inhibition and excitation. Nature 406:995–998. 10.1038/35023171 [DOI] [PubMed] [Google Scholar]
- Wyss MT, Jolivet R, Buck A, Magistretti PJ, Weber B (2011) In vivo evidence for lactate as a neuronal energy source. J Neurosci 31:7477–7485. 10.1523/JNEUROSCI.0415-11.2011 [DOI] [PMC free article] [PubMed] [Google Scholar]