Abstract
Triolimus is a multi-drug loaded polymeric micelle containing paclitaxel (PTX), 17-allylamino-17-demethoxygeldanamycin (17-AAG), and rapamycin (RAP). In this study, we examined the radiosensitizing effect of Triolimus in vitro and in vivo. Radiosensitizing effects of Triolimus on A549 cells were dose dependent and at 2 nM, Triolimus showed significant radiosensitization even at low radiation doses (2 Gy). By sensitivity enhancement ratio (SER), PTX alone, dual drug combinations, and Triolimus treatment at 2 nM had radiosensitizing effects with potency as follows: PTX alone (PTX) > PTX and RAP (P/R) > Triolimus (TRIO) > PTX and 17-AAG (P/17) > 17-AAG and RAP (17/R). In vivo, fractionated radiation of 15 Gy preceded by infusion of PTX alone, dual drug combinations, or an intermediate dose of Triolimus (Int. TRIO: PTX/17-AAG/RAP at 15/15/7.5 mg/kg) strongly inhibited A549 tumor growth. Notably, pretreatment with high dose of Triolimus (High TRIO: PTX/17-AAG/RAP at 60/60/30 mg/kg) before the fractionated radiation led to tumor control for up to 24 weeks. An enhanced radiosensitizing effect was observed without an increase in acute toxicity compared to PTX alone or radiation alone. These results suggest that further investigations of Triolimus in combination with radiation therapy are merited.
Keywords: polymeric micelles, radiosensitization, chemoradiotherapy, multi-drug delivery
1. INTRODUCTION
Drug combinations with various anticancer mechanisms are effective in overcoming tumor heterogeneity, reducing chemoresistance, and obtaining additive or synergistic anticancer efficacy [1]. Previous studies demonstrated the efficacy of a multi-drug loaded micellar system called “Triolimus” that contains PTX, 17-AAG and RAP in a poly(ethylene glycol)-block-poly(d,l-lactic acid) (PEG-b-PLA) micelle. Triolimus exhibits enhanced aqueous solubility of each drug, synergistic cytotoxicity, and potent tumor growth inhibition in xenograft models [2–10].
Radiosensitizing effects of PTX, 17-AAG, and RAP have been reported. PTX radiosensitizes cancer cells by inhibiting cell cycle progression at a radiosensitive phase (G2/M) [11, 12]. 17-AAG augments radiosensitization by inhibiting heat shock protein (Hsp) 90 function [13–17]. Lastly, RAP radiosensitizes cancer cells by inhibiting mTOR, which is downstream of the PI3K-Akt survival pathway [18, 19]. Based on these observations, we hypothesized that Triolimus may exhibit potent radiosensitization effects and identify it as a promising candidate for chemoradiotherapy. To test this hypothesis, we studied the effects of PTX alone, dual drug combinations, and Triolimus on clonogenic survival and radiosensitization of A549 cells as well as the anticancer effects of these drug combinations in an A549 xenograft mouse model. Immunohistochemical analysis of proliferative activity, apoptosis and protein expression was performed. Hematologic and tissue microscopic analyses were conducted to evaluate the toxicity of PTX alone, dual drug combinations, and Triolimus.
2. MATERIALS AND METHODS
2.1. Materials
PEG-b-PLA with Mw of PEG = 4000 g/mol and PLA = 2200 g/mol was purchased from Advanced Polymer Materials Inc. (Montreal, CAN). PTX, 17-AAG, and RAP were purchased from LC Laboratories (Woburn, MA). A549 human lung adenocarcinoma cell line was purchased from ATCC (Manassas, VA). Crystal violet was purchased from Sigma-Aldrich (St. Louis, MO). All other reagents were obtained from Thermo Fisher Scientific Inc. (Fairlawn, NJ) and were of analytical grade.
2.2. Methods
2.2.1. Preparation and characterization of drug-loaded PEG-b-PLA micelles
PTX, 17-AAG and RAP loaded PEG-b-PLA micelles were prepared by freeze-drying from a tert-butanol-water mixture [20]: 105.0 mg of PEG-b-PLA (PEG average Mn ~4000 g/mol, PLA average Mn ~2200 g/mol) and 6.0 mg of PTX, 6.0 mg of 17-AAG, and 3.0 mg of RAP were dissolved in 1.0 mL of tert-butanol at 60 °C, followed by addition of 1.0 mL of pre-warmed double-distilled water at 60 °C with vigorous mixing. The mixture was allowed to freeze in dry ice/ethanol cooling bath at -70 °C for 2 h. Lyophilization was then performed on a VirTis AdVantage Pro freeze dryer (SP Scientific, Gardiner, NY) at −20 °C shelf inlet temperature for 72 h at 100 μBar throughout the experiment. Single drug (PTX) and dual drug (P/17, P/R, and 17/R) loaded PEG-b-PLA micelles were similarly prepared. The freeze-dried samples were stored at −20 °C until use. Before use, the lyophilized cake was rehydrated with 1.0 mL of 0.9% saline solution at 60 °C, centrifuged at 13,000 rpm for 5 min, and filtered through 0.22 μm regenerated cellulose filter.
Z-average diameter and polydispersity index (PDI) of drug-loaded PEG-b-PLA micelles at 25 °C were measured using a Zetasizer Nano-ZS (Malvern Instruments, UK) at a fixed angle of 173 °. Prior to measurement, drug-loaded PEG-b-PLA micelles were diluted 50-fold in physiological saline.
The drug content of PEG-b-PLA micelles was quantified by a reverse-phase Shimadzu Prominence HPLC system (Shimadzu, Japan). Ten μL of drug-loaded PEG-b-PLA micelle solution were dissolved in 990 μL of acetonitrile. Ten μL of the dissolved solution were injected into a Zorbax RX-C8 analytical column (4.6 mm ×250 mm, particle size 5 μm, Agilent) at a flow rate of 1.0 mL/min, a run time of 20 minutes, and a column oven temperature of 40 °C. The separation of PTX, 17-AAG, and RAP was achieved with a mobile phase consisting of 55% of acetonitrile, and 45% of water containing 0.1% phosphoric acid and 1% methanol under isocratic conditions. PTX, 17-AAG, and RAP were detected at 227, 333, and 279 nm, respectively. Retention times of PTX, 17-AAG, and RAP were 3, 4, and 11 minutes, respectively.
2.2.2. In vitro clonogenic assay
A549 cells were cultured in RPMI 1640 medium supplemented with 10% fetal bovine serum and 1% penicillin/streptomycin. A549 cells were maintained at 37 °C under an atmosphere of 5% CO2 in a humidified incubator.
The clonogenic assay procedure was similar to previously described methods [21] with certain modifications. Briefly, a feeder layer of A549 cells was prepared by radiation at 30 Gy by using a 137Cs irradiator (JL Shepherd Model 109 Irradiator, JL Shepherd & Associates, CA). The feeder layer and non-irradiated A549 cells were seeded on 6-well plates to a total of 2500 cells/well. After seeding, cells were incubated overnight. Then, A549 cells were pretreated by Triolimus at 1 to 3 nM, or PTX, P/17, P/R, and 17/R at 2 nM. Subsequently, cells were subjected to ionizing radiation (0–8 Gy). The medium was refreshed seven days after radiation and incubated for another three days. Following incubation, the medium was removed and cells were washed once with PBS. A549 cells were then stained with a 0.5% crystal violet/methanol solution for 15 min at 37 °C, and colonies were counted using a cutoff of 50 aggregated cells. Plating efficiency (PE) was calculated as (colony count)/ (inoculated non-irradiated cell number). From the calculated value of PE, the clonogenic survival rate of A549 cells was defined as (PE / PE of non-treatment). The survival fraction (SF) was calculated as (PE) / (PE at 0 Gy) of each treatment. A fitting curve was applied for the SF with a linear-quadratic equation: SF=exp(αD+βD2), where D is irradiation dose [21]. From the curve-fitting equation, the radiation dose necessary to kill 50% of cells in each treatment group was calculated to evaluate the sensitizer enhancement ratio (SER), defined as the radiation dose resulting in 50% cell kill without drug / radiation dose resulting in 50% cell kill with drug.
2.2.3. In vivo anticancer efficacy of drug-loaded PEG-b-PLA micelles with or without radiation
All animal experiments were approved by the Institutional Animal Care and Use Committee and conducted in accordance with institutional and NIH guidance. Female athymic nude mice ages 6–8 weeks were purchased from Harlan Laboratories (Madison, WI). A549 cells were harvested from sub-confluent cultures after trypsinization. Mice were anesthetized with 1.5% isoflurane/oxygen; this state was maintained with 1% isoflurane/oxygen. Mice were subcutaneously inoculated with A549 cells on the right side of the lower back (100 μL, 2×10⁶ cells/animal). Tumor volume was calculated as 0.5×a×b2 with “a” as the larger diameter of the tumor and “b” as the smaller diameter of the tumor. After reaching a tumor volume of approximately 150 mm3, mice were randomized into 14 groups (n=4) as follows: 1. PTX at 60 mg/kg with radiation (PTX+XRT). 2. PTX at 60 mg/kg. 3. PTX/17-AAG (60/60 mg/kg) with radiation (P/17+XRT). 4. PTX/17-AAG (60/60 mg/kg; P/17). 5. PTX/RAP (60/30 mg/kg) with radiation (P/R+XRT). 6. PTX/RAP (60/30 mg/kg; P/R). 7. 17-AAG/RAP (60/30 mg/kg) with radiation (17/R+XRT). 8. 17-AAG/RAP (60/30 mg/kg; 17/R). 9. High dose Triolimus (PTX/17-AAG/RAP at 60/60/30 mg/kg) with radiation (High TRIO+XRT). 10. High dose Triolimus (PTX/17-AAG/RAP at 60/60/30 mg/kg; High TRIO). 11. Intermediate dose Triolimus (PTX/17-AAG/RAP at 15/15/7.5 mg/kg) with radiation (Int. TRIO+XRT). 12. Intermediate dose Triolimus (PTX/17-AAG/RAP at 15/15/7.5 mg/kg; Int. TRIO). 13. Vehicle (empty PEG-b-PLA micelle at 105 mg/kg) with XRT (Vehicle+XRT). 14. Vehicle (empty PEG-b-PLA micelle at 105 mg/kg) (Vehicle). For each dose, 200 μL/20 g mice body weight was intravenously administered to anesthetized nude mice. For combined drug treatment and radiation groups, drug-loaded PEG-b-PLA micelles were administered prior to radiation; mice were then subjected to 5 days of 3 Gy/day radiation. Mice body weights and tumor diameters were determined with a portable scale and a digital caliper (Fisher Scientific, Pittsburgh, PA), respectively. All mice used for this study were euthanized either when tumor volume reached 400% of the initial tumor volume or on day 85.
2.2.4. Hematologic analysis to assess toxicity
PTX (60 mg/kg), P/17 (60/60 mg/kg), P/R (60/30 mg/kg), 17/R (60/30 mg/kg), High TRIO (PTX/17-AAG/RAP: 60/60/30 mg/kg), Int. TRIO (PTX/17-AAG/RAP: 12/12/6 mg/kg), Low TRIO (PTX/17-AAG/RAP: 2.4/2.4/1.2 mg/kg), and vehicle control (PEG-PLA only:105 mg/kg) were intravenously injected into A549 tumor-bearing female athymic nude mice. Animals were euthanized 24 hours post-injection. For the evaluation of Triolimus followed by XRT treatment group, High TRIO was intravenously injected on day 1, followed by fractionated radiation of 3 Gy for five days. At day six, animals were euthanized (TRIO + XRT group). The control group received a vehicle injection followed by XRT treatment (Vehicle + XRT group). Whole blood was collected in both lithium heparin and K2EDTA coated tubes just before euthanization. Whole blood in lithium heparin coated tubes was centrifuged at 3,000 rpm for 5 min to separate plasma for comprehensive metabolic panel. Whole blood in a K2EDTA coated tube was used for complete blood count (CBC). CBC and comprehensive metabolic panels were conducted by the Clinical Pathology Laboratory of School of Veterinary Medicine at the University of Wisconsin, Madison, WI.
Histologic and Immunohistochemical Analysis:
Tumor and normal tissue was fixed for 24 hours in 10% neutral buffered formalin, dehydrated through graded ethyl alcohols, paraffin-embedded, cut at 5 μm, and mounted on charged glass slides. H&E stained sections of the tumor and normal tissue including heart, lung, liver, kidney, spleen, and brain were prepared according to standard procedure. Tissue necrosis was assessed by light microscopy as percent total tumor area. Normal tissue sections were assessed for morphologic evidence of organ toxicity by an observer blinded to treatment. Immunostaining for Ki-67, cleaved caspase-3, Akt, phospho-Akt, and Hsp70 was carried out on a Roche Ventana Medical System Discovery XT Automated platform using proprietary Ventana-Roche reagents except for DaVinci Antibody Diluent and Cat-Hematoxylin (Biocare Medical). The slides were deparaffinized, and heat-induced epitope retrieval was performed in the form of “cell conditioning” using CC1 Buffer (EDTA buffer) for approximately 44 minutes. For Ki-67 detection, slides were then incubated with anti-human Ki-67 antibody (rabbit monoclonal, US Biological), 1:100, 28 minutes at 37°C, rinsed, and incubated with OmniMap anti-rabbit HRP for 12 minutes. For cleaved caspase-3, slides were incubated with anti-human cleaved caspase-3 antibody (rabbit polyclonal, Cell Signaling Technology), 1:400, 28 minutes at 37°C, rinsed and incubated with OmniMap anti-rabbit HRP for 12 minutes. For Akt, slides were incubated with anti-human Akt antibody (rabbit monoclonal, Cell Signaling Technology), 1:400, 16 minutes at 37°C, rinsed and incubated with OmniMap anti-rabbit HRP for 8 minutes. For phospho-Akt, slides were incubated with anti-human phospho-Akt antibody (rabbit monoclonal, Cell Signaling Technology), 1:50, 4 hour at 20°C, rinsed and incubated with UltraMap anti-rabbit HRP for 12 minutes. For HSP70, slides were incubated with HSP70 antibody (mouse monoclonal, Abcam), 1:3200, 28 minutes at 37°C, rinsed and incubated with UltraMap anti-mouse HRP for 12 minutes. The slides were then rinsed, incubated with ChromoDAB detection reagent, rinsed again and counterstained with Biocare Medical’s Cat-Hematoxylin diluted 1:5 in distilled water. Immunohistochemical staining was assessed as follows: for Ki-67 enumeration, four representative 400X fields per replicate tumor were quantified using ImmunoRatio software [22]; the average of four measurements per replicate was taken. For cleaved caspase, positive cells were enumerated manually in four representative 400X viable tumor fields using light microscopy, and an average of four measurements per replicate was taken. Cytoplasmic Akt, pAKT and HSP70 immunoreactivity were assessed semi-quantitatively by light microscopy as negative (<1% cells positive), focal (1–25% cells positive) or diffuse (>25% cells positive) and weak, moderate or strong based on the intensity of staining. All morphologic and immunohistochemical assessments were performed by a pathologist blinded to treatment groups.
2.2.5. Statistical analysis
Statistical analysis was performed using Student’s t-tests. Differences were deemed statistically significant if the two-tailed p-value was less than 0.05.
3. RESULTS
3.1. Physicochemical evaluation of drug-loaded PEG-b-PLA micelles
Particle size and PDI of Triolimus, PTX, P/17, P/R, 17/R, and the Vehicle control are summarized in Table 1. PEG-b-PLA micelles solubilizing PTX alone or multiple drugs had an average Z-diameter of ca. 35 nm with a PDI of 0.12, irrespective of contents. Drug loading slightly increased particle size and decreased PDI. All drugs loaded in PEG-b-PLA micelles had high aqueous solubility, even multi-drug formulations. These results correspond to previous reports [8, 9].
Table 1.
Size, PDI, and drug loading of PEG-b-PLA micelles
| Particle size [nm] | PDI | Loading [mg/mL] | ||
|---|---|---|---|---|
| Triolimus | 34±1 | 0.12±0.01 | PTX | 6.4±0.1 |
| 17-AAG | 6.3±0.2 | |||
| RAP | 3.7±0.1 | |||
|
| ||||
| PTX/17-AAG | 33±1 | 0.11±0.01 | PTX | 6.4±0.3 |
| 17-AAG | 6.2±0.3 | |||
|
| ||||
| PTX/RAP | 35.1±0.4 | 0.118±0.003 | PTX | 6.2±0.2 |
| RAP | 3.6±0.3 | |||
|
| ||||
| 17-AAG/RAP | 35.1±0.3 | 0.11±0.01 | 17-AAG | 5.8±0.2 |
| RAP | 3.2±0.1 | |||
|
| ||||
| PTX | 34±1 | 0.109±0.005 | PTX | 6.4±0.3 |
|
| ||||
| Vehicle | 33.9±0.5 | 0.131±0.002 | ||
3.2. Clonogenic assay in vitro
The effect Triolimus on clonogenic survival of A549 cells is shown in Fig.1A. The inhibitory effect of Triolimus was dose-dependent (1 nM: 0.92±0.13, 2 nM: 0.51±0.07), and A549 cells did not survive after exposure to 3 nM of Triolimus. The effect of Triolimus on radiosensitization is shown in Fig.1B. Similar to clonogenic survival results, the radiosensitizing effect of Triolimus was dose-dependent. Interestingly, Triolimus had a significant radiosensitizing effect as low as 1 nM when combined with 2 Gy of radiation. This effect was augmented at 2 nM (The SER value at 1 and 2 nM: 1.58 and 2.23, respectively). These results suggest that Triolimus is a potent radiosensitizer.
Fig. 1.
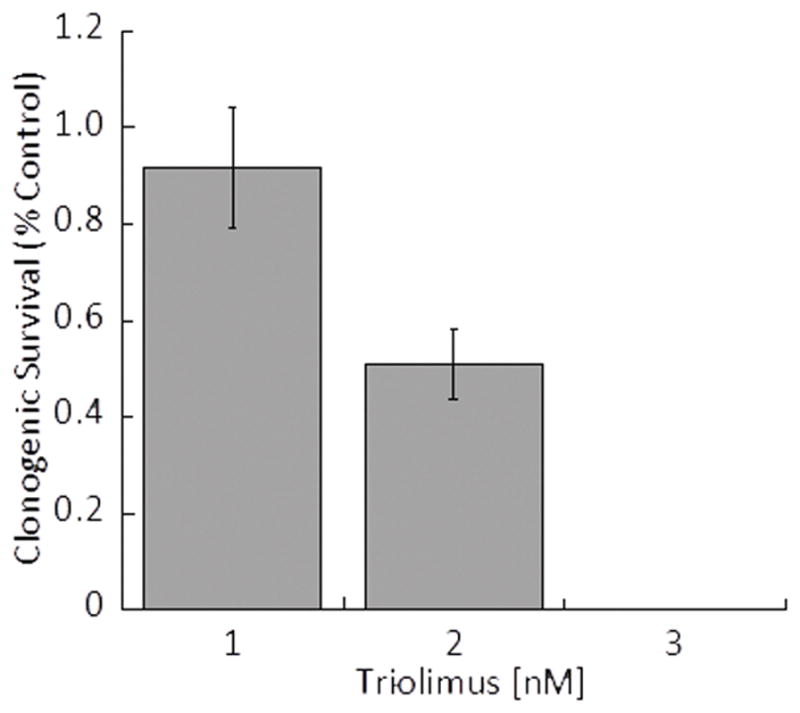
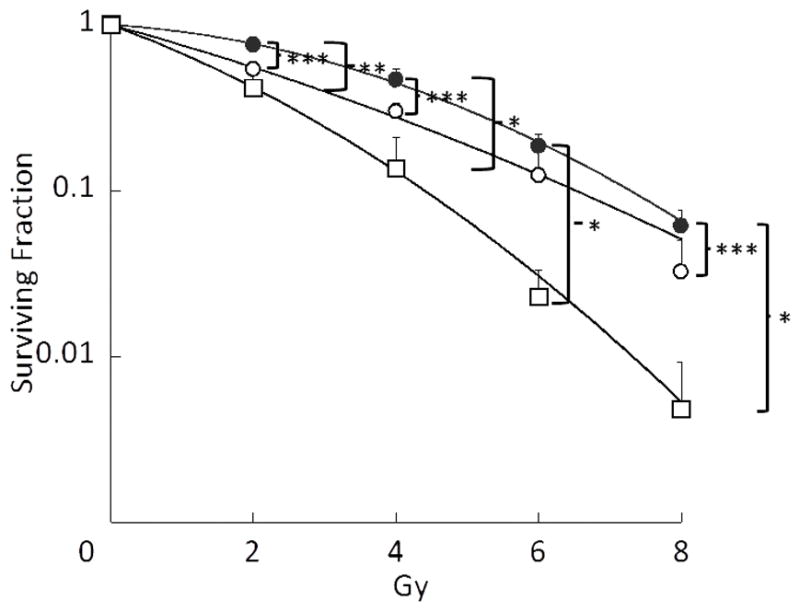
Fig.1A: Effect of Triolimus concentration on A549 clonogenic survival (*: P<0.05)
Fig. 1B: Effects of Triolimus on radiosensitivity (black circle: no treatment, open circle: 1 nM, open square: 2 nM) (*: P<0.0005, **: P<0.001, ***: P<0.05)
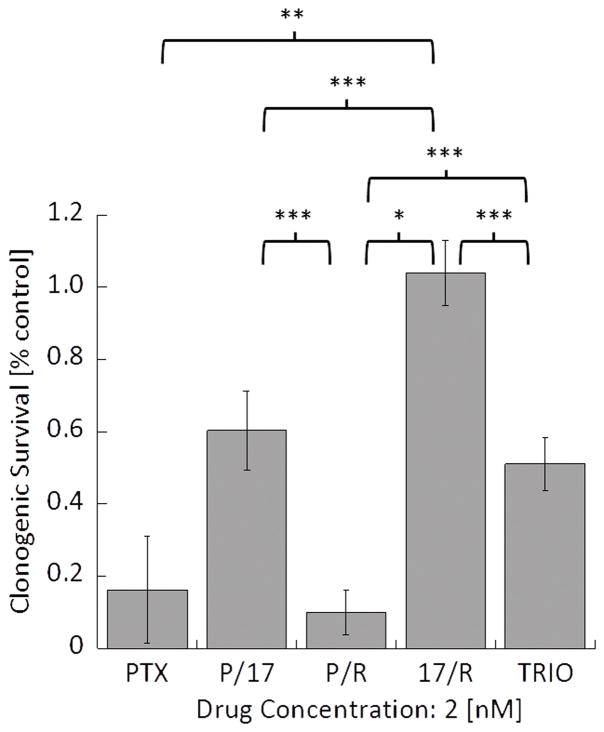
Subsequently, the effects of drug combinations on clonogenic survival of A549 cells were evaluated by using single (PTX) and dual (P/17, P/R, and 17/R) loaded PEG-b-PLA micelles as well as Triolimus (TRIO) at a fixed concentration of 2 nM (Fig. 2A). Interestingly, the most effective drug combination that inhibited clonogenic survival was P/R, followed by PTX, TRIO, P/17, and 17/R with the following clonogenic survival rate:0.10±0.06, 0.16±0.15, 0.51±0.07, 0.60±0.11, and 1.04±0.09, respectively. A similar trend was observed in radiosensitization studies (Fig.2B). A549 cells were especially susceptible to P/R treatment with 8 Gy of ionizing radiation. However, the SER value revealed that the strongest radiosensitizing effect was obtained by treatment with PTX (3.34), followed by P/R (2.95), TRIO (2.23), P/17 (1.62), and 17/R (1.44). 17-AAG and RAP had radiosensitizing effects at 5 nM in our preliminary study, with 17-AAG being the more effective radiosensitizer (data not shown). In contrast, when RAP or 17-AAG were treated in combination with PTX, the combination of PTX and RAP was more potent than PTX with 17-AAG. Moreover, 17/R did not significantly inhibit clonogenic survival of A549 cells, and was the least radiosensitizing therapy examined.
Fig. 2.
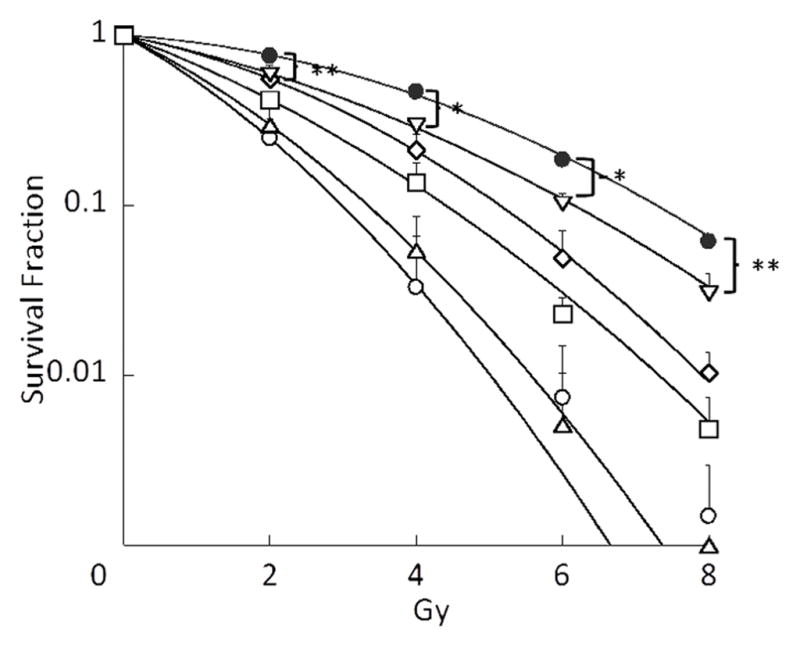
Fig. 2A: Effect of PTX alone, dual drug combinations, and Triolimus at 2 nM on A549 clonogenic survival (*: P<0.001, **: P<0.01, ***: P<0.05)
Fig. 2B: Effects of PTX alone, dual drug combinations, and Triolimus on radiosensitivity at 2 nM (black circle: no treatment, open circle: PTX, open square: Triolimus, open diamond: P/17, open triangle: P/R, open inverse triangle: 17/R (*: P<0.01, **: P<0.05)
3.3. Antitumor efficacy in vivo
Figure 3 shows the effect of PTX with or without radiation on tumor growth in an A549 xenograft model. Compared to the vehicle control group, radiation alone and PTX alone slightly inhibited tumor growth. PTX combined with radiation treatment further delayed tumor growth. This result corresponds to a previous report describing the radiosensitizing effects of Genexol-PM [12].
Fig. 3.
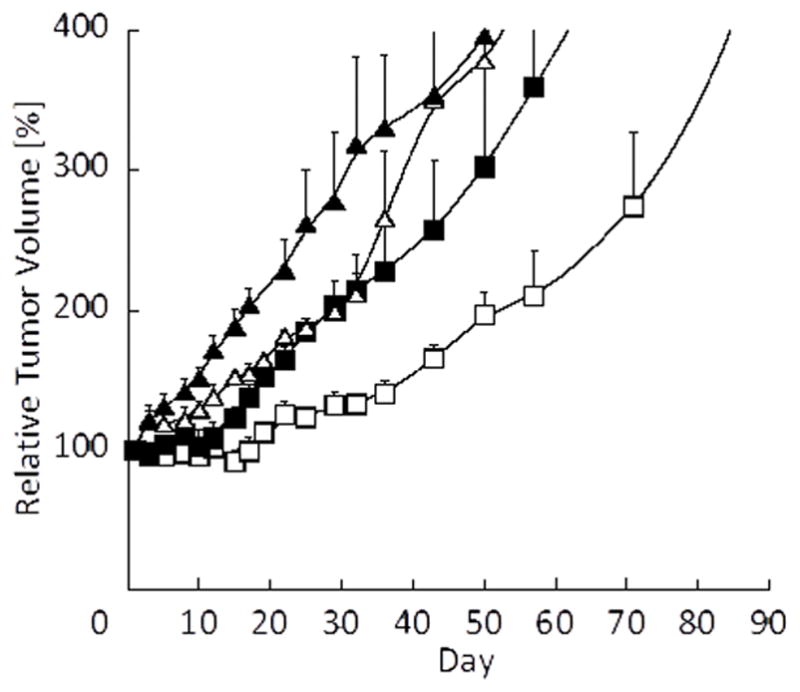
Effect of PTX-loaded PEG-b-PLA micelles (60 mg/kg) and radiation on tumor growth in an A549 xenograft mouse model (black triangle: Vehicle, open triangle: Vehicle + XRT, black square: PTX, open square: PTX + XRT, N=4).
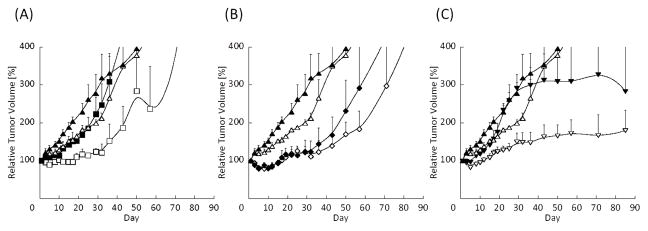
Figure 4A shows the effect of P/17 with or without radiation on A549 tumor growth. Although P/17 combined with radiation enhanced tumor growth delay, its radiosensitizing effect was less potent than the combination of PTX and radiation. We hypothesized that an Hsp 90 inhibitor would potentiate apoptosis induced by G2/M arrest and radiation. However, according to our results, this combination was not particularly effective for radiosensitization. P/R with radiation treatment was also more potent than P/17 combined with radiation (Fig. 4B). Without radiation, P/R treatment itself also suppressed tumor growth. However, compared to PTX with radiation treatment, the combination with RAP did not prolong the tumor growth delay. In contrast, 17/R with radiation treatment dramatically inhibited tumor growth (Fig. 4C), despite in vitro study results showing less effective radiosensitization than other single, dual and Triolimus treatment (Fig. 2B, Table 2).
Fig. 4.
Fig. 4(A): Effect of P/17-loaded PEG-b-PLA micelles (60/60 mg/kg) and radiation on tumor growth in an A549 xenograft mouse model (black triangle: Vehicle, open triangle: Vehicle + XRT, black square: P/17, open square: P/17 + XRT, N=4)
Fig. 4(B): Effect of P/R-loaded PEG-b-PLA micelles (60/30 mg/kg) and radiation on tumor growth in an A549 xenograft mouse model (black triangle: Vehicle, open triangle: Vehicle + XRT, black diamond: P/R, open diamond: P/R + XRT, N=4).
Fig. 4(C): Effect of 17/R-loaded PEG-b-PLA micelles (60/30 mg/kg) and radiation on tumor growth in an A549 xenograft mouse model (black triangle: Vehicle, open triangle: Vehicle + XRT, black inverse triangle: 17/R, open inverse triangle: 17/R + XRT, N=4).
Table 2.
Molar ratio of drugs at a concentration of 2 nM and the SER values of each micelle
| Drug | [nM]
|
|||
|---|---|---|---|---|
| PTX | 17-AAG | RAP | SER | |
| Triolimus | 0.7 | 1.0 | 0.3 | 2.23 |
| PTX | 2.0 | 3.34 | ||
| PTX/17AAG | 0.8 | 1.2 | 1.62 | |
| PTX/RAP | 1.4 | 0.6 | 2.95 | |
| 17AAG/RAP | 1.5 | 0.5 | 1.44 | |
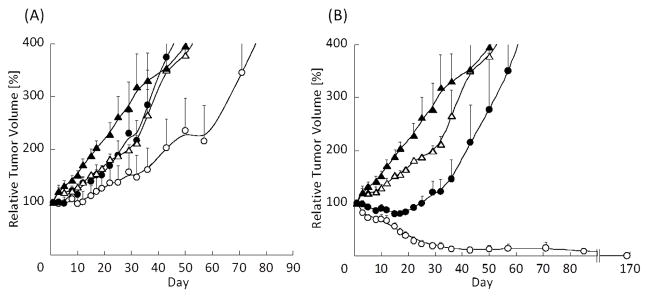
Figure 5A shows the effect of Int. TRIO (15/15/7.5 mg/kg of PTX, 17-AAG, and RAP, respectively) with or without radiation on tumor growth delay in the A549 xenograft model. Triolimus combined with radiation treatment augmented tumor growth delay. Interestingly, delay of tumor growth was observed at a very low dose, with an effect similar to P/17 with radiation. High TRIO (60/60/30 mg/kg of PTX, 17-AAG, and RAP, respectively) with radiation treatment led to tumor control (Fig. 5B). This tumor control lasted for up to 24 weeks, during which time no local recurrences were observed. Thus, High TRIO was confirmed to be a potent radiosensitizer in vivo.
Fig. 5.
Fig. 5(A): Effect of Triolimus (P/17/R=15/15/7.5 mg/kg) and radiation on tumor growth in an A549 xenograft mouse model (black triangle: Vehicle, open triangle: Vehicle + XRT, black circle: Triolimus, open circle: Triolimus + XRT, N=4).
Fig. 5(B): Effect of Triolimus (P/17/R=60/60/30 mg/kg) and radiation on tumor growth in an A549 xenograft mouse model (black triangle: Vehicle, open triangle: Vehicle + XRT, black circle: Triolimus, open circle: Triolimus + XRT, N=4).
3.4. Histologic and immunohistochemical analysis of tumor growth
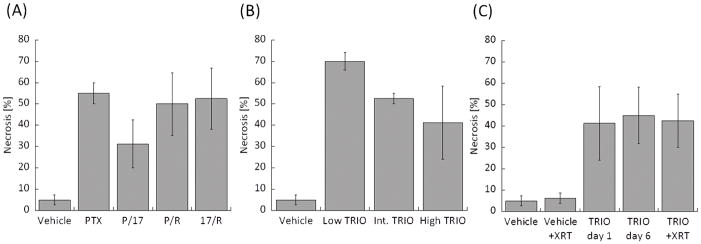
The percent of tumor necrosis is shown in Fig. 6. For single and dual drug treated groups, the amount of necrosis was similar between PTX, P/R and 17/R. Compared to those three treatments, relatively less necrosis was observed in the P/17 treated group (Fig. 6A). Percent necrosis decreased with increasing drug concentrations in the Triolimus group (Fig. 6B). The addition of radiation in the TRIO + XRT treatment group did not increase the amount of necrosis (Fig. 6C). Necrosis was augmented in the Triolimus treatment group; this effect was sustained for 6 days. The level of necrosis was similar between TRIO day 6 and TRIO + XRT, suggesting that the induction of necrosis is caused by Triolimus administration.
Fig. 6.
Ratio of necrosis in tumors treated by (A) single or dual drug combinations, (B) Triolimus, (C) Triolimus followed by XRT.
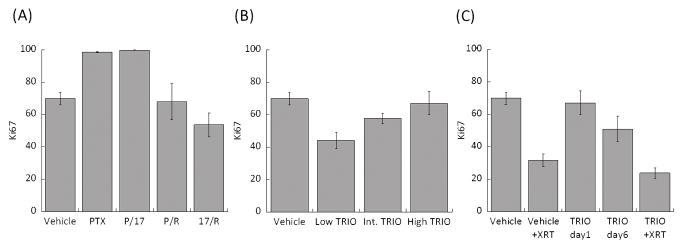
Ki-67 proliferative index of single drug, dual drug, and Triolimus treatment groups are shown in Fig. 7. PTX and P/17 treatments enhanced tumor proliferation. Both P/R and 17/R treatment led to Ki-67 indices similar to vehicle treatment. Results from the Triolimus treatment group indicate that lower drug concentrations exert a more effective antiproliferative effect (Fig. 7B). A dramatic reduction in Ki-67 index was observed from the vehicle + XRT treated group (Fig. 7C). TRIO group did not induce antiproliferative effect on day one; however, Ki-67 values on day six were relatively low. Thus, it appears that the antiproliferative effects of high dose Triolimus treatment are not immediate but occur over time. The lowest Ki-67 values were observed in the TRIO + XRT group (Fig. 7C) indicating that the combination of Triolimus and radiation potently inhibits tumor cell proliferation.
Fig. 7.
Enumerated Ki-67 in tumor treated by (A) single or dual drug combination, (B) Triolimus, (C) Triolimus followed by XRT.
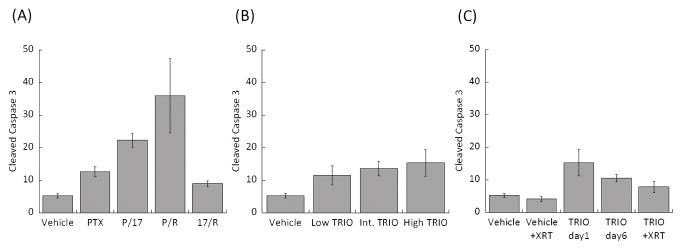
Levels of cleaved caspase 3 as a measure of apoptosis are shown in Fig. 8. The greatest cleaved caspase 3 levels were observed in the P/R treatment group. Although Triolimus (Fig. 8B) and TRIO + XRT treatment (Fig. 8C) slightly augmented the level of cleaved caspase 3, these effects were much less than the effect of P/R treatment.
Fig. 8.
Enumerated cleaved caspase-3 in tumor treated by (A) single or dual drug combinations, (B) Triolimus, (C) Triolimus followed by XRT.
Immunohistochemical staining for AKT, phosphorylated AKT (pAKT) and HSP70 was performed with the appropriate controls. The results were marginally different between the treatment groups, suggesting that the individual differences in protein expression might be below the resolution of qualitative immunohistochemistry. Moderate, diffuse expression of AKT was seen in the vehicle groups as well as in PTX, Low TRIO, Int. TRIO, High TRIO, TRIO + XRT, and TRIO day 6 tumors (Table 3). Interestingly in P/17, P/R, and 17/R, AKT expression was mostly weak. Expression of pAKT was essentially negative in 17/R groups and variably focal in other treatment groups without significant individual differences. HSP70 showed strong diffuse immunostaining in all groups (data not shown).
Table 3.
Expression of AKT and pAKT in treatment group (positive/total cases). Mod=moderate.
| Study group | AKT | pAKT |
|---|---|---|
| Vehicle | 8/8, diffuse mod | 7/8, weak(5), mod(2) |
| PTX | 4/4 diffuse, mod | 0/4 |
| P/17 | 4/4 diffuse, weak | 4/4 focal weak(3), mod(1) |
| P/R | 4/4 diffuse weak(3), mod(1) | 4/4 focal weak(3), mod(1) |
| 17/R | 4/4 diffuse weak(3), mod(1) | 0/4 |
| Low TRIO | 4/4 diffuse, mod | 3/4 focal mod(1), weak(2) |
| Int. TRIO | 4/4 diffuse, mod | 4/4 focal mod(3), weak(1) |
| High TRIO | 4/4 diffuse, mod | 2/4 focal mod(1), weak(1) |
| TRIO day 6 | 4/4 diffuse, mod | 3/4 focal mod |
| Vehicle + XRT | 4/4 diffuse mod(2), strong(2) | 2/4 focal mod |
| TRIO + XRT | 4/4 diffuse, mod | 3/4 focal mod(2), weak(1) |
3. 5. Hematologic, metabolic and histologic assessment of drug toxicity
Histologic sections of mouse heart, lungs, liver, spleen, kidneys and brain were examined under a light microscope to morphologically assess organ toxicity. Most tissues revealed no significant pathologic abnormalities. There was very focal mild lymphocytic interstitial inflammation in the lungs of six animals (two in the Vehicle group, one in the Int. TRIO group, two in the Low TRIO group and one in the P/17 group). Twenty-three animals showed minimal non-specific periportal chronic inflammation, including six animals in the Vehicle group and two in the Vehicle + XRT group. These changes are of uncertain significance but given that they are minimal and present in a large number of control animals, they are unlikely to be treatment related.
Comprehensive metabolic and hematologic analyses following dosing with Vehicle, PTX, dual drug combinations, TRIO, and TRIO + XRT are summarized in Table 4. In contrast to the previous report [10], PTX treatment significantly reduced white blood cell counts. Statistically significant reduction in hemoglobin was observed in Int. TRIO group. Statistically significant reductions in white blood cell count were observed in Low TRIO and P/R treatment groups. Moreover, statistically significant reductions in red blood cell count were also observed in P/R treatment group. Statistically significant reductions in white blood cell count were seen in TRIO + XRT and Vehicle + XRT groups. However, this effect was no longer evident in the TRIO group on day six. This suggests that the marked reduction of white blood cell count is likely caused by radiation. The effects on red blood cells also appear to be mainly caused by radiation since statistically significant reductions in red blood cell counts, hemoglobin, and hematocrit were observed in the Vehicle + XRT treatment group. Slight reductions in red blood cell count, hemoglobin and hematocrit were also observed in the TRIO + XRT treatment group indicating that the adverse effect of radiation was not increased by combining it with Triolimus. Kidney finction was assessed by measurements of plasma electrolytes, creatinine and blood urea nitrogen. Almost all treatment groups except P/17 and 17/R had statistically significant increases in urea nitrogen. Significant differences in creatinine levels were not observed in any treatment group. Also, some of electrolyte levels were statistically increased after drug or XRT treatment, specifically sodium levels in both P/17 and 17/R treated groups and chloride levels in the P/R treated group. These results suggest that drug and/or XRT treatment may slightly perturb renal function or may result in slight dehydration.
Table 4.
Hematological analysis of drug and radiation treated mice
| High TRIO | Int. TRIO | Low TRIO | Vehicle | PTX | P/17 | P/R | 17/R | TRIO+XRT | Vehicle+XRT | TRIO Day6 | |
|---|---|---|---|---|---|---|---|---|---|---|---|
| RBC [106/μL] | 8.8±0.2 | 8.3±0.3 | 8.5±0.1 | 8.7±0.2 | 8.4±0.1 | 8.0±0.3 | 8.0±0.1*** | 8.4±0.3 | 8.5±0.4 | 7.9±0.2*** | 8.3±0.4 |
| HGB [g/dL] | 14.7±0.4 | 13.9±0.3*** | 14.2±0.2 | 15.3±0.5 | 14.9±0.2 | 14±1 | 14.1±0.1 | 14.5±0.5 | 11±3 | 13.3±0.3*** | 13.9±0.4 |
| HCT [%] | 43±1 | 42±1 | 42±1 | 45±1 | 43±1 | 42±2 | 41.8±0.3 | 44±1 | 42±2 | 39±1** | 42±1 |
| PLATELET [103/μL] | 960±50 | 1049±45 | 1146±92 | 643±194 | 902±122 | 702±158 | 755±83 | 1153±109 | 765±61 | 1030±108 | 1428±3 |
| WBC [103/μL] | 5.3±0.5 | 9.4±3.3 | 8.0±0.9*** | 4.5±0.6 | 2.7±0.2*** | 3.5±0.9 | 2.1±0.2** | 6.7±0.9 | 0.8±0.0** | 0.8±0.0*** | 5.8±1.6 |
| Sodium [mmol/L] | 145±1 | 150±0 | 146±1 | 146±1 | 143±1 | 142±0.3*** | 144±1 | 140±1** | 146±1 | 146±1 | 148±1 |
| Potassium [mmol/L] | 3.8±0.3 | 3.6±0.3 | 3.2±0.3 | 3.6±0.1 | 3.6±0.1 | 3.9±0.3 | 3.6±0.1 | 3.7±0.3 | 4.0±0.2 | 4.0±0.3 | 3.7±0.1 |
| Chloride [mmol/L] | 112±1 | 112±0 | 113±1 | 114±1 | 116±1 | 114±1 | 118±1** | 113±1 | 113±1 | 114±0 | 115±0.4 |
| Total CO2 [mmol/L] | 17±1 | 18±1*** | 16±1 | 15±1 | 12.3±0.3*** | 13±1 | 11±1*** | 14.0±0.4 | 17±3 | 12.5±0.5*** | 10±1* |
| Anion Gap | 20±1 | 19±1 | 20±2 | 21±2 | 18.7±0.3 | 18±2 | 19.0±0.4 | 17±1 | 20±2 | 24±1 | 26±1*** |
| Calcium [mg/dL] | 9.5±0.1** | 9.0±0.1 | 9.0±0.1 | 8.9±0.0 | 9.4±0.0* | 9.4±0.1*** | 8.9±0.1 | 9.4±0.2 | 9.2±0.1 | 8.4±0.2*** | 8.8±0.1 |
| Phosphorus [mg/dL] | 6.4±0.8 | 6.0±0.4 | 5.2±1.1 | 9.2±1.7 | 8.4±0.4 | 8.1±0.8 | 8.0±0.7 | 6.7±0.3 | 6.7±0.4 | 6.4±0.3 | 7.1±0.6 |
| Magnesium [mg/dL] | 2.1±0.1 | 2.5±0.1 | 2.3±0.1 | 2.2±0.1 | 2.3±0.1 | 2.3±0.1 | 2.3±0.0 | 1.9±0.1 | 2.2±0.1 | 2.3±0.1 | 2.3±0.1 |
| Glucose [mg/dL] | 200±16 | 183±3 | 197±10 | 149±33 | 173±12 | 199±14 | 175±11 | 194±12 | 170±18 | 165±17 | 187±20 |
| Urea Nitrogen [mg/dL] | 22±1* | 25±1* | 22±1* | 15.3±0.3 | 23±2*** | 17±2 | 24±1* | 17±1 | 17.7±0.3** | 25±2*** | 20.3±0.6* |
| Creatinine [mg/dL] | 0.3±0.0 | 0.2±0.0 | 0.2±0.0 | 0.2±0.0 | 0.2±0.0 | 0.2±0.0 | 0.2±0.0 | 0.2±0.0 | 0.3±0.0 | 0.2±0.0 | 0.2±0.0 |
| Total Protein [g/dL] | 4.5±0.1*** | 4.3±0.1 | 4.5±0.1*** | 4.2±0.1 | 4.4±0.1 | 4.2±0.2 | 4.1±0.1 | 4.3±0.1 | 4.8±0.2*** | 4.2±0.1 | 4.4±0.1 |
| Albumin [g/dL] | 2.1±0.1 | 2.0±0.0 | 2.1±0 | 2.0±0.0 | 2.1±0.1 | 2.1±0.1 | 2.0±0.1 | 2.1±0.0 | 2.1±0.1 | 2.0±0.1 | 2.0±0.1 |
| Globulin [g/dL] | 2.4±0.1 | 2.3±0.1 | 2.4±0.1 | 2.2±0.1 | 2.3±0.1 | 2.1±0.1 | 2.1±0.1 | 2.2±0.0 | 2.8±0.1*** | 2.2±0.1 | 2.4±0.1 |
| AST [U/L] | 137±10*** | 170±31*** | 86±5 | 88±12 | 97±7 | 113±5 | 97±18 | 90±14 | 125±26 | 86±20 | 58±6 |
| ALT [U/L] | 51±3 | 50±5 | 43±2 | 46±1 | 50±2 | 55±3 | 52±3 | 45±1 | 42±3 | 45±4 | 38±1* |
| Alkaline Phosphatase [U/L] | 74±8 | 62±7 | 75±11 | 63±4 | 68±9 | 80±10 | 71±7 | 66±4 | 60±2 | 84±8 | 67±3 |
| Total Bilirubin [mg/dL] | N.D. | N.D. | N.D. | N.D. | N.D. | N.D. | N.D. | N.D. | N.D. | N.D. | N.D. |
| Cholesterol [mg/dL] | 86±5 | 87±5 | 92±4*** | 78±4 | 111±4*** | 91±10 | 88±4 | 101±1* | 126±9** | 73±1 | 96±6 |
| Triglycerides [mg/dL] | 98±18 | 117±9 | 105±18 | 93±3 | 181±32 | 82±5 | 121±4* | 128±16 | 202±46 | 99±14 | 189±44 |
:Significantly different from vehicle group (P<0.005)
: Significantly different from vehicle group (P<0.01)
:Significantly different from vehicle group (P<0.05)
RBC: Red blood cell count, HGB: Hemoglobin, HCT: Hematocrit, WBC: White blood cell count
Liver function was assessed by measuring glucose, total protein, albumin, globulin, AST, ALT, alkaline phosphatase, and total bilirubin levels. No significant differences were observed in glucose, albumin, ALT, or alkaline phosphatase levels in any group. Total bilirubin was undetectable in each sample. However, total protein level in High TRIO, Low TRIO, and TRIO + XRT treatment groups, globulin level in the TRIO + XRT treatment group, and AST levels in High TRIO and Int. TRIO treatment groups were significantly increased. Thus, it appears that Triolimus with or without XRT treatment may impact liver function.
Significantly increased calcium levels in High TRIO, PTX, and P/17 treated groups were noted. The significance of hypercalcemia in this setting is uncertain and requires further investigation.
Significant difference of total CO2 level in Int. TRIO, PTX, P/R, Vehicle + XRT, and TRIO day 6 treatment group, and anion gap in TRIO day 6 group were also noted, potentially suggesting altered pulmonary function.
Statistically significant alterations in plasma glucose levels were not observed. Cholesterol levels significantly increased in Low TRIO, PTX, 17/R, and TRIO + XRT treated groups. Triglyceride levels in the P/R treatment group were significantly increased.
4. DISCUSSION
The radiosensitizing effects of Triolimus, PEG-b-PLA micelles containing PTX, 17AAG, and RAP were evaluated in this study. Multi-drug loaded PEG-b-PLA micelles were prepared by a simple freeze-drying method [20]. In general, polymeric micelles are prepared by solvent evaporation methods [8–10]. The conventional method requires preparation of polymeric micelles at every point of use, whereas freeze-drying allows for simple manufacture, long-term storage, and straightforward preparation when necessary. Drug loading analysis evidenced that PTX, 17AAG, and RAP were successfully encapsulated in PEG-b-PLA micelles individually or in combination. Loading multiple drugs did not significantly affect the particle size or PDI of PEG-b-PLA micelles. Although multiple drug loading is expected to cause competition at encapsulation sites within the core of polymeric micelles, corresponding to previous reports, nearly 100% loading efficiency of each drug was achieved in Triolimus [8, 9]. Whereas PTX alone-loaded PEG-b-PLA micelles precipitated 6 hours after rehydration in physiological saline, Triolimus and dual drug-loaded PEG-b-PLA micelles did not precipitate at room temperature up to 24 hours after reconstitution. This result suggests that multiple drug loading introduces an interaction that allows for stabilization within the micellar core [8]. Thus, Triolimus prepared by lyophilization is ideal for preclinical and clinical studies due to simple preparation and stability of physicochemical properties, i.e. particle size, PDI, and drug loading ratio.
Triolimus inhibited clonogenic survival of A549 cells in a dose-dependent manner. Triolimus effectively inhibited clonogenic survival, even at concentrations as low as 2 nM (Fig.1A). However, both PTX and P/R treatments had an even greater inhibitory effect on clonogenic survival and radiosensitization at 2 nM (Fig. 2A, 2B). Comparing P/R and 17/R, the SER value of P/R was more than 2 times higher than that of 17/R, despite the similar molar ratio of RAP in each formulation. Thus, the radiosensitizing effect of PTX seems to be much higher than that of 17-AAG. Similarly, between PTX and P/R, the radiosensitization effect of PTX alone seems to be greater than that of P/R treatment. These observations are entirely consistent with the well established clinical efficacy of paclitaxel in combination with radiation therapy. Comparing Triolimus and P/17, the addition of RAP to PTX and 17-AAG in Triolimus greatly enhanced its radiosensitizing potency despite a slight decrease in PTX and 17-AAG molar ratios. In Triolimus, the radiosensitizing effects of these three drugs appear to achieve synergy in vitro.
The fact that PTX + XRT treatment delayed tumor growth confirms a previous report on Genexol-PM + XRT. The radiosensitizing effect of PTX loaded PEG-b-PLA micelles was substantial. Dual drug combinations P/17 and P/R + XRT had a similar tumor growth delay effect (Fig. 4A, 4B). Int. TRIO (PTX/17-AAG/RAP: 15/15/7.5 mg/kg) + XRT treatment prolonged tumor growth relative to Vehicle control group to a lesser extent than PTX + XRT (Fig.5A). However, High TRIO (PTX/17-AAG/RAP: 60/60/30 mg/kg) + XRT treatment greatly reduced tumor growth, an effect that lasted up to 24 weeks (Fig.5B).
Previous research suggested that dual or triple drug loading PEG-b-PLA micelles induces prolonged drug release compared to each single drug loaded PEG-b-PLA micelles in vitro, probably due to drug-drug interaction and stabilization in the core of micelle [8]. Moreover, an in vivo pharmacokinetic study confirmed that dual drug loading of PTX and 17-AAG or 17-AAG and RAP or Triolimus increases plasma concentration of PTX or RAP compared to single drug administration. Also 17-AAG metabolism was suppressed by dual administration with RAP, probably due to competition of CYP3A4-mediated metabolism of 17-AAG and RAP [9]. These factors likely potentiate drug accumulation at tumors and augment radiosensitizing effects.
The mechanisms underlying the tumor control observed with High TRIO and radiation were explored immunohistochemically. Single drug, dual drug, and Triolimus treatment results in significant tumor necrosis in vivo (Fig 6A, B). Although radiation alone, at the doses employed, did not increase tumor necrosis, the combination of radiation and Triolimus maintained the pro-therapeutic effects of drug treatment on enhanced tumor necrosis (Fig 6C). In contrast to necrosis, drug treatment appeared to have a very modest impact on tumor cell proliferation judged by Ki-67 indices (Fig 7A, B). In fact, paclitaxel and the P/17 combination appeared to increase tumor cell proliferation (Fig 7A). In contrast to drug treatment, radiation therapy profoundly inhibited tumor cell proliferation (Fig 7C). Here again, the combination of radiation and Triolimus maintained the pro-therapeutic impact of radiation on cancer cell proliferation. Taken together, these observations suggest the combination of Triolimus and radiation appears to result in the favorable tumor necrosis observed with drug treatment alone and the favorable anti-proliferative effects of radiation alone. This pro-therapeutic duality may underpin the observed in vivo efficacy of High TRIO plus radiation.
Myelosuppression, a dose-limiting toxicity of taxanes, was observed in PTX and P/R treated groups. However, significant myelosuppression was not observed in the Triolimus treated group. This may be attributable to the stability of drug-loaded polymeric micelles. PTX precipitated from PEG-b-PLA micelles a mere six hours after preparation, while no precipitation was observed in Triolimus samples after 24 hours. The release of PTX from Triolimus follows first-order kinetics [8]. Thus, the gradual release of PTX and the stability of Triolimus might minimize myelosuppression and contribute to accumulation at the tumor site via the EPR effect. XRT treatment dramatically decreased white blood cell counts. In this study, myelosuppression was not enhanced by the addition of Triolimus to XRT.
Analysis of body chemistries demonstrated, unsurprisingly, that Triolimus treatment affects normal organ function. However, in general these alterations were comparable to PTX alone and dual drug treated groups. Previous pharmacokinetic study confirmed that AUC of each drug increased by dual drug or Triolimus administration, while no significant difference in terms of MRT and t1/2 compared to single drug administration were observed [9]. Thus, Triolimus treatment would not augment toxicity of incorporated drug. Moreover, testing the TRIO group on day six revealed that changes in body chemistries and complete blood counts were short-lived; all values except those for CO2, anion gap and urea nitrogen were not significantly different from those in the vehicle treated group. A previous study revealed no significant metabolic toxicity in renal or liver function 11 days after the first injection of Triolimus injected on day 0, 4, and 8 [10].
A single injection of Triolimus followed by a short fractionated radiation course (3 Gy qd × 5d), induced dramatic tumor regression. As with all radiosensitizing cytotoxins the addition of Triolimus to radiation may also enhance toxicity. The data presented here highlight a promising therapeutic index and strongly suggest further investigations of Triolimus as a radiosensitizer are merited.
CONCLUSION
A simple freeze drying method permits preparation of Triolimus with high drug loading ratio. The promise of Triolimus as a novel radiosensitizer was demonstrated in this study both in vitro and in vivo. Although further studies are required to clarify mechanisms of radiosensitization, combined modality therapies incorporating radiation therapy and Triolimus may prove useful regimens for cancer treatment.
References
- 1.Cho H, Lai TC, Tomoda K, Kwon GS. AAPS PharmSciTech. 2015;16(1):10. doi: 10.1208/s12249-014-0251-3. [DOI] [PMC free article] [PubMed] [Google Scholar]
- 2.Mondesire WH, Jian W, Zhang H, Ensor J, Hung MC, Mills GB, Meric-Bernstam F. Clin Cancer Res. 2004;10:7031. doi: 10.1158/1078-0432.CCR-04-0361. [DOI] [PubMed] [Google Scholar]
- 3.VanderWeele DJ, Zhou R, Rudin CM. Mol Cancer Ther. 2004;3:1605. [PubMed] [Google Scholar]
- 4.Chandarlapaty S, Sawai A, Scaltriti M, Rodrik-Outmezguine V, Grbovic-Huezo O, Serra V, Majumder PK, Baselga J, Rosen N. Cancer Cell. 2001;19:58. doi: 10.1016/j.ccr.2010.10.031. [DOI] [PMC free article] [PubMed] [Google Scholar]
- 5.De Raedt T, Walton Z, Yecies JL, Li D, Chen Y, Malone CF, Maertens O, Jeong SM, Bronson RT, Lebleu V, Kalluri R, Normant E, Haigis MC, Manning BD, Wong KK, Macleod KF, Cichowski K. Cancer Cell. 2011;20:400. doi: 10.1016/j.ccr.2011.08.014. [DOI] [PMC free article] [PubMed] [Google Scholar]
- 6.Francis LK, Alsayed Y, Leleu X, Jia X, Singha UK, Anderson J, Timm M, Ngo H, Lu G, Huston A, Ehrlich LA, Dimmock E, Lentzsch S, Hideshima T, Roodman GD, Anderson KC, Ghobrial IM. Clin Cancer Res. 2006;12:6826. doi: 10.1158/1078-0432.CCR-06-1331. [DOI] [PubMed] [Google Scholar]
- 7.Roforth MM, Tan C. Anticancer Drugs. 2008;19:681. doi: 10.1097/CAD.0b013e3283067681. [DOI] [PubMed] [Google Scholar]
- 8.Shin HC, Alani AWG, Cho H, Bae Y, Kolesar JM, Kwon GS. Mol Pharmaceutics. 2011;8:1257. doi: 10.1021/mp2000549. [DOI] [PMC free article] [PubMed] [Google Scholar]
- 9.Shin HC, Cho H, Lai TC, Kozak KR, Kolesar JM, Kwon GS. J Control Release. 2012;163(1):93. doi: 10.1016/j.jconrel.2012.04.024. [DOI] [PMC free article] [PubMed] [Google Scholar]
- 10.Hasenstein JR, Shin HC, Kasmerchak K, Buehler D, Kwon GS, Kozak KR. Mol Cancer Ther. 2012;11(10):2233. doi: 10.1158/1535-7163.MCT-11-0987. [DOI] [PMC free article] [PubMed] [Google Scholar]
- 11.Jin C, Wu H, Liu J, Bai L, Guo G. J Clin Pharm Ther. 2007;32:41. doi: 10.1111/j.1365-2710.2007.00796.x. [DOI] [PubMed] [Google Scholar]
- 12.Werner ME, Cummings ND, Sethi M, Wang EC, Sukumar R, Moore DT, Wang AZ. Int J Radiat Oncol Biol Phys. 2013;86(3):463. doi: 10.1016/j.ijrobp.2013.02.009. http://dx.doi.org/10.1016/j.ijrobp.2013.02.009. [DOI] [PMC free article] [PubMed] [Google Scholar]
- 13.Kabakov AE, Makarova YM, Malyutina YV. Int J Radiat Oncol Biol Phys. 2008;71(3):858. doi: 10.1016/j.ijrobp.2008.02.034. [DOI] [PubMed] [Google Scholar]
- 14.Kim WY, Oh SH, Woo JK, Hong WK, Lee HY. Cancer Res. 2009;69(4):1624. doi: 10.1158/0008-5472.CAN-08-0505. [DOI] [PMC free article] [PubMed] [Google Scholar]
- 15.Enomoto A, Fukasawa T, Takamatsu N, Ito M, Morita A, Hosoi Y, Miyagawa K. Eur J Cancer. 49:3547. doi: 10.1016/j.ejca.2013.06.034. http://dx.doi.org/10.1016/j.ejca.2013.06.034. [DOI] [PubMed] [Google Scholar]
- 16.Camphausen K, Tofilon PJ. Clin Cancer Res. 2007;13:4326. doi: 10.1158/1078-0432.CCR-07-0632. [DOI] [PubMed] [Google Scholar]
- 17.Noguchi M, Yu D, Hirayama R, Ninomiya Y, Sekine E, Kubota N, Ando K, Okayasu R. Biochem Biophys Res Commun. 2006;351:658. doi: 10.1016/j.bbrc.2006.10.094. [DOI] [PubMed] [Google Scholar]
- 18.Nagata Y, Takahashi A, Ohnishi K, Ota I, Ohnishi T, Tojo T, Taniguchi S. Int J Oncol. 2010;37:1001. doi: 10.3892/ijo_00000751. [DOI] [PubMed] [Google Scholar]
- 19.Hayman TJ, Wahba A, Rath BH, Bae H, Kramp T, Shankavaram UT, Camphausen K, Tofilon PJ. Clin Cancer Res. 2014;20(1):110. doi: 10.1158/1078-0432.CCR-13-2136. [DOI] [PMC free article] [PubMed] [Google Scholar]
- 20.Fournier E, Dufresne MH, Smith DC, Ranger M, Leroux JC. Pharm Res. 2004;21(6):962. doi: 10.1023/b:pham.0000029284.40637.69. [DOI] [PubMed] [Google Scholar]
- 21.Franken NAP, Rodermond HM, Stap J, Haveman J, Bree Cv. Nat Protoc. 2006;1(5):2315. doi: 10.1038/nprot.2006.339. [DOI] [PubMed] [Google Scholar]
- 22.Tuominen VJ, Ruotoistenmäki S, Viitanen A, Jumppanen M, Isola J. Breast Cancer Res. 2010;12(4):R56. doi: 10.1186/bcr2615. [DOI] [PMC free article] [PubMed] [Google Scholar]


