Significance
Glutamate transporters play a crucial role for the recovery of the neurotransmitter glutamate from the synaptic cleft. Thus far, studies of the transport dynamics and detailed information of the working mechanism of this family of transmembrane proteins have been sparse and indirect. Here, we used high-speed atomic force microscopy (HS-AFM) to characterize the transport mechanisms and dynamics of a prokaryotic glutamate transporter homolog GltPh in lipid membranes. We assess transport dynamics as a function of substrate in the imaging buffer and provide direct visual evidence that GltPh transport domains within the trimer are entirely independent.
Keywords: GltPh, HS-AFM, transporter, elevator mechanism, dynamics
Abstract
Glutamate transporters are essential for recovery of the neurotransmitter glutamate from the synaptic cleft. Crystal structures in the outward- and inward-facing conformations of a glutamate transporter homolog from archaebacterium Pyrococcus horikoshii, sodium/aspartate symporter GltPh, suggested the molecular basis of the transporter cycle. However, dynamic studies of the transport mechanism have been sparse and indirect. Here we present high-speed atomic force microscopy (HS-AFM) observations of membrane-reconstituted GltPh at work. HS-AFM movies provide unprecedented real-space and real-time visualization of the transport dynamics. Our results show transport mediated by large amplitude 1.85-nm “elevator” movements of the transport domains consistent with previous crystallographic and spectroscopic studies. Elevator dynamics occur in the absence and presence of sodium ions and aspartate, but stall in sodium alone, providing a direct visualization of the ion and substrate symport mechanism. We show unambiguously that individual protomers within the trimeric transporter function fully independently.
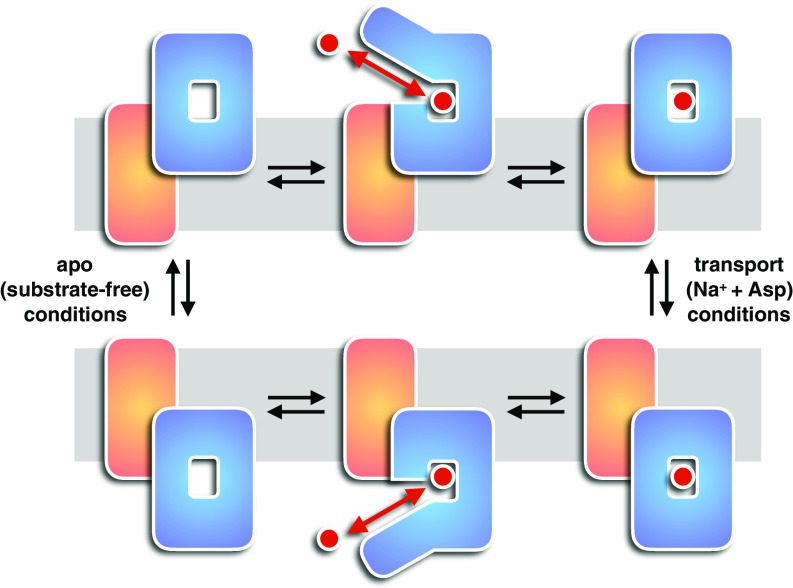
Glutamate transporters have been intensely studied, leading to elucidation of their localization, function, and structure (1–3). The major role of these transporters is to keep glutamate concentrations in the synaptic cleft below excitotoxic levels (4), and their dysfunction in the central nervous system is associated with many neurological diseases, such as epilepsy, Alzheimer’s disease, and amyotrophic lateral sclerosis (5). The crystal structures of GltPh (6, 7) provided a breakthrough in the understanding of the ion-coupled transport mechanism. The transporter forms a bowl-shaped homotrimer, in which each protomer constitutes a rigid central trimerization domain [transmembrane segments (TMs) 1, 2, 4, 5] and a peripheral transport domain (TMs 3, 6, 7, and 8, and helical hairpins 1 and 2). Aspartate (Asp) is cotransported with three sodium (Na+) ions across the cell membrane upon a global conformational change between outward- and inward-facing states (6, 8–12). In contrast to other transporters that work by the rocker-switch (13) or the gated-pore (14) mechanisms, GltPh mediates transport by an elevator (6) mechanism in which the transport domain travels nearly 2 nm across the membrane (reviewed in ref. 15) (Fig. S1). Single-molecule FRET (sm-FRET) experiments revealed GltPh transport dynamics in detergent and tethered vesicles (8, 16, 17). However, direct visualization of GltPh elevator transport mechanism remained elusive.
Fig. S1.
Schematic representation of GltPh transport cycle. GltPh is schematized as a single transport domain (blue) that visits the extracellular space (Upper) and the cytoplasm (Lower) and a static trimerization domain (orange) that is anchored in the membrane plane (gray). Substrate (red) can be bound and released on both sides of the membrane (red arrow). The elevator domain movement across the membrane occurs reversibly in apo (substrate-free) and transport (Na+ + Asp) conditions (adapted from ref. 15).
Results
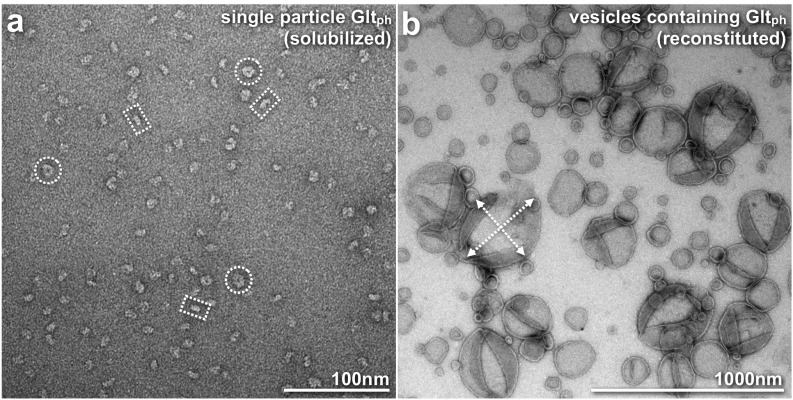
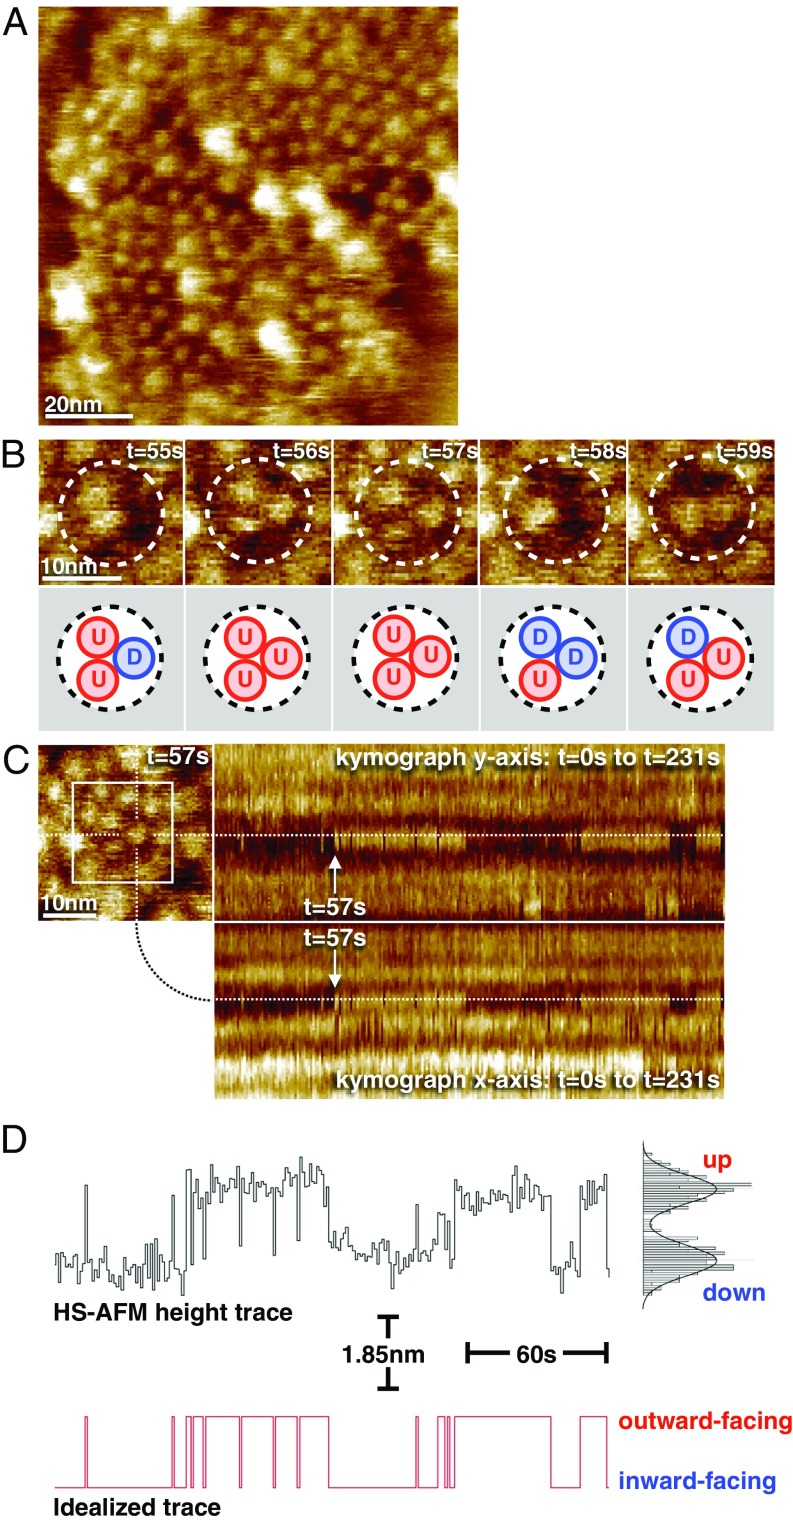
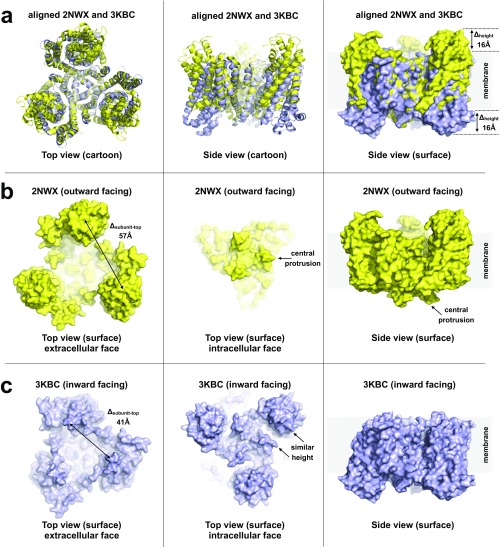
High-speed atomic force microscopy (HS-AFM) (18) is advantageous because it probes membrane proteins in native-like lipid membranes. Thus, purified GltPh was reconstituted into lipid mixtures yielding densely packed vesicles with diameter of up to 500 nm (Fig. S2), which opened on the HS-AFM support. First imaged under substrate-free (apo) conditions, the GltPh trimers were well discernible in the membrane (Fig. 1A and Movies S1 and S2). The protomers formed protrusions of ∼2 nm in diameter and 2 nm in height with their centers separated by ∼5.5 nm. The protrusions formed triangles with a cavity at the threefold symmetry axis. These features are in agreement with the expected molecular surface of GltPh with individual transport domains exposing their extracellular sides toward the HS-AFM tip (Fig. S3 A and B). The transport domains reversibly assumed two well-distinguishable conformations: outward facing (up, U) and inward facing (down, D) (Fig. 1B). The trimeric structure of the transporter was only discernible to the eye in frames where all three subunits were in the outward-facing (up) state with the transport domains protruding sharply from the membrane plane (Fig. 1A, many molecules; Fig. 1B, t = 56 s, t = 57 s).
Fig. S2.
Reconstitution of GltPh in large, densely packed vesicles. (A) Before reconstitution, the homogeneity of the solubilized GltPh sample was checked by negative-stain EM single-particle imaging. Molecules were found nicely dispersed and of homogeneous size, slightly less than 10 nm. No protein aggregates were found in the sample. The particles in the images display various shapes that are interpreted based on the high-resolution crystal structure of GltPh protein (PDB ID code 2NWX): doughnut-shaped molecules (dashed circles) are interpreted as top views, and bean-shaped molecules (dashed rectangles) as side views of the GltPh trimer, respectively. (B) During reconstitution, the solubilized protein was mixed with solubilized lipids at low lipid-to-protein ratios followed by detergent removal using biobeads. Large, ∼500 nm in diameter, vesicles (dashed arrows) were highly contrasted in electron micrographs following standard negative-staining procedures, indicating dense packing with membrane proteins. Furthermore, no single molecules remained in the background of the image, providing further indication of successful GltPh reconstitution.
Fig. 1.
Direct visualization of GltPh elevator domain movements by HS-AFM. (A) A frame from a typical HS-AFM movie of a membrane containing densely packed GltPh trimers. Full color scale is 8 nm. (B) Sequential frames displaying the conformational dynamics of a GltPh trimer under substrate-free (apo) conditions. The trimer structure is only discernible to the eye in frames where all three subunits are outward facing (U, t = 56 s, t = 57 s). (C, Upper Left) Frame t = 57 s from image series shown in B (white square). (C, Right) Kymographs of the Y (Upper) and X (Lower) section profiles across a transport domain (dashed lines). Transition from down to up position at approximately t = 57 s is highlighted in the kymographs. Full color scale in B and C is 3 nm. (D, Upper) Height trace (average from the X and Y kymographs) as a function of time, and height value distribution histogram (Right). (D, Lower) Idealized trace following assignment of up and down states to outward- and inward-facing GltPh elevator domain conformations, respectively.
Fig. S3.
Analysis of key structural features of and conformational changes between the high-resolution structures of the outward- and inward-facing states. (A) Superposition of the crystal structures of the symmetric outward-facing (PDB ID code 2NWX, yellow) and inward-facing (PDB ID code 3KBC, blue) states of GltPh. Part of the static central scaffold domain (residues 152–199) was used for alignment. These regions (576 atoms) aligned in four cycles to a rms of 0.5 Å using PyMol. (Left and Center) Cartoon representation of the aligned structures viewed from the extracellular face and in the membrane plane, respectively. (Right) Surface representation of the superposed structures; the elevator domains are significantly shifted (∼16 Å) in the direction normal to the membrane plane as measured on the positions of the most outward- and inward-facing residues N378 and S295. (B) Outward-facing structure (PDB ID code 2NWX) viewed from the extracellular space (Left). The three elevator domains protrude significantly from the membrane, forming a triangular topography with top-to-top distances of ∼57 Å (measured on N378). Viewed from the cytoplasm (Center), the trimer scaffold domain protrudes most (beginnings of the long helices 5, residue K175). Viewed from the side (Right), the central scaffold domain protrudes from the membrane on the intracellular face. (C) Inward-facing structure (PDB ID code 3KBC) viewed from the extracellular space (Left). The highest protrusions (residues Q120) are separated by ∼41 Å. Elevator domains do not protrude significantly from the membrane in this conformation; see side view (Right). Viewed from the intracellular face (Center), the elevator domains protrude (residue S295) just slightly more than the central scaffold domain (residue K175).
From HS-AFM movies, we calculated kymographs of the single-transport domain dynamics (Fig. 1C). The domains displayed up-and-down elevator motions with an amplitude of 1.85 ± 0.42 nm (Fig. 1D, Upper), consistent with crystal structures of extreme states (Fig. S3A) (6, 7), sm-FRET (8, 16, 17), and electron paramagnetic resonance (EPR) (19, 20) studies. Kymographs converted to idealized traces of transitions between outward- and inward-facing conformations (Fig. 1D, Lower, and Movie S3) were used to determine the dwell times of each state.
Trimers inserted into the membrane with the intracellular side facing the HS-AFM tip were also observed (∼10%) and revealed motions (Fig. S4 and Movie S4). However, their much less pronounced surface features (Fig. S3C) precluded quantitative analysis.
Fig. S4.
GltPh trimer viewed from the cytoplasmic face. Ten representative HS-AFM frames of the inward-facing side of GltPh revealing domain motion; full color scale is 3 nm. GltPh transporter reconstitution into lipid vesicles and subsequent adsorption to the HS-AFM sample support favored exposure of the extracellular face of GltPh for HS-AFM analysis (Fig. 1A). Occasionally, trimers exposing their cytoplasmic side to the HS-AFM tip were imaged. In agreement with the predictions from the X-ray structures (Fig. S3), this face exposed less-pronounced surface features and appeared globally as darker (less protruding) triangles (outlined by dashed line in frame t = 247 s). The central protrusion of the trimerization domains is most conspicuous when the elevator domains are all in the outward-facing state (e.g., frame t = 10 s and t = 26 s, indicated by arrowhead in frame t = 247 s). HS-AFM could detect transport domain motions to the inward-facing state from the cytoplasmic side (e.g., frame t = 79 s, in which clearly two individual protrusions are visible), but it was not possible to assign elevator states with certainty (Movie S4), and only molecules exposing the extracellular face to the HS-AFM tip were integrated into the analysis.
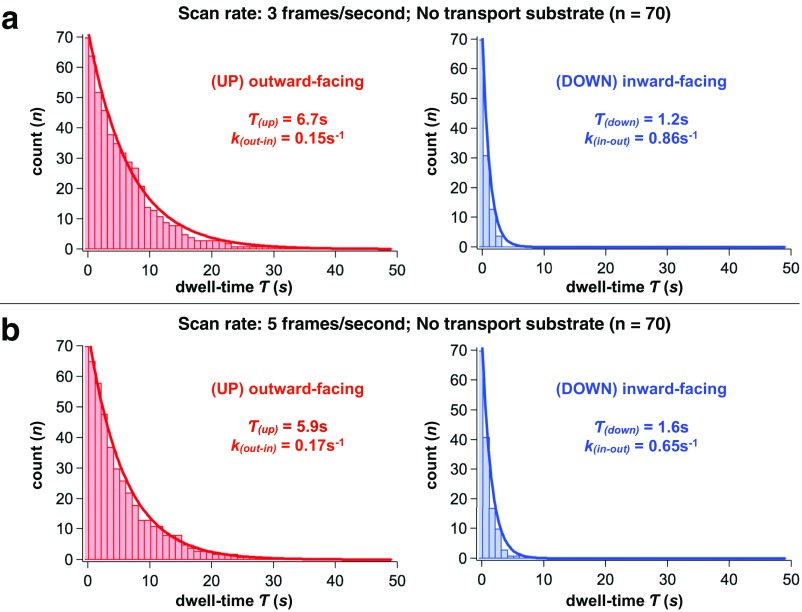
Because the time resolution of our recordings (1 s) is comparable to the observed dwell times, we confirmed that results were not affected by faster scanning velocities (Fig. S5). The signal-to-noise ratio in measurements of small-domain movements of the GltPh protein was diminished, and we did not use faster velocities in our further experiments.
Fig. S5.
Quantification of the elevator domain dynamics at subsecond imaging rate. Survival plots of outward-facing (Left, red) and inward-facing (Right, blue) states of the transport domain in the absence of substrates. (A) Imaging rate: three frames per second [τ(up-apo) = 6.7 ± 0.3 s; τ(down-apo) = 1.2 ± 0.1 s]. (B) Imaging rate: five frames per second [τ(up-apo) = 5.9 ± 0.2 s; τ(down-apo) = 1.6 ± 0.1 s]. All results are given as fit parameter of τ ± coefficient confidence interval, at 95% confidence level. The number of events analyzed, n, is shown above the panels. The survival plots were fitted to single exponentials (solid lines), and corresponding lifetimes and kinetic constants are shown in the panels.
Dynamic Basis of Sodium and Aspartate Symport.
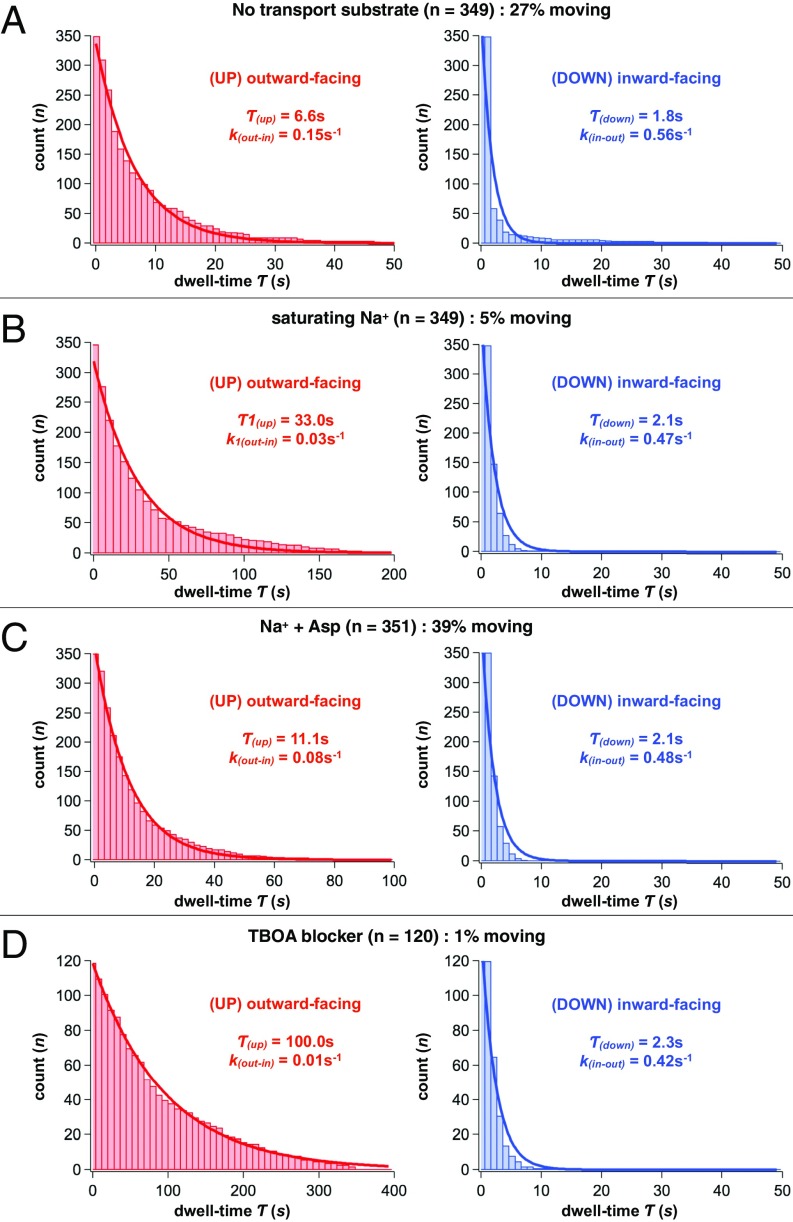
To correlate molecular motions to function, we first examined the dynamics of the apo GltPh transporter under substrate-free conditions (Movie S5). HS-AFM imaging revealed frequent elevator domain movements between “up” and “down” states with dwell times of τ(up-apo) = 6.6 s and τ(down-apo) = 1.8 s (Fig. 2A and Table S1). Notably, only 27% of the molecules [Q(apo)] displayed motions, whereas the rest remained inactive during the observation time windows; typical HS-AFM movie durations were ∼100 s.
Fig. 2.
Quantification of the elevator domain dynamics. Survival plots of outward-facing (Left, red) and inward-facing (Right, blue) states of the transport domain in (A) the absence of substrates [τ(up-apo) = 6.6 ± 0.3 s; τ(down-apo) = 1.8 ± 0.4 s], (B) the presence of saturating Na+ [τ(up-Na+) = 33.0 ± 2.1 s; τ(down-Na+) = 2.1 ± 0.3 s], (C) the presence of Na+ and aspartate [τ(up-transport) = 11.1 ± 0.4 s; τ(down-transport) = 2.1 ± 0.3 s], and (D) the presence of a nontransportable aspartate analog, DL-TBOA [τ(up-TBOA) = 100.0 ± 2.5 s; τ(down-TBOA) = 2.3 ± 0.3 s]. All results are given as fit parameter of τ ± coefficient confidence interval, at 95% confidence level. The number of dynamic events analyzed, n, and the fractions of total protomers displaying dynamics in percentage are shown above the panels. Survival plots were fitted to single exponentials (solid lines) and corresponding lifetimes and kinetic constants are shown in the panels.
Table S1.
GltPh kinetic parameters determined by HS-AFM
| Condition | τ(up), s | k(out-in), s−1 | p(up) | τ(down), s | k(in-out), s−1 | p(down) | ΔG(translation), kBT | Q, % | ΔG(activation), kBT |
| Apo (no substrates) | 6.6 | 0.15 | 0.79 | 1.8 | 0.56 | 0.21 | 1.3 | 27 | 1.0 |
| Na+ (10 × Kd of Na+) | 33.0 | 0.03 | 0.94 | 2.1 | 0.47 | 0.06 | 5 | ||
| Transport (Na+ + Asp) | 11.1 | 0.08 | 0.84 | 2.1 | 0.48 | 0.16 | 1.7 | 39 | 0.5 |
| TBOA (blocker) | 100.0 | 0.01 | 0.98 | 2.3 | 0.42 | 0.02 | 1 |
τ(up) (column 1), τ(down) (column 4), and Q (column 8) were determined directly in HS-AFM experiments. The rate constants k(out-in) (column 2), and k(in-out) (column 5) are calculated as 1/τ(up) and 1/τ(down), respectively. The state probabilities p(up) (column 3) and p(down) (column 6) are calculated according to Eqs. S4 and S5, respectively. The free-energy differences between states (column 7) were calculated from τ(up) and τ(down) according to Eq. S2. The free energy of protomer activation was calculated from Q according to Eq. S1.
As a Na+/Asp symporter, GltPh is expected to bind Na+ ions with the dissociation constant of ∼100 mM (21), but not to translocate them in the absence of Asp. Consistently, we observed a dramatic decrease in the fraction of moving protomers, Q(Na+) = 5%, in the presence of 1 M Na+ only. Moreover, those molecules that exhibited movements showed a much longer average dwell time in the outward-facing state, τ(up-Na+) = 33.0 s (Fig. 2B). Thus, GltPh protomers bound only to Na+ ions are mostly unable to translocate. The rare elevator motions detected are likely due to Na+ transiently dissociating from GltPh. Indeed, we estimate that the fraction of Na+-free protomers is ∼3% (assuming a binding Hill coefficient of ∼1.5 as previously reported) (21) in 1 M Na+. Interestingly, the inward-facing state remained short-lived with τ(down-Na+) = 2.1 s (Fig. 2B), similar to that observed in the substrate-free experiment.
We next examined the dynamics in the presence of highly saturating substrate concentrations (150 mM NaCl and 1 µM Asp). We note that the membrane-reconstituted proteins adsorbed to the HS-AFM support may experience somewhat asymmetric conditions. However, the solvent cleft between the membrane and mica is >1 nm, because proteins in less dense reconstitutions are diffusing and hence not directly interacting with the mica (22), and the trimerization domain that protrudes ∼1 nm from the membrane further elevates the membrane surface from the mica; hence, this should allow for rapid diffusion of Na+ and Asp to the support-facing side of the membrane. Thus, we believe that the concentrations of Na+ ions and Asp, as seen by the transporter, are the same on the opposite sides of the membrane. GltPh shows highly cooperative and tight binding of Na+ ions and Asp from both the extracellular and intracellular sides of the membrane (21). Under our conditions, we expect the apparent dissociation constants for Na+ and Asp to be below 10 mM and 1 nM, respectively. Thus, the overwhelming majority of GltPh protomers are bound to the substrates, and we must be observing bidirectional transport in our HS-AFM experiments. In contrast to Na+ alone, the GltPh protein showed robust dynamics when bound to both Na+ ions and Asp with dwell times in the outward- and inward-facing conformations of, respectively, τ(up-transport) = 11.1 s and τ(down-transport) = 2.1 s (Fig. 2C and Movie S6). The population of active molecules Q(transport) = 39% surpassed that of the apo protein (Table S1).
In contrast, when we replaced Asp with a competitive transport blocker dl-threo-β-benzyloxyaspartate (DL-TBOA) (23), GltPh remained stalled in the outward-facing state with Q(TBOA) = 1%, and the few observed movements occurred after long outward-facing dwells τ(up-TBOA) = 100.0 s (Fig. 2D). On the rare occasions that an elevator domain went into the inward-facing state, τ(down-TBOA) = 2.3 s was again similar to other experiments.
Collectively, HS-AFM reveals that GltPh is much more dynamic in the absence and presence of Na+ and Asp than when only Na+ is present or when blocker replaces Asp. These features are in excellent agreement with what is expected for a Na+/Asp symporter.
GltPh Transport Domains Function Independently.
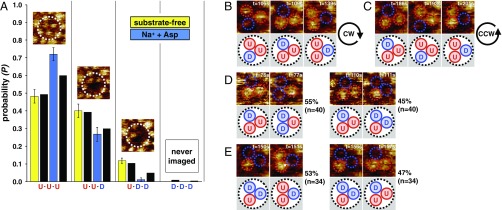
HS-AFM has a unique advantage of imaging molecules directly at high spatiotemporal resolution, allowing us to analyze correlations between movements of domains within a trimer. A GltPh trimer can adopt eight configurations with each transport domain in either outward- or inward-facing position. The populations of states with 3, 2, 1, or 0 transport domains exposed to the exterior are assessed from the experimental data (Fig. 3A) and agree very well with predictions based on a noncooperative model (Table S2). We further detect no regularity as to whether the neighbor located clockwise or anticlockwise relative to an active elevator domain would move next: U-D-U through U-U-D to D-U-U (Fig. 3B), or in a counterclockwise manner from U-D-U through D-U-U to U-U-D (Fig. 3C). Furthermore, of 40 observations made in 6 trimers where one transport domain was already in the down position, U-D-U configuration, and a second followed, transitions into D-D-U and U-D-D configurations were observed, respectively, 22 and 18 times (Fig. 3D). Similarly, among 34 observations in 7 trimers where D-U-D configuration was observed, we recorded 18 and 16 transitions into U-U-D and D-U-U configurations, respectively (Fig. 3E). Thus, there are no correlations between the motions of individual transport domains in the GltPh trimer. Therefore, we demonstrate unambiguously that protomers in the trimer act independently of each other in agreement with a long history of functional studies (24–26).
Fig. 3.
Lack of cooperativity between elevator domains within GltPh trimers. (A) Experimentally determined probabilities of U·U·U, U·U·D, U·D·D, and D·D·D configurations for the substrate-free (yellow) and transport (blue) conditions (n = 40 molecules). The black columns next to the experimental data represent probabilities calculated for a system of three independent protomers (Table S1). (Insets) Representative images of single molecules; full color scale is 3 nm. (B–E) Lack of order in the movements of transport domains. In trimers where single transport domains were observed to move inward one at a time, both clockwise (CW) (B) and counterclockwise (CCW) (C) orders were observed. (D) In trimers with one domain already in the inward-facing state, neighboring CCW (Left) and CW (Right) transport domains were equally likely to translocate from outward to inward state. (E) In trimers with two domains in the inward position, the probabilities that either would return to the outward position were similar. Data for B–E were from the recordings under transport conditions.
Table S2.
Probabilities of distinct configurations of GltPh trimers
| Condition | p(U) | p(D) | p(UUU) | p(UUD) | p(UDD) | p(DDD) |
| Apo (no substrates) | 0.79 | 0.21 | 0.49 | 0.39 | 0.11 | 0.01 |
| Transport (Na+ + Asp) | 0.84 | 0.16 | 0.60 | 0.34 | 0.05 | 0.004 |
The state probabilities of individual elevator domains, p(U) (column 1) and p(D) (column 2), were derived from the experimental dwell time τ(up) and τ(down) according to Eqs. S4 and S5, respectively. Probabilities of transport domain configurations (columns 3, 4, 5, and 6) within a full noncooperative trimer were calculated using Eq. S3.
Energy Landscape of Transport Domain Motions.
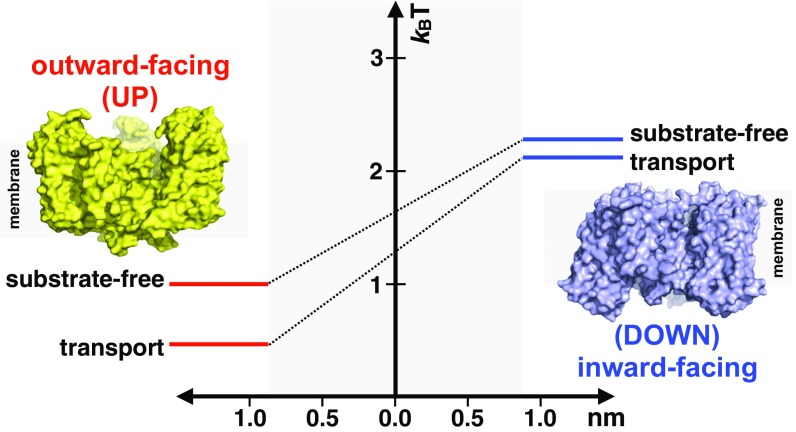
Our HS-AFM recordings provide spatiotemporal resolution that is sufficiently high and consistent to allow not only qualitative observations of domain movements, but also their quantitative analysis. Thus, we observed that the outward-facing state lifetimes and the fraction of active molecules depended on substrate binding (Table S1). Notably, the majority of molecules remain inactive during HS-AFM movie acquisition under all conditions. The reason for this inactivity remains unclear. Some molecules might be damaged, or tight protein packing might be restrictive to motions. However, the fraction of active molecules varies depending on the ligands bound to the transporter, arguing against these explanations. Alternatively, temporary inactivity could be an innate feature of the transporter; if so, it might be reminiscent of dynamic heterogeneity observed in sm-FRET studies of GltPh, where periods of activity were interspersed by long quiescent periods (8, 16) [although not in another (17)]. Assuming that the stalled molecules observed in HS-AFM experiments reflect the reversible entry into such postulated “locked” states, we interpret the Q value (Table S1) as a fraction of unlocked active transporters. From Q values we estimate the free energy of unlocking or activation, and from the dwell times measured for the outward- and inward-facing states of the active molecules we obtain the energy difference between these states (Table S1). Notably, the outward-facing state is longer lived in the substrate-bound compared with the apo transporter. Reduced dynamics of the substrate-bound transport domain has also been observed in sm-FRET studies (8, 16). At present, we do not know why the dynamics are reduced, but we note that substrate binding is associated with minor conformational changes (10) and changes in the overall charge of the transport domain. Together, these values yield an energy landscape describing elevator domain activation and transmembrane motion (Fig. 4). These profiles are incomplete because the heights of the barriers between the states cannot be unambiguously calculated from the kinetic rates. Nevertheless, under the apo and transport conditions, the domain activation costs ∼1 kBT. Bringing the substrate-loaded domain across the membrane is associated with a slightly higher energy cost of 0.4 kBT compared with the substrate-free domain.
Fig. 4.
GltPh activation and movement energy landscape. An activation energy term ΔG(activation) and an energy difference between the outward- and inward-facing states ΔG(translation) are calculated from the fraction of active protomers and the lifetimes, respectively, for the apo and transport conditions analyzed. Note that an energy barrier higher than the inward-facing state that cannot be estimated must exist between the two states. Surface-rendered structures of the outward-facing (PDB ID code 2NWX, yellow) and the inward-facing (PDB ID code 3KBC, blue) states are shown. The gray-shaded area represents the 1.85-nm movement amplitude traveled along the reaction coordinate by the transport domain between the outward- and inward-facing states.
Discussion
In our experiments, the inward-facing state is a short-lived, relatively high-energy state with dwell times of ∼2 s under all conditions. In that regard, we do not recapitulate results of sm-FRET experiments, showing increased lifetimes of both the outward- and inward-facing states when bound to substrates (8). It cannot be excluded that the energy delivered by the HS-AFM tip speeds up inward-to-outward state transition. It is also possible that the supported membrane, which is separated from the mica support by a thin (∼1 nm) cleft, biases state energies. However, it is notable that the relatively high energy of the inward-facing state combined with subunit independence would ensure that GltPh displays probabilities of 89% in substrate-free conditions and 95% in transport conditions of having no more than one domain in the inward-facing state at a time (Fig. 3A). The states with multiple protomers facing inward are avoided, perhaps because in such trimers the central trimerization domain could move outward instead of the lipid-facing transport domains moving inward, making substrate transport inefficient.
In conclusion, we present real-space and real-time movies of individual transmembrane transporters at work. The unique advantage of HS-AFM is that it provides direct medium-resolution (∼1 nm lateral and ∼0.1 nm vertical resolution) structural and dynamic information on membrane-embedded proteins, requiring neither labeling nor complex data interpretation. GltPh, which originates from a thermophilic prokaryote, is an exceptionally favorable model system, yet future research calls for the studies of human glutamate transporters that show much faster uptake kinetics; their turnover times range from milliseconds to just under a second for different subtypes. Our current state-of-the-art HS-AFM can reach scanning speed of 20 ms per frame when the imaging area is reduced, and pixel sampling and tip velocity are kept constant (27). However, if we were to acquire single scan lines of membrane-embedded transporters, we could generate height profiles changes with submillisecond time resolution. Ultimately, the positional readout of the cantilever reaches the microsecond regime and should allow the characterization of even faster conformational changes.
SI Materials and Methods
Protein Purification.
GltPh variant containing seven point mutations to histidine for enhanced expression levels (termed GltPh for brevity) was expressed and purified as previously described (7). Briefly, the protein was expressed in Escherichia coli DH10b strain as a C-terminal fusion with a thrombin cleavage site and a (His)8 tag. The isolated crude membranes were solubilized in buffer A, containing 20 mM Hepes/Tris, pH 7.4, 200 mM NaCl, 0.1 mM l-aspartate supplemented with 40 mM n-dodecyl β-d-maltopyranoside (DDM) for 2 h at 4 °C. Solubilized transporters were then applied to immobilized metal affinity resin in buffer A in the presence of 1 mM DDM. The resin was washed in the same buffer supplemented with 40 mM imidazole, and GltPh protein was eluted in the presence of 250 mM imidazole. The (His)8 tag was removed by thrombin digestion overnight, and protein was further purified by size-exclusion chromatography in the following buffer: 10 mM Hepes, pH 7.4, 100 mM NaCl, 0.1 mM l-aspartate, 0.4 mM DDM. The protein was concentrated to ∼7 mg/mL, flash frozen, and stored at −80 °C. Protein concentration was determined by absorbance at 280 nm using an extinction coefficient of 57,400 M−1⋅cm−1 (per monomer).
Protein Reconstitution.
The purified protein GltPh was diluted to a concentration of 1 mg/mL in a buffer containing 10 mM Tris, pH 7.4, 100 mM NaCl, 10 mM MgCl2 supplemented with 0.05% DDM, and aliquoted into 50-µL samples for reconstitution at various lipid-to-protein ratios (LPRs). Lipids, a 1,2-dioleoyl-sn-glycero-3-phosphocholine (DOPC)/1,2-dioleoyl-sn-glycero-3-phosphoethanolamine (DOPE)/1,2-dioleoyl-sn-glycero-3-phospho-l-serine (DOPS) 8:1:1 lipid mixture (all lipids from Avanti Polar Lipids), were presolubilized in 2% DDM and added at LPRs between 0.5 and 1.0 (wt/wt). After 1 h of equilibration, ∼5 mg of wet biobeads were added to each reconstitution trial for detergent removal. After overnight incubation, biobeads were removed from the sample and the reconstitution checked by negative-stain electron microscopy for the presence of well-contrasted (protein-packed) vesicles of size sufficiently large for HS-AFM analysis (Fig. S2).
Sample Preparation.
A total of 2 µL of the GltPh reconstituted vesicles were deposited on a 1.5-mm2 freshly cleaved mica surface, which was glued with epoxy to the quartz sample stage. After 30–40 min incubation in a humid chamber, sample was gently rinsed with imaging buffer and mounted in the HS-AFM fluid cell.
HS-AFM.
All images in this study were taken by HS-AFM (18) (Research Institute of Biomolecule Metrology Co.) operated in amplitude modulation mode using optimized scan and feedback parameters. Short (8 µm) cantilevers (NanoWorld) with nominal spring constant of 0.15 N/m, resonance frequency of 0.6 MHz, and a quality factor of ∼2 in buffer were used (27, 28). The energy delivered by a tip-sample interaction can be estimated following . With α = 0.5, the ratio of the amplitude reduction caused by the cantilever resonance frequency shift over the total amplitude reduction, kc = 150 pN/nm the cantilever spring constant, A0 = 1 nm and AS = 0.9 nm the free and the set-point amplitude, respectively, and QC = 1.5 the cantilever quality factor, this energy is ∼1.2 kBT. Although each elevator domain of ∼2 nm in diameter (Fig. S3B) is tapped ∼400 times during a typical single frame acquisition (Fig. 1A), most of the input energy will be dissipated into the fluid between taps. In the presented experiments, four different buffer conditions were used. No substrate (apo) conditions: 20 mM Tris⋅HCl, pH 7.5, 150 mM KCl; saturating Na+ conditions: 20 mM Tris⋅HCl, pH 7.5, 1 M NaCl; transport (Na+ + Asp) conditions: 20 mM Tris, pH 7.5, 150 mM NaCl, 1 µM Asp; and TBOA blocker conditions: 20 mM Tris, pH 7.5, 150 mM NaCl, 1 mM DL-TBOA.
We investigated GltPh from three protein purifications from which we made ∼20 reconstitutions assays. We analyzed the reconstitutions best amenable for HS-AFM, i.e., large membrane patches, in detail. All experiments from all purifications and samples showed the same transport phenomenology. We focused our analysis, however, on one full set of experiments from one sample, justifying the comparison of the percentage of active protomers between conditions. In each condition, tens of movies were acquired over several days, and the analyzed data are pooled from the highest-resolution movies, at least eight in apo, six in saturating Na+, six in transport, and four in TBOA conditions.
Data Analysis.
HS-AFM movies were drift corrected using a dedicated plugin developed for HS-AFM in ImageJ (29). Transport domain height changes recorded as a function of time were analyzed in kymographs (Fig. 1C) that are transformations of a x, y, t image stack (where x and y are the image dimensions and t the time of image recording in the depth of the image stack) into x, t, and y, t images, for individual y or x lines, respectively. From these kymographs, height traces of the domain protrusion (Fig. 1D) were derived by averaging the pixel values along the dashed lines in Fig. 1C. These height values separated in two well-defined Gaussian distributions corresponding to the up and down states of the transporter domain. The intermediate value between the two distributions was used as a threshold to derive idealized height traces where the up state was interpreted as the outward-facing state and the down state as the inward-facing state, respectively (Fig. 1D). From the idealized traces, the dwell times (duration during which a transport domain remains in one conformation) of the outward- and the inward-facing states were assessed. On large-scale images, the mean value (mean) of the entire image was used as baseline value. Following, individual transport domains were boxed in a 5 × 5-nm area around their center, and the minimum (min) and maximum (max) pixel values inside the box assessed. The overall height (h) of the transport domain was calculated following h = [abs(min − mean) + abs(max − mean)]. If both values, min and max were lower than mean (of the entire image), then the domain was in the down state. All molecule traces were further analyzed and corrected by hand to avoid misinterpretation of values due to noise. Single-molecule height and dwell-time distribution analysis were performed in OriginPro and Matlab.
Calculation of the Free-Energy Differences of Elevator Domain Activation and Transmembrane Translocation.
“Activation” energy term ΔG(activation) is calculated from the measured fraction Q, which is the ratio of active protomers to all protomers observed in a movie:
| [S1] |
The free-energy changes upon transitions between distinct conformational states ΔG(transition) is calculated from measured dwell times of the outward-facing τ(up) and inward-facing τ(down) states:
| [S2] |
where kB is Boltzmann constant and T is the absolute temperature.
All ΔG(activation) and ΔG(transition) values for the various conditions are summarized in Table S1, and the energy profiles shown in Fig. 3. Only protomers showing motions during the observation window are considered in the ΔG(transition) analysis.
Evaluation of Cooperativity of GltPh Trimer Transport Domains.
The GltPh trimer can adopt eight configurations with each elevator domain in either outward-facing (up, U) or inward-facing (down, D) position: (i) (U·U·U); (ii) (D·U·U); (iii) (U·D·U); (iv) (U·U·D); (v) (D·D·U); (vi) (U·D·D); (vii) (D·U·D); and (viii) (D·D·D). Because states 2, 3, and 4 are equivalent, and states 5, 6, and 7 are equivalent too, a trimer can adopt all states of a binomial distribution, as described by
| [S3] |
where p(U) and p(D) are probabilities of single elevator domains being in the outward-facing (up, U) and the inward-facing (down, D) states. The probabilities of distinct configurations are
p(U) and p(D) are calculated from the experimental dwell times, and τ(up) and τ(down) determined under distinct buffer conditions:
| [S4] |
| [S5] |
Supplementary Material
Acknowledgments
We thank Dr. G. Verdon for initial protein preparation, Dr. C. M. Nimigean for advice with statistical analysis of the trimer states, and Dr. S. Blanchard for fruitful discussions. This work was supported by Agence National pour la Recherche (ANR) Grants ANR-11-IDEX-0001-02 (A*MIDEX) and ANR-Nano Grant ANR-12-BS10-009-01; European Research Council Starting Grant 310080 (to S.S.); and NIH Grant R37NS085318 (to O.B.).
Footnotes
The authors declare no conflict of interest.
This article is a PNAS Direct Submission.
This article contains supporting information online at www.pnas.org/lookup/suppl/doi:10.1073/pnas.1616413114/-/DCSupplemental.
References
- 1.Danbolt NC. Glutamate uptake. Prog Neurobiol. 2001;65(1):1–105. doi: 10.1016/s0301-0082(00)00067-8. [DOI] [PubMed] [Google Scholar]
- 2.Vandenberg RJ, Ryan RM. Mechanisms of glutamate transport. Physiol Rev. 2013;93(4):1621–1657. doi: 10.1152/physrev.00007.2013. [DOI] [PubMed] [Google Scholar]
- 3.Tzingounis AV, Wadiche JI. Glutamate transporters: Confining runaway excitation by shaping synaptic transmission. Nat Rev Neurosci. 2007;8(12):935–947. doi: 10.1038/nrn2274. [DOI] [PubMed] [Google Scholar]
- 4.Zerangue N, Kavanaugh MP. Flux coupling in a neuronal glutamate transporter. Nature. 1996;383(6601):634–637. doi: 10.1038/383634a0. [DOI] [PubMed] [Google Scholar]
- 5.Takahashi K, Foster JB, Lin CL. Glutamate transporter EAAT2: Regulation, function, and potential as a therapeutic target for neurological and psychiatric disease. Cell Mol Life Sci. 2015;72(18):3489–3506. doi: 10.1007/s00018-015-1937-8. [DOI] [PMC free article] [PubMed] [Google Scholar]
- 6.Reyes N, Ginter C, Boudker O. Transport mechanism of a bacterial homologue of glutamate transporters. Nature. 2009;462(7275):880–885. doi: 10.1038/nature08616. [DOI] [PMC free article] [PubMed] [Google Scholar]
- 7.Yernool D, Boudker O, Jin Y, Gouaux E. Structure of a glutamate transporter homologue from Pyrococcus horikoshii. Nature. 2004;431(7010):811–818. doi: 10.1038/nature03018. [DOI] [PubMed] [Google Scholar]
- 8.Akyuz N, Altman RB, Blanchard SC, Boudker O. Transport dynamics in a glutamate transporter homologue. Nature. 2013;502(7469):114–118. doi: 10.1038/nature12265. [DOI] [PMC free article] [PubMed] [Google Scholar]
- 9.Groeneveld M, Slotboom DJ. Na(+):aspartate coupling stoichiometry in the glutamate transporter homologue Glt(Ph) Biochemistry. 2010;49(17):3511–3513. doi: 10.1021/bi100430s. [DOI] [PubMed] [Google Scholar]
- 10.Verdon G, Oh S, Serio RN, Boudker O. Coupled ion binding and structural transitions along the transport cycle of glutamate transporters. eLife. 2014;3:e02283. doi: 10.7554/eLife.02283. [DOI] [PMC free article] [PubMed] [Google Scholar]
- 11.Verdon G, Boudker O. Crystal structure of an asymmetric trimer of a bacterial glutamate transporter homolog. Nat Struct Mol Biol. 2012;19(3):355–357. doi: 10.1038/nsmb.2233. [DOI] [PMC free article] [PubMed] [Google Scholar]
- 12.Boudker O, Ryan RM, Yernool D, Shimamoto K, Gouaux E. Coupling substrate and ion binding to extracellular gate of a sodium-dependent aspartate transporter. Nature. 2007;445(7126):387–393. doi: 10.1038/nature05455. [DOI] [PubMed] [Google Scholar]
- 13.Abramson J, et al. Structure and mechanism of the lactose permease of Escherichia coli. Science. 2003;301(5633):610–615. doi: 10.1126/science.1088196. [DOI] [PubMed] [Google Scholar]
- 14.Krishnamurthy H, Gouaux E. X-ray structures of LeuT in substrate-free outward-open and apo inward-open states. Nature. 2012;481(7382):469–474. doi: 10.1038/nature10737. [DOI] [PMC free article] [PubMed] [Google Scholar]
- 15.Slotboom DJ. Structural and mechanistic insights into prokaryotic energy-coupling factor transporters. Nat Rev Microbiol. 2014;12(2):79–87. doi: 10.1038/nrmicro3175. [DOI] [PubMed] [Google Scholar]
- 16.Akyuz N, et al. Transport domain unlocking sets the uptake rate of an aspartate transporter. Nature. 2015;518(7537):68–73. doi: 10.1038/nature14158. [DOI] [PMC free article] [PubMed] [Google Scholar]
- 17.Erkens GB, Hänelt I, Goudsmits JM, Slotboom DJ, van Oijen AM. Unsynchronised subunit motion in single trimeric sodium-coupled aspartate transporters. Nature. 2013;502(7469):119–123. doi: 10.1038/nature12538. [DOI] [PubMed] [Google Scholar]
- 18.Ando T, Uchihashi T, Scheuring S. Filming biomolecular processes by high-speed atomic force microscopy. Chem Rev. 2014;114(6):3120–3188. doi: 10.1021/cr4003837. [DOI] [PMC free article] [PubMed] [Google Scholar]
- 19.Hänelt I, Wunnicke D, Bordignon E, Steinhoff H-J, Slotboom DJ. Conformational heterogeneity of the aspartate transporter Glt(Ph) Nat Struct Mol Biol. 2013;20(2):210–214. doi: 10.1038/nsmb.2471. [DOI] [PubMed] [Google Scholar]
- 20.Georgieva ER, Borbat PP, Ginter C, Freed JH, Boudker O. Conformational ensemble of the sodium-coupled aspartate transporter. Nat Struct Mol Biol. 2013;20(2):215–221. doi: 10.1038/nsmb.2494. [DOI] [PMC free article] [PubMed] [Google Scholar]
- 21.Reyes N, Oh S, Boudker O. Binding thermodynamics of a glutamate transporter homolog. Nat Struct Mol Biol. 2013;20(5):634–640. doi: 10.1038/nsmb.2548. [DOI] [PMC free article] [PubMed] [Google Scholar]
- 22.Casuso I, et al. Characterization of the motion of membrane proteins using high-speed atomic force microscopy. Nat Nanotechnol. 2012;7(8):525–529. doi: 10.1038/nnano.2012.109. [DOI] [PubMed] [Google Scholar]
- 23.Shimamoto K, et al. DL-threo-beta-benzyloxyaspartate, a potent blocker of excitatory amino acid transporters. Mol Pharmacol. 1998;53(2):195–201. doi: 10.1124/mol.53.2.195. [DOI] [PubMed] [Google Scholar]
- 24.Koch HP, Larsson HP. Small-scale molecular motions accomplish glutamate uptake in human glutamate transporters. J Neurosci. 2005;25(7):1730–1736. doi: 10.1523/JNEUROSCI.4138-04.2005. [DOI] [PMC free article] [PubMed] [Google Scholar]
- 25.Grewer C, et al. Individual subunits of the glutamate transporter EAAC1 homotrimer function independently of each other. Biochemistry. 2005;44(35):11913–11923. doi: 10.1021/bi050987n. [DOI] [PMC free article] [PubMed] [Google Scholar]
- 26.Leary GP, Stone EF, Holley DC, Kavanaugh MP. The glutamate and chloride permeation pathways are colocalized in individual neuronal glutamate transporter subunits. J Neurosci. 2007;27(11):2938–2942. doi: 10.1523/JNEUROSCI.4851-06.2007. [DOI] [PMC free article] [PubMed] [Google Scholar]
- 27.Miyagi A, Chipot C, Rangl M, Scheuring S. High-speed atomic force microscopy shows that annexin V stabilizes membranes on the second timescale. Nat Nanotechnol. 2016;11(9):783–790. doi: 10.1038/nnano.2016.89. [DOI] [PubMed] [Google Scholar]
- 28.Chiaruttini N, et al. Relaxation of loaded ESCRT-III spiral springs drives membrane deformation. Cell. 2015;163(4):866–879. doi: 10.1016/j.cell.2015.10.017. [DOI] [PMC free article] [PubMed] [Google Scholar]
- 29.Husain M, Boudier T, Paul-Gilloteaux P, Casuso I, Scheuring S. Software for drift compensation, particle tracking and particle analysis of high-speed atomic force microscopy image series. J Mol Recognit. 2012;25(5):292–298. doi: 10.1002/jmr.2187. [DOI] [PubMed] [Google Scholar]
Associated Data
This section collects any data citations, data availability statements, or supplementary materials included in this article.


