Significance
Circadian (24-h) rhythms influence the behavior and physiology of many organisms. These rhythms are generated at the gene expression level, causing the waxing and waning of protein abundances. Metabolic enzymes are affected, but the principles for the propagation of enzyme rhythmicity to cellular metabolism as quantified by fluxes through metabolic pathways and metabolite concentrations are not understood. We used the mathematics of chemical kinetics to systematically investigate how rhythms in enzyme activity are propagated to pathway fluxes and concentrations. It turned out that rhythms are often optimally propagated when several enzyme activities are rhythmic but with different timing. We performed measurements of circadian enzyme activities in mouse muscle that confirmed such timing differences.
Keywords: circadian rhythms, glucose metabolism, metabolic response analysis, mouse skeletal muscle
Abstract
Circadian rhythms govern multiple aspects of animal metabolism. Transcriptome-, proteome- and metabolome-wide measurements have revealed widespread circadian rhythms in metabolism governed by a cellular genetic oscillator, the circadian core clock. However, it remains unclear if and under which conditions transcriptional rhythms cause rhythms in particular metabolites and metabolic fluxes. Here, we analyzed the circadian orchestration of metabolic pathways by direct measurement of enzyme activities, analysis of transcriptome data, and developing a theoretical method called circadian response analysis. Contrary to a common assumption, we found that pronounced rhythms in metabolic pathways are often favored by separation rather than alignment in the times of peak activity of key enzymes. This property holds true for a set of metabolic pathway motifs (e.g., linear chains and branching points) and also under the conditions of fast kinetics typical for metabolic reactions. By circadian response analysis of pathway motifs, we determined exact timing separation constraints on rhythmic enzyme activities that allow for substantial rhythms in pathway flux and metabolite concentrations. Direct measurements of circadian enzyme activities in mouse skeletal muscle confirmed that such timing separation occurs in vivo.
Circadian rhythms are 24-h cycles in behavior, physiology, and cellular processes that persist in the absence of external cues. In mammals, circadian rhythms in the expression of thousands of genes in various metabolic tissues ensure up- or down-regulation of important metabolic processes in anticipation of daily activity and rest periods (1, 2). Circadian gene expression in mammalian tissues depends on the circadian core clock, a genetic feedback oscillator inducing the transcription of thousands of clock-controlled genes. Additional rhythmicity in gene expression is generated by rhythmic posttranscriptional regulation (3). Circadian rhythms have been detected in mRNA and protein abundances (4–6), enzyme activities (7, 8), and concentrations of metabolites (9–11) in various mammalian tissues. Whereas the mechanisms underlying rhythmic gene expression are relatively well-studied, it remains unclear how circadian gene expression induces rhythms in the abundance of metabolites or metabolic fluxes.
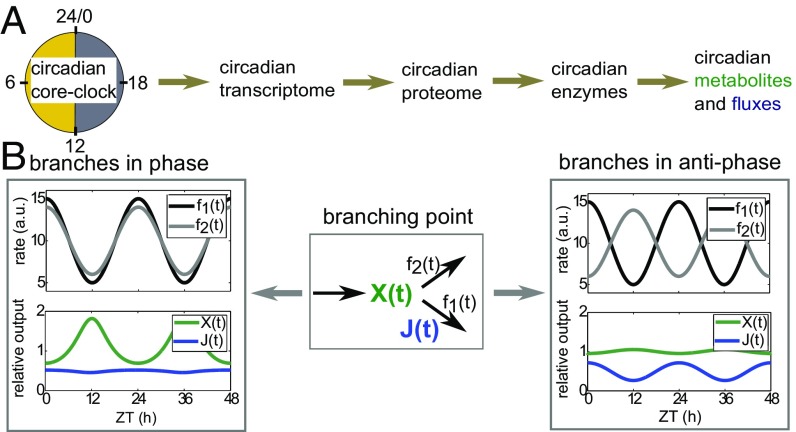
A naïve picture of circadian regulation (Fig. 1A) (“central dogma of molecular chronobiology”) suggests that the circadian core clock drives rhythmic mRNA expression, resulting in rhythmic protein levels and directly leading to rhythmic enzyme activity (12) and thus, metabolic activity. Here, especially metabolic pathway flux (rate of conversion of substrate into product metabolites measured in concentration per time; an analogy is water flow through a floodgate) has been regarded as a crucial biological function under strong evolutionary selection pressure (13, 14). However, it is unclear whether circadian abundances of enzyme transcripts are widespread generators of circadian enzyme activities: Metabolic enzymes in general have long half-lives (15), which preclude circadian rhythms in abundance (3). Furthermore, it remains unknown how circadian rhythms in enzyme activities propagate to rhythmicity in metabolite concentrations and metabolic fluxes through entire pathways.
Fig. 1.
Regulation of metabolic functions by the circadian clock. (A) Illustration of the central dogma of molecular chronobiology. The core clock generates rhythmic transcripts, which result in rhythmic proteins, enzyme activities, and metabolites and fluxes. (B) Simulation illustrating the effect of a circadian branch point. The two branching reactions with periodic rate coefficients , (relative amplitudes 0.5 and 0.4, respectively) are either in phase or antiphasic as indicated. As a result, the metabolite and flux are either strongly rhythmic or constant. ZT, zeitgeber time.
Here, we show that similar peak times of circadian enzyme activities in a metabolic pathway do not necessarily lead to high amplitudes in pathway fluxes. Rather, in many cases, separation in times of peak activity by several hours is advantageous for pronounced circadian rhythms, even when the individual metabolic reactions operate with fast kinetics. We developed a theoretical method called circadian response analysis (CRA) and derived exact rules for the circadian orchestration of important metabolic pathway motifs. We applied these insights to clarify circadian control of glucose metabolism in mouse skeletal muscle by analysis of gene expression data and direct measurement of circadian activities of glycolytic key enzymes.
Results
Circadian Rhythms in the Regulation of Enzymatic Activities.
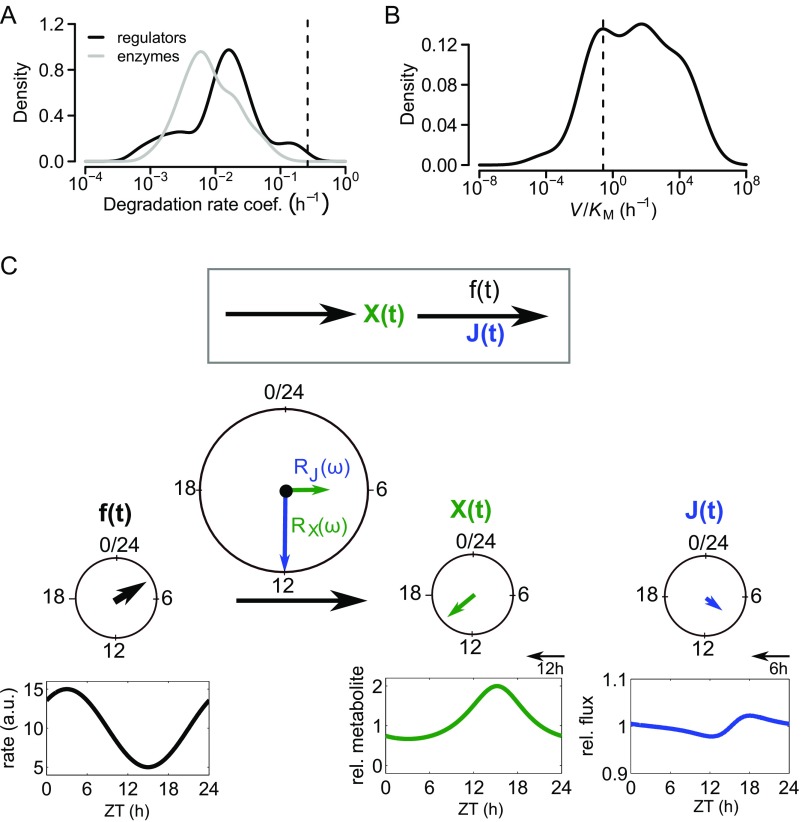
How do circadian rhythms propagate from transcripts to enzyme activities (Fig. 1A)? Mechanistically, rhythms could propagate either directly via rhythms in enzyme concentrations or through regulatory proteins that modulate enzyme activities in a circadian fashion (16). Several studies have emphasized the direct mechanism by mapping rhythms in mRNA expression to metabolic enzymes and sometimes directly measuring enzyme activities (17–19). In a few cases, rhythmic mRNA and protein levels have been measured together with rhythmic enzyme activities (20), supporting this mode of rhythm propagation more rigorously. However, we noted that metabolic enzymes are generally long-lived proteins (15), and enzyme regulatory proteins have significantly shorter half-lives (Fig. S1A). Therefore, there are reasons to doubt that circadian rhythmicity in enzyme concentration is a widespread strategy to induce rhythmic enzyme activity, because long protein half-lives preclude circadian rhythms in protein abundance (3). Thus, regulatory proteins are more plausible mediators of rhythms, which should be considered when performing transcriptome- or proteome-wide studies.
Fig. S1.
Motivation and illustration of CRA. (A) Distribution of degradation rates of regulatory genes and enzymes. Dashed vertical line indicates circadian frequency . Data are from Schwanhausser et al. (15). (B) Distribution of linearized rates of metabolic reactions. Values are estimated as ratios of published Michaelis–Menten constants and maximal reaction rates . The data show that metabolic rates have a broad distribution but are typically larger than the circadian frequency (vertical line). Based on this analysis, we chose (Eq. 1) as a typical value for kinetic parameters throughout the paper and use the assumption (3) in our implementation of CRA. (C) Illustration of CRA. A metabolite is produced with a constant rate and degraded with a rhythmic rate function (Eq. 1). The cosine-shaped rate function with amplitude and phase (input function) generates rhythms in and the flux . The output functions can be derived approximately from the input function and the complex valued response coefficients and for the metabolite and flux in phase space. Cosine-shaped functions with fixed period (here, 24 h) can be represented by vectors with length and angle , illustrating CRA in terms of vector summation. The system amplitude scales the input amplitude, , and the system phase shifts the input phase, (Eq. 2).
In general, if enzyme activities are rhythmic, one may expect that the metabolites and fluxes of metabolic pathways become rhythmic, because metabolic rate coefficients are typically much faster than the circadian frequency h) ≈ 0.26 (Fig. S1B). If several enzymes in a metabolic pathway have rhythmic activities, how do these translate to rhythms in metabolites and fluxes? As an illustration, we considered a branching point in a metabolic network (Fig. 1B). A metabolite is produced with constant rate and processed by two independent reactions with rhythmically changing rate coefficients . The rhythms in the rate coefficients represent rhythms in enzyme activity. Such branching points are common in metabolism; an example is glycogen synthesis breaking off from the glycolytic pathway. Simulation with equal rate coefficients for all reactions showed that, if the two branching reactions are in phase, the metabolite concentrations are rhythmic with maximal relative amplitude (amplitude divided by mean; hereafter simply amplitude), but the fluxes through both branches are almost constant (Fig. 1B). Similarly, when the two reactions have opposite phases, the metabolite concentrations are constant [as long as average do not differ too much as analyzed in-depth below], whereas the fluxes have maximal amplitude. Hence, the outcome of rhythmic enzyme activities at branching points strongly depends on their phases.
Metabolic Network Motifs Studied by CRA.
The example of the branching point (Fig. 1B) shows that rhythmic enzymes do not necessarily result in both rhythmic metabolites and fluxes, and if they do, the metabolites and fluxes can widely differ in phase. This observation raises a number of questions. Can we predict the amplitudes and phases of metabolites and fluxes based on the properties of rhythmic enzymes? What are optimal phases of enzyme activity for synergistic induction of rhythms in metabolite concentrations and fluxes? Can we expect highly rhythmic metabolic fluxes given the complex regulation of metabolic networks? To address such questions quantitatively, we developed CRA, a theory based on an extension (21) of metabolic control analysis (MCA) (22–24) (Materials and Methods and Fig. S1C). Application of CRA resulted in simple formulas that describe amplitudes and phases of concentrations and fluxes caused by circadian enzyme activities (formulas listed in SI Appendix and Datasets S1 and S2).
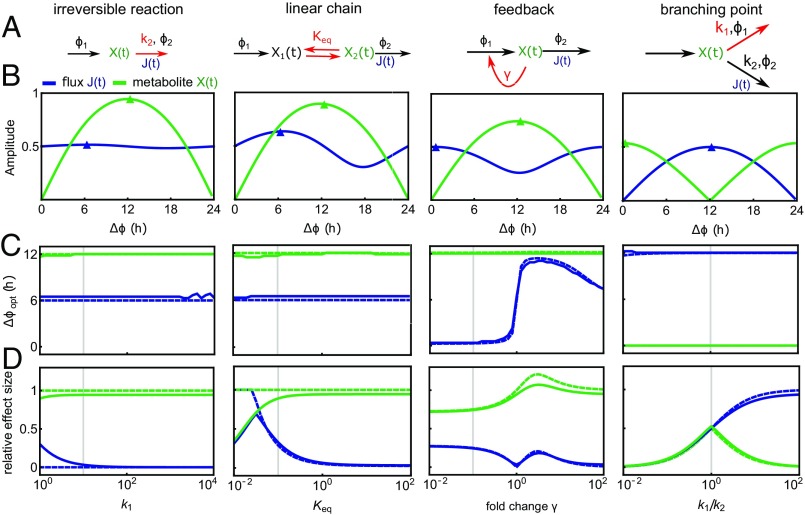
Most metabolic networks can be decomposed into common motifs, such as linear chains, branching points, and cycles (25). Therefore, we used CRA to study the principles of rhythm propagation in such common network motifs (Fig. 2A and Fig. S2A). In each motif, we assumed that two enzyme activities are circadian with phases , , simplifying our analysis to the study of phase differences . We computed the relative amplitudes of metabolites and fluxes in dependence of (Fig. 2B and Fig. S2B), giving rise to the optimal phase difference in the sense of maximizing rhythms in the fluxes or concentrations, as well as the effect size , quantifying the importance of the phase difference (Fig. 2 C and D and Fig. S2 C and D). Our analytical results are close to simulations with linear kinetics (Fig. 2 and Fig. S2) as well as Michealis–Menten kinetics (Fig. S3 and Datasets S3–S5) in the physiological parameter regime (Fig. S1B).
Fig. 2.
Metabolic network motifs studied by CRA. (A) Model schemes. The reactions labeled , are circadian with phase difference ; other reaction rate coefficients are constant. Red arrows and labels indicate the reaction and parameter value varied in the analysis. is the equilibrium constant; is the inhibition constant. All models are described by mass action kinetics (SI Appendix). (B) Relative amplitudes of fluxes and metabolites depending on the phase difference . The value of the parameter determining the network motif (labeled in red in A) is indicated by gray vertical lines in C and D (see below). Small arrowheads indicate the peak phase derived analytically by CRA. (C and D) Optimal phase difference for high metabolite or flux amplitude (C) and effect size (D) for changing value of the parameter describing each network motif (A); in the linear chain motif ), was varied with , and in the branching point motif, was varied. Solid lines indicate numerical solutions, and dashed lines indicate analytical approximation based on CRA. Vertical gray lines indicate parameter values used for corresponding motifs in B. Materials and Methods shows standard parameter values.
Fig. S2.
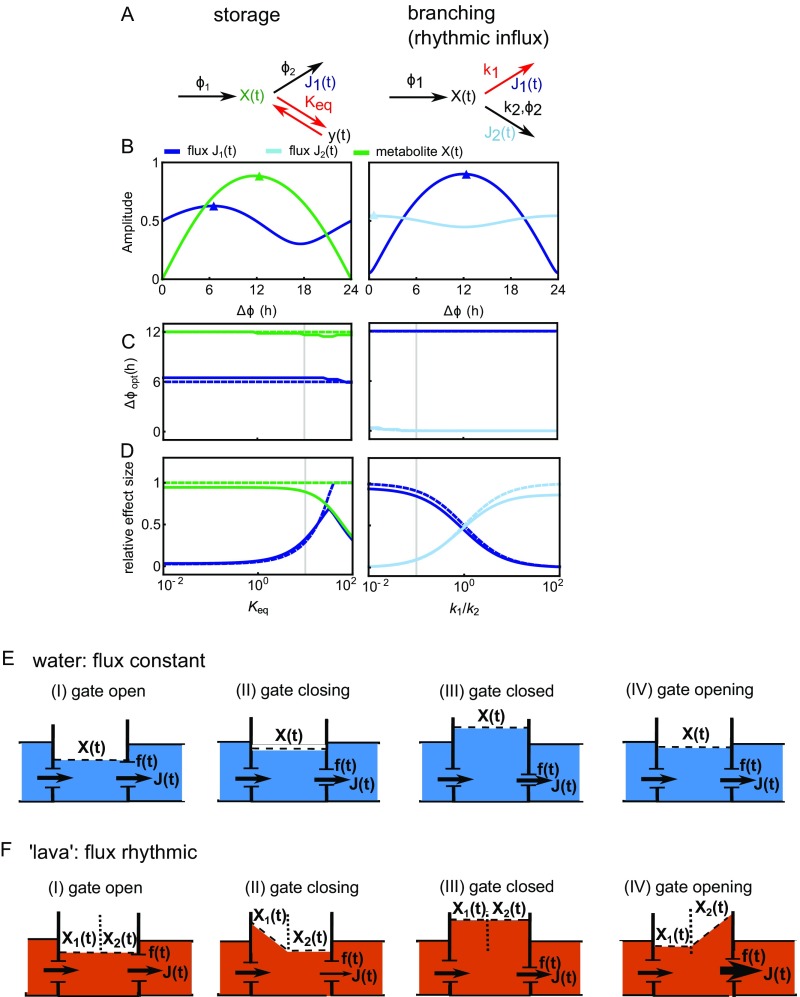
Supplementary analysis of circadian network motifs and floodgate cartoon of circadian degradation. (A–D) Analysis of additional metabolic network motifs (Fig. 2). (E and F) The flux through a circadian reaction chain is illustrated by the floodgate analogy. The water level represents the metabolite(s) , the outward flow (amount of water per unit time) represents the flux , and the size of the floodgates represents the reaction coefficient. Here, the left floodgate (influx) is constant, and the right floodgate rhythmically changes size (Eq. 1). If the system is allowed to equilibrate rapidly (E), the flux is constant, because and are exactly balanced, and oscillations cancel out. This situation corresponds to a single irreversible reaction with fast average reaction rate (Fig. 2, irreversible reaction). If the system flow is delayed (F; e.g., because of a more viscous fluid, like lava or honey), then the outward flux is smaller while the gate is closing and larger while the gate is opening, which is illustrated by the arrow thickness. This situation corresponds to a linear chain with backward reaction , where the 6-h rule applies (Fig. 2, linear chain).
Fig. S3.
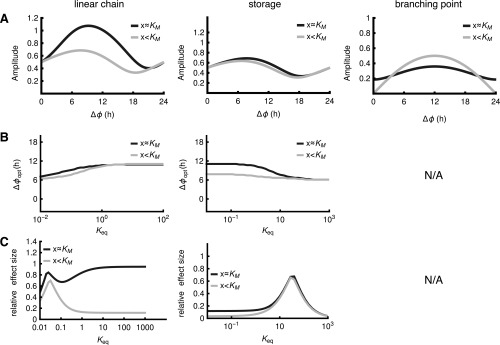
Circadian network motifs with Michaelis–Menten kinetics. (A–C) By substituting in the formulas describing the network motifs (SI Appendix) for the linear chain , the storage motif , and the branching point , the effects of Michaelis–Menten kinetics were investigated. The plots should be compared with Fig. 2 and Fig. S2. For all cases, parameters were chosen, so that the steady-state derivative of the Michaelis–Menten equation equals 10 for clean comparisons with Fig. 2 and Fig. S2. For each case, two scenarios were computed, with the metabolite being either far below saturation or in the range , where the nonlinear nature of the equation is notable (lower value in the following). For the linear chain, , and , , respectively. For the storage motif, , and , , respectively. For the branching point, , and , , respectively. For the branching point, the steady state is dependent on as well, precluding a clean comparison with Fig. 2 and Fig. S2 (Datasets S1–S6) for the phase and effect size plots. N/A, not applicable.
The linear reaction chain is a classic network motif in metabolic pathway analysis and has been used to quantify control of glycolysis (22, 23, 26). Remarkably, we found that for linear chains, equals exactly 12 h for the metabolite and 6 h for the outward flux , independent of kinetic parameters (Fig. 2C, “linear chain” and SI Text). Thus, rhythmic modulations of inward and outward reactions induce rhythmic fluxes with high amplitude not when the first and last reactions are in phase, but when the last reaction lags behind by around 12 (metabolite) or 6 h (flux)—we will refer to this result as the 12-/6-h rule of circadian metabolic reaction chains. Intuitively, the 12-/6-h rule can be understood by a floodgate analogy (Fig. S2E), where the water level (metabolite) is high when the gate (outward reaction) is closed, and the flow of water out of the basin (flux) is not maximal when the gate is at maximal size but when the water level is also high. For irreversible reactions, the effect size of the metabolite is close to its theoretical maximum of 1 for reasonable values of the average rate coefficient ), but the effect size of the flux vanishes, except for very small values of (Fig. 2D). In the floodgate analogy, this phenomenon stems from the water level going down at the same time as the floodgates open, so that both effects almost cancel out for the flux. Thus, in irreversible reactions, the 6-h rule has little effect on the flux, which for not too slow reactions is entirely determined by the input reaction.
Importantly, the effect of the 6-h rule on the flux increases if a reversible reaction (Fig. 2D) (“linear chain”) or a storage metabolite (Fig. S2D) (“storage”) is added. In the linear chain motif, higher effects of the output reaction on the flux are obtained for small equilibrium constants (i.e., in cases where “backward reactions” are faster) (Fig. 2C). Similarly, in the storage motif (e.g., lactate storage in glucose metabolism), an equilibrium shifted to the metabolite outside the chain leads to a higher effect size (Fig. S2D). In both cases (storage and chain), the additional equilibrium is analogous to an energy barrier, which the reaction chain has to overcome. In the floodgate analogy, this phenomenon corresponds to a more viscous fluid (e.g., honey or lava) instead of water (Fig. S2F), which induces a delay in the last reaction of the chain with respect to gate opening.
In metabolic networks, linear chains are often accompanied by feedback regulation and branching points. We found that both positive and negative feedback increase the flux effect size for moderate feedback strength, at the same time modulating (Fig. 2 C and D, “feedback”). Interestingly, feedback does not change for the metabolites, and only positive feedback increases the metabolite effect size. For the branching point, as expected from the simulation in Fig. 1B, we found (Dataset S2 and SI Appendix) that equals 0 h for the flux through the branch in which the reaction is rhythmic and 12 h for the flux through the alternative branch (Fig. 2 B and C). Interestingly, the effect size is small for the metabolite if the average reaction coefficients of both branches differ substantially. There is, however, always a consistent effect of oscillations in both enzyme activities on the flux through at least one branch, even for large differences (). Notably, synergy does not take place in the branching point motif: amplitudes in the fluxes or the metabolite concentration never exceed the amplitudes of any of the individual enzyme activity rhythms (Fig. 2 B and D and SI Text).
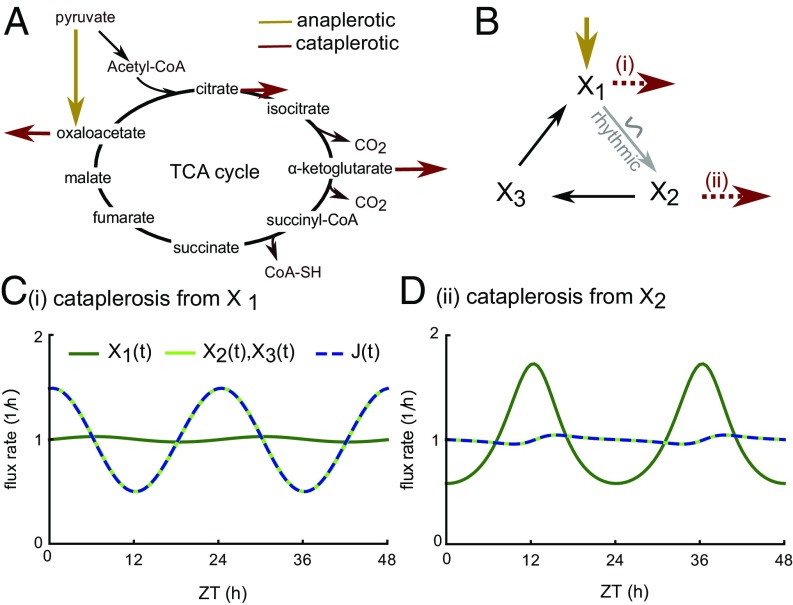
The somewhat counterintuitive properties of branching points has important consequences for rhythmic control of metabolic cycles. On the 24-h timescale, cycles, such as the TCA (Fig. 3A) or urea cycles, generally have significant replenishment and removal fluxes [so-called anaplerotic and cataplerotic fluxes, respectively (27)]. Thus, a cycle can be described as a series of branching points (Fig. 3B). Considering a cycle with only one cataplerotic reaction and applying the quantitative description of branching points, we concluded that rhythmic activity of an enzyme in a cycle can only lead to one of two scenarios. (i) If there is cataplerosis from the rhythmically consumed metabolite, all fluxes and all metabolites, except the rhythmically consumed one, are rhythmic (Fig. 3C). (ii) If there is cataplerosis from one of the other metabolites, only the rhythmically consumed metabolite is rhythmic, and all other metabolites and all fluxes are nonrhythmic (Fig. 3D). In cases with several cataplerotic reactions, intermediate scenarios with strongly varying outcomes of enzyme activity may arise and can be expected (e.g., in the mouse liver TCA cycle, where several mitochondrial enzymes have rhythmic abundances) (28).
Fig. 3.
Analysis of a circadian metabolic cycle. (A) Illustration of anaplerotic (material replenishment) and cataplerotic (material removal) reactions in the TCA cycle. (B) Model scheme of a cycle with an anaplerotic reaction and a cataplerotic reaction either before or after a rhythmically modulated reaction (details are in SI Materials and Methods). (C and D) Model simulations normalized to unit mean with a cataplerotic reaction at either the rhythmically consumed metabolite (C) or another metabolite (D; here ).
In summary, common network motifs often induce considerable delays between enzyme activities and the resulting metabolites and fluxes. Such delays may occur despite the fact that enzyme-catalyzed reactions operate at much faster timescales than the 24-h circadian rhythm, and even for arbitrarily fast reactions (Fig. 2C and Fig. S2C). As a consequence, phase differences between several rhythmic enzymes in a reaction cascade can increase the flux and metabolite amplitudes.
Gene Expression Patterns in Muscle Glucose Metabolism Reveal Circadian Regulation of Key Enzymes.
After establishing the principles for circadian orchestration of metabolic network motifs, we asked to what extent such insights can be used in the study of physiologically important metabolic pathways. In particular, CRA revealed that phase lags between regulatory enzymes may be beneficial to obtain circadian fluxes and metabolites with appreciable amplitudes. Thus, we sought to investigate whether this is the case in a well-studied metabolic pathway, such as mammalian glucose metabolism. Notably, glucose metabolism operates quite differently in different organs. In mammalian circadian biology, many of the available datasets on circadian gene expression focus on mouse liver. However, in this organ, the situation is complex [e.g., glycolysis and gluconeogenesis can both occur (29)]. To enable a more rigorous analysis, we instead focused on mouse skeletal muscle, where glucose, to a large extent, is either directly metabolized via glycolysis and subsequent TCA cycle reactions or stored as glycogen for times of high demand (29, 30) (Fig. 4A). Alternative routes, like the pentose phosphate pathway, account only for 2% of muscle glucose metabolism, whereas lactate accumulation and glycogenesis from lactate occur only during and after heavy exercise (30, 31), and gluconeogenesis is limited by the inability of muscle cells to export glucose.
Fig. 4.
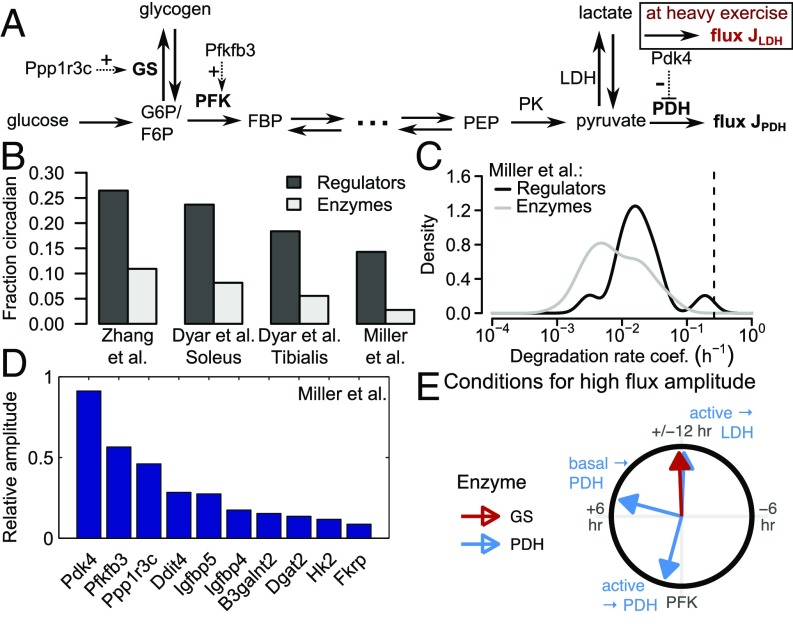
Circadian activity in enzymes of muscle glucose metabolism. (A) Schematic network of mammalian muscle glucose metabolism. FBP, fructose-1,6-bisphosphate; F6P, fructose-6-phosphate; PEP, phosphoenolpyruvate; PK, pyruvate kinase. (B–D) Analysis of the three datasets [Miller et al. (32), Zhang et al. (6), and Dyar et al. (18) (separate data for soleus and tibialis)] of circadian gene expression in muscle metabolism. (B) Fraction of circadian genes. (C) Degradation rate coefficients (15) of expressed genes. (D) Circadian genes of carbon metabolism with highest relative amplitudes (in C and D) [Fig. S4 shows data from Zhang et al. (6), and Dyar et al. (18)]. (E) Constraints in between PFK (reference phase) and GS, or PFK and PDH, for a highly rhythmic glycolytic target flux through either PDH or LDH (see SI Text for details). The values result from a simple model (Fig. S5A) based on h for the branching point in upper glycolysis (Fig. 2D) and an interval between 0.1 and 1 around our estimate for the overall equilibrium constant (Fig. S5A and Dataset S6).
Because circadian rhythms are primarily generated via rhythmic transcriptional activities, we investigated the circadian transcriptome of mouse skeletal muscle as reported in three independent studies (6, 18, 32). Applying standard criteria, we found that 15–20% of transcripts coding for enzyme regulatory proteins exhibited circadian rhythms as opposed to around 5% of transcripts coding for metabolic enzymes (in all datasets, , Fisher’s exact test) (Fig. 4B). Moreover, by analyzing publically available protein half-life data (15), we found that enzyme regulatory proteins have significantly shorter half-lives (Fig. 4C and Fig. S4A) (Mann–Whitney rank sum test, ) in a range permissive of circadian rhythms in protein concentration [i.e., below 50 h (3)]. Strikingly, in all three datasets (6, 18, 32), the transcripts Pdk4 (pyruvate dehydrogenase kinase 4), Pfkfb3 (6-phosphofructo-2-kinase/fructose-2,6-biphosphatase 3), and Ppp1r3c (protein phosphatase 1 regulatory subunit 3C) were circadian and interestingly exhibited markedly different phases. They were (except for Pdk4 in ref. 6) in the top five of circadian transcripts associated with core metabolism with respect to relative amplitude (Fig. 4D and Fig. S4 B and C). They were also almost the only transcripts associated with metabolism showing a high amplitude in all datasets (the only other transcript is Ddit4, which is part of a stress response pathway). The proteins coded by these three genes have a direct regulatory effect on key enzymes in glucose metabolism (Fig. 4A): PTG (the protein product of Ppp1r3c) stimulates glycogen synthesis, PFK2 (product of Pfkfb3) activates phosphofructokinase (PFK; the driving reaction of core glycolysis), and PDK4 inhibits the activity of pyruvate dehydrogenase (PDH; the irreversible reaction linking glycolysis and the TCA cycle) by phosphorylation. Hence, this analysis revealed a high likelihood that muscle glucose metabolism is subject to circadian oscillations.
Fig. S4.
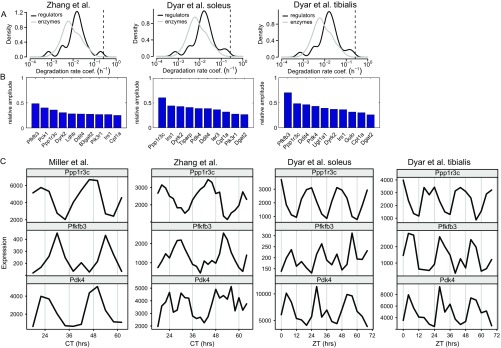
Supplementary analysis of circadian gene transcription in mouse muscle. Additional analysis of the data published by Miller et al. (32), Dyar et al. (18), and Zhang et al. (6) (Fig. 4). (A) Degradation rates of expressed transcripts (compare Fig. 4C). (B) Circadian transcripts of carbon metabolism with highest relative amplitudes (compare Fig. 4D). (C) Time series of the transcripts with consistently high circadian amplitude.
In metabolic pathways, it is widely believed that the flux through a pathway is subject to evolutionary optimization, because it determines how fast energy and essential metabolites become available to the host organism (13, 33). This hypothesis certainly applies to the muscle, where fast energy availability is essential for adequate reactions to the environment. Indeed, at heavy exercise, the glycolytic flux is increased by orders of magnitudes within seconds (34). Therefore, we hypothesized that the circadian transcripts regulating enzyme activities in glucose metabolism might serve to generate rhythms in the glycolytic flux.
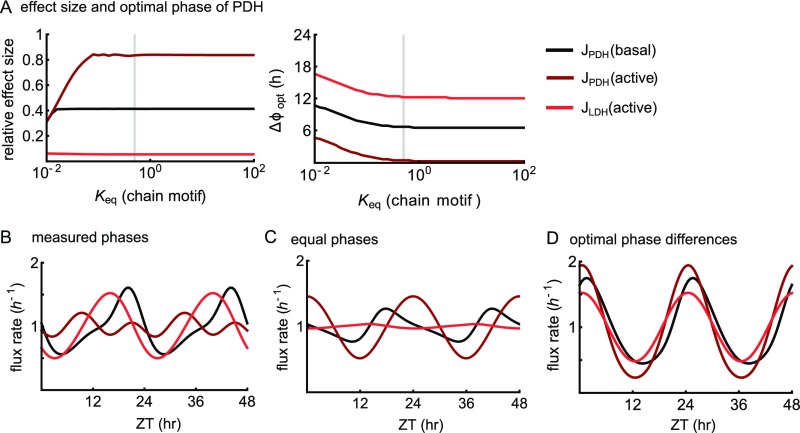
Muscle glucose metabolism can be described as a composition of three metabolic motifs (Figs. 2A and 4A) around three enzymes with activities that are most likely circadian: a branching point at glucose-6-phosphate [G6P; influx from glucose and glycogen and outflux through either PFK or glycogen synthase (GS)], a linear chain between G6P and pyruvate, and a storage metabolite or branching point right before the outflux through PDH and possibly, lactate dehydrogenase (LDH). The nature of the last motif depends on the model of glucose metabolism: At rest (“basal state”), lactate is not exported (34), and the glycolytic flux operates almost entirely through PDH, which yields the storage motif. At heavy exercise (“active state”), lactate is exported by the muscle and processed inside the liver (Cori cycle) (29, 34), resulting in the branching point motif. Based on these considerations, we developed a simplified mathematical model of glucose metabolism (Fig. S5 and SI Text) and derived conditions for high amplitudes of the glycolytic flux (Fig. 4E): PFK and GS should be in antiphase because of the branching point motif (Fig. 2C), and PDH should lag behind PFK by 1, 7, or 12 h depending on basal or active state and whether the flux through PDH or LDH is considered.
Fig. S5.
Conceptual model of circadian muscle glucose metabolism (Fig. 4A and SI Text). (A) Effect size and optimal phase difference between PFK and PDH for high amplitude of the glycolytic flux through PDH (basal or active mode) and LDH (active mode). Gray vertical lines indicate our estimated values (Dataset S6) for the overall equilibrium in the middle part of glycolysis. (B–D) Model simulations using (B) measured (Fig. 5), (C) equal, and (D) “optimal” (according to the conditions in Fig. 4E) times of peak activity for the circadian PFK, GS, and PDH reactions.
Circadian Enzymes Regulating Muscle Glucose Metabolism Have Widely Different Times of Peak Activity.
Because enzymatic activities are delayed with respect to protein expression (3) and may depend on a variety of activating and deactivating factors, the gene expression profiles analyzed above can only serve as a first hint toward circadian activity of an enzyme, which must be determined directly by enzyme activity assays. We therefore turned to assess the circadian activity of the enzymes most likely contributing to a circadian glycolytic flux (GS, PFK, and PD) (Fig. 4D and Fig. S4B).
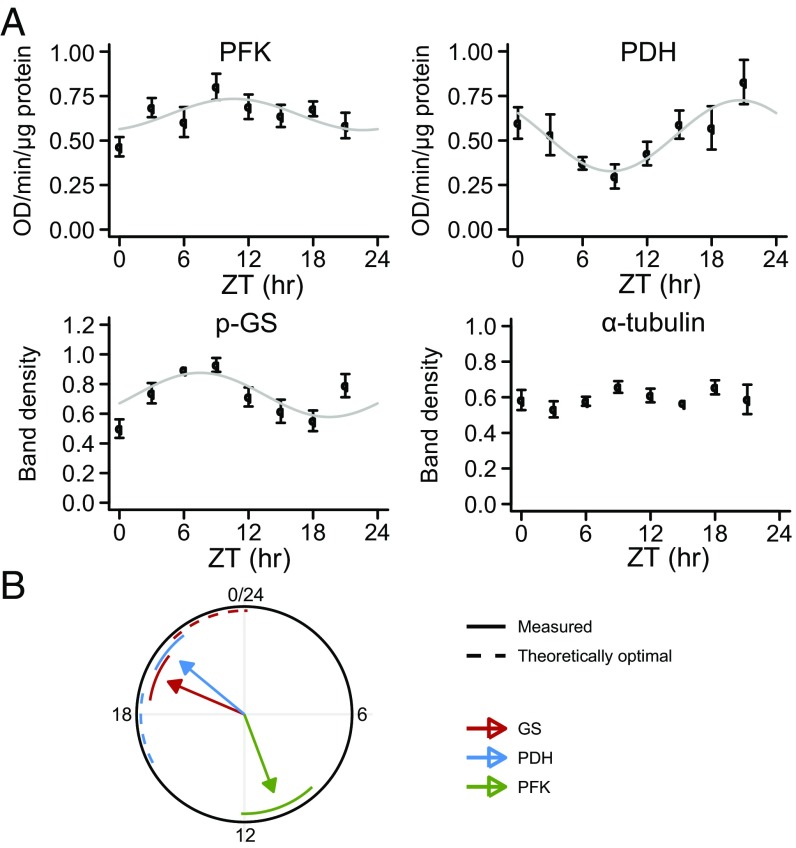
For this purpose, we assayed the change of activities of these enzymes over a 24-h period in mice entrained to a 24-h light/dark cycle (Fig. 5A and Fig. S6 A and B). To evaluate rhythmicity, we used two independent statistical methods: a nonparametric method implemented in the software package RAIN (35) and harmonic regression (3). P values were combined using Fisher’s method (36). We found that PFK , PDH , and phosphoglycogen synthase (p-GS) , but not the housekeeping protein α-tubulin , show pronounced circadian activity (or protein abundance). The times of peak activity or abundance were zeitgeber time (ZT) 11 (PFK), ZT 21 (PDH), and ZT 8 h (p-GS), corresponding well to transcript-based expectations (Fig. S6C). Because p-GS is the inactive form of GS, it corresponds to an estimated time of peak activity around ZT 20 h for GS activity.
Fig. 5.
Circadian activities of key enzymes in glucose metabolism. (A) Measurement of circadian enzyme activities in mouse muscle over a 24-h light/dark cycle. PDH and PFK enzyme activities were measured directly; p-GS (inactive fraction of total GS) and α-tubulin were analyzed by Western blot (Fig. S6). All data are based on a single experiment with six biological replicates per time point (error bars: SEM). (B) Illustration of measured phases (solid arrows; SEM given as circle segments) compared with theoretically optimal phases for maximal flux amplitudes through the PDH-catalyzed reaction at basal metabolism (Fig. 4E).
Fig. S6.
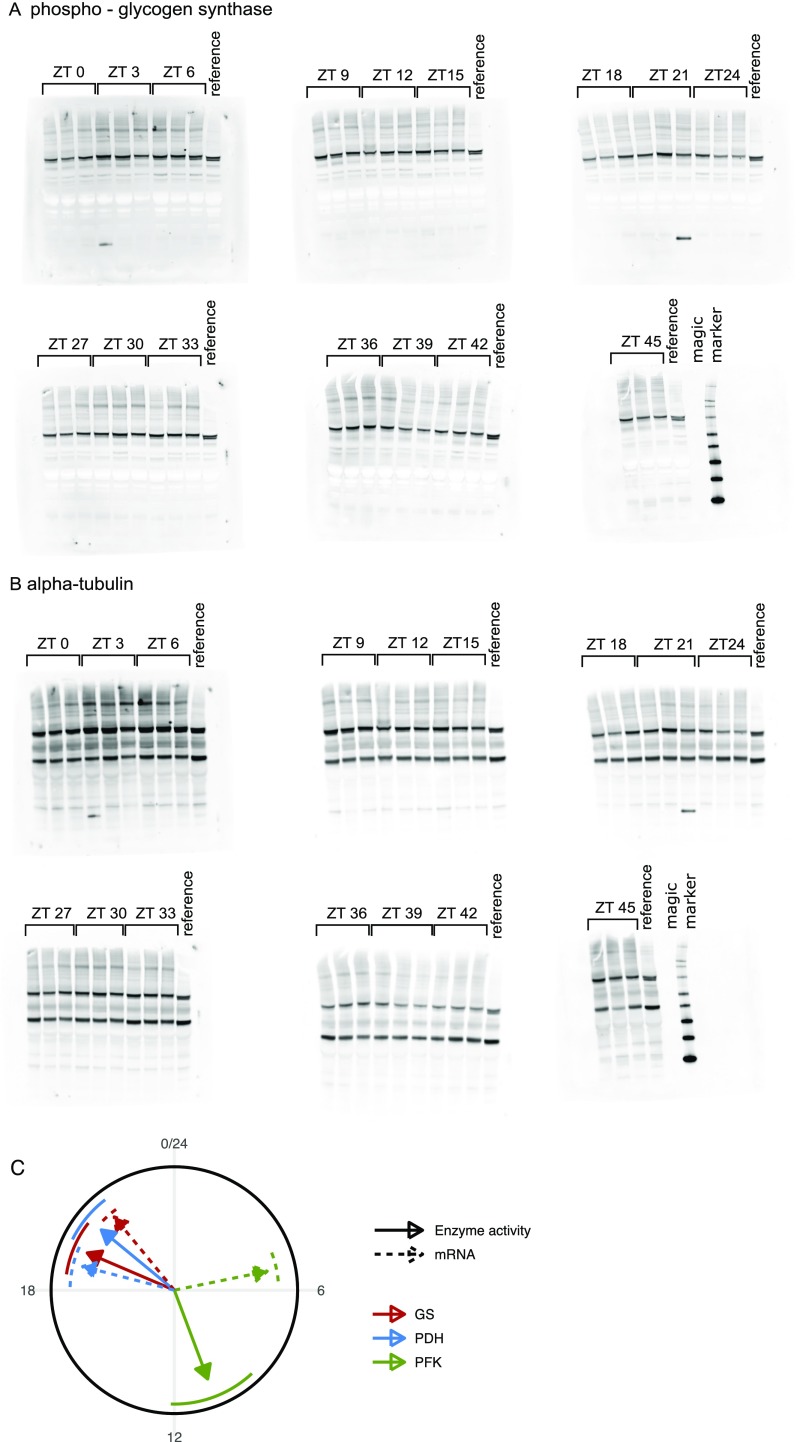
Raw data and supplementary analysis of circadian muscle enzyme activities. Western blots of (A) p-GS and (B) -tubulin used for quantitative analysis in Fig. 5. In each blot, the columns show triplicates (3 mice) for the indicated time points (i.e., 48 mice in total) and a reference probe (protein lysate). The last blots in both A and B also contain magic marker in the last column. Note that, for the analysis in Fig. 5, the equivalent time points (ZT 0 and 24 h and 3 and 27 h, etc.) were merged to show a series ZT 0–24 h with n = 6 biological replicates. (C) Illustration of mRNA abundance and enzyme activity phases. Phases and SEMs of enzyme activities (solid arrows, with SEM as circle segments) were estimated by harmonic regression (R package HarmonicRegression); GS activity was inferred as p-GS plus 12 h. Enzyme activity phases corresponded well to phases predicted by transcript abundances [here from tibialis anterior muscles; Dyar et al. (18)]: Pfkfb3 being used as proxy for PFK activity, Pdk4 + 12 h being used for PDH activity, and Ppp1r3c being used for GS activity.
Hence, the time of peak activity of PFK, sometimes considered a rate-determining step in glycolysis, showed large phase lags toward two other key enzymes of glucose metabolism: GS and PDH. This finding is consistent with phase optimization for large amplitudes according to our theoretical analysis based on CRA (Fig. 5B): PFK and GS reactions with nearly antiphasic activities lead to maximal amplitude of the flux through both of these reactions. Furthermore, the phase difference between PFK and PDH of about 10 h implies high amplitudes for the flux through LDH at heavy exercise as well as the flux through PDH at rest. The flux through PDH at heavy workload is, however, predicted to be almost constant according to these measurements and our analysis.
Discussion
We investigated the consequences of circadian rhythms in enzyme activities for metabolite concentrations and metabolic fluxes through reactions and pathways. In particular, we investigated common pathway motifs, which are building blocks that suffice to construct almost arbitrary pathways (25). By understanding circadian control of these building blocks, one may infer the circadian control properties of much more complex pathways, such as we exemplified here with muscle glucose metabolism. A key insight was that, although metabolic reactions occur at much faster timescales than circadian rhythms, there are large time lags between enzyme activity rhythms on the one hand and concentrations and fluxes on the other hand. As a consequence, rhythmicity in fluxes and concentrations is not necessarily maximal if enzyme activities are rhythmic with the same phase, but rather, phase differences of the order of 6–12 h in enzyme activities are necessary for synergistic amplitude amplification effects. Finally, we measured enzyme activity rhythms in mouse skeletal muscle, and indeed found large phase differences in circadian enzyme activities.
The precise function of circadian rhythms for metabolism is still unclear. One concept, which we adopted in most of this study, is that a rhythmic metabolic flux is advantageous, because it provides higher energy supply at times when high demand is more likely (37). We speculate that the basal glycolytic rate is, along these lines, strongly circadian, while at the same time, retaining a constant capacity for immediate heavy workload requirement as suggested by our CRA computations and enzyme activity measurements. This view complies with the idea that the flux through a pathway is subject to evolutionary optimization, much more so than the efficiency (14). Nevertheless, another possibility is that constant fluxes and concentrations are desirable for the organism. Here, the function of rhythmic enzyme activities could be to eliminate rhythms that arise from high energy demand at times of high activity (38). In that case, for muscle glucose metabolism, environmentally dependent circadian variations in glucose supply would be superimposed on the rhythmic basal glycolysis capacity.
The theoretical insights that we derived for rhythmically modulated branching points, linear chains, and cycles are generally applicable and can be used for any reactions and pathways consisting of these building blocks. Experience from decades of work in standard MCA theory has shown that a plethora of cellular metabolic pathways can be described by the motifs studied in this work (24). However, a major bottleneck remains in the experimental identification of enzyme activities. A high-throughput method is not yet available, and measurements have to be performed for each enzyme individually, such as in this study (Fig. 5). Here, our observation that regulatory proteins rather than enzymes are the most likely points of circadian control (Fig. S1A) might serve as a useful guiding principle when identifying promising candidate circadian reactions based on transcriptomics or proteomics data. In future research, this approach can be combined with principles derived from CRA to extend computational methods for indirect measurement of metabolic fluxes (39) in circadian reaction networks. Moreover, the circadian regulation of other biological networks, such as signal transduction or cell-to-cell communication, is also governed by similar organization principles and can be analyzed by CRA in future research.
Materials and Methods
CRA.
The light/dark cycle is described by a 24-h period (ZT), with lights on at ZT 0–12 h and lights off at ZT 12–24 h (Fig. 1A). Consider a metabolic reaction network consisting of metabolites , . We describe periodically modulated reaction rate coefficients by functions of the form
| [1] |
that is, by their time-averaged value (average rate coefficient) and sinusoids with relative amplitude , circadian frequency h), and phase . By this definition, the circadian phase in hours ZT equals . Metabolite concentrations and fluxes [each flux has the form , representing linearized standard kinetics (12)] can be approximated by periodic modulations around the nonoscillatory steady state (21):
| [2] |
where and are estimates for their time-averaged values. In a linear approximation, the relation between input and output amplitudes and phases can be represented by vector algebra (Fig. S1C). The angle of each vector represents the phase, and the length represents the relative amplitude. Each periodic reaction generates a periodic modulation in the metabolites and fluxes, with effective phases and and effective amplitudes and . The combined effect of all circadian reactions giving rise to the final values is given by superposition in phase space. Importantly, because the circadian frequency is typically much smaller than most metabolic reaction rate coefficients (Fig. S1B), we applied the assumption
| [3] |
which allowed us to derive simple expressions for the response coefficients of metabolic motifs (SI Appendix). For detailed derivations and Mathematica notebooks implementing CRA, see SI Text and Datasets S1 and S2.
Optimal Phase Difference and Effect Size.
The amplitudes and (Eq. 2) of the metabolites and fluxes in periodically modulated metabolic networks attain maximal values when and , respectively. We studied metabolic motifs with two circadian reactions (Fig. 2 and Fig. S2) with phase difference . The optimal phase difference for maximal metabolite or flux amplitude is , . If this optimal phase difference is achieved, then the corresponding (maximal) amplitude is given by , and the minimal amplitude is reached when the two effective phases are misaligned, which yields (analogously for the fluxes). We defined the effect size (Fig. 2C and Fig. S2C) as , .
In many cases, several enzymes with moderate individual activity rhythms may together cause larger rhythms in metabolite concentrations and fluxes, provided that the enzyme activity phases are properly aligned (SI Text).
Experimental Procedures, Data Analysis, and Mathematical Models.
C57BL/6J mice (male; 8 wk old) were entrained for 2 wk to 12-h/12-h light/dark cycles before being euthanized at time points ZT 0, 3, 6, , 24 h . All animal studies were conducted in accordance with our regional committee for ethics in animal experimentation. The activities of PDH and PFK were assayed using the PDH Activity Assay Kit from EMD Millipore (Merck KGaA) and the PFK Colorimetric Assay Kit from BioVision according to the manufacturers’ instructions. The activity of GS was monitored by Western blot against anti–p-GS antibody.
To identify circadian transcript abundances, we used published microarray data (6, 18, 32) and selected carbohydrate enzyme regulatory proteins and carbohydrate metabolic enzymes by corresponding GO terms. Linearized rate coefficients for enzyme-catalyzed reactions (Fig. S1B) were obtained from a collection of enzyme and values (40). Phases (with SEM) and amplitudes for all data were estimated using harmonic regression (3).
Mathematical models of metabolic network motifs as well as the reduced models of the TCA cycle and glycolysis were obtained by mass action kinetics (equations in SI Materials and Methods or SI Appendix), with average reaction rate coefficients set to 10 (compare Fig. S1B) and relative amplitudes of 0.5 unless stated otherwise. For variations in , was held constant at 300 , and was varied.
Extended methods are available in SI Materials and Methods.
SI Text
SI Materials and Methods
Animals.
C57BL/6J mice (male; 8 wk old) were purchased from Janvier Laboratories (France). Animals were entrained for 2 wk to 12-h/12-h light/dark cycles before being euthanized by cervical dislocation three at a time at time points ZT 0, 3, 6, , 24 h spanning 24 h. Hind limb skeletal muscle was excised, quickly flash-frozen in liquid nitrogen, and stored at − 80°C until further processing.
Enzyme Activities.
Muscle samples with a weight of 300–400 mg were homogenized in 450- to 600-L PBS using the gentleMACS Dissociator (Miltenyi Biotec). PDH activity was assayed using the PDH Activity Assay Kit from EMD Millipore (Merck KGaA) and PFK activity was measured using the PFK Colorimetric Assay Kit from BioVision according to the manufacturers’ instructions. Enzyme activities were normalized by the total amount of protein obtained by a BCA Test (EMD Millipore).
Western Blots.
Muscle samples with a weight of 50–150 mg were homogenized in 500- to 1,000-L RIPA buffer [PBS with 1% Igepal CA-630, 0.5% Na-Deoxycholat, 0.1% SDS, 1:100 protease inhibitor P8340, 1:100 phosphatase inhibitor P2850 (Sigma-Aldrich)] as above. Western blots were performed with anti–p-GS antibody (muscle; Ser640, 07-1414; Merck Chemicals GmbH) and anti–-tubulin (Santa Cruz). For quantitative analysis, the free software package ImageJ was used.
Bioinformatic and Statistical Analyses.
We used published microarray data (6, 18, 32) to identify circadian transcript abundances [criteria: Benjamini–Hochberg-adjusted P value 0.2 computed with RAIN (35) and mean and relative amplitudes as estimated by harmonic regression (3) greater than 64 and 0.15, respectively]. Background sets of constitutively expressed transcripts consisted of those transcripts with a mean expression level greater than 64 and an unadjusted RAIN P value greater than 0.33.
Transcripts coding for carbohydrate enzyme regulatory proteins was selected using gene ontology (GO) term GO:0010675 (regulation of cellular carbohydrate metabolic process) but excluded those additionally annotated with the term GO:0006355 (regulation of transcription, DNA-templated) to focus on direct regulation not taking the route via secondary mRNA synthesis (in Fig. 4D, the protein product of Pfkfb3 was added to the set of regulatory proteins to compare relative amplitudes of candidate transcripts). Transcripts coding for carbohydrate metabolic enzymes was selected using GO terms GO:0003824 (catalytic activity) and GO:0005975 (carbohydrate metabolic process) but excluded those additionally annotated with the term GO:0010675 to exclude regulatory proteins. Brainarray, version 18 and Bioconductor, version 3.3 were used for the analyses.
Linearized rate constants for enzyme-catalyzed reactions (Fig. S1B) were obtained from an extensive literature collection of enzyme and values (40); values for Mus musculus and Rattus norvegicus were retained. To obtain values, values were multiplied by enzyme concentrations, in turn calculated from protein numbers estimated in fibroblasts (15) assuming a cell volume of 4,000 . To estimate rate constants, the standard linear approximation was used.
Enzyme activity measurements were evaluated for rhythmicity using both RAIN and harmonic regression. RAIN P values were for p-GS, PFK, and PDH: , 0.0044, and , respectively. Harmonic regression P values were 0.0015, 0.047, and , respectively. P values were combined using Fisher’s method and are reported in the text.
Conceptual Model of a Metabolic Cycle.
In Fig. 3, a mathematical model of a metabolic cycle (like the TCA cycle) is analyzed. The model is formulated by mass action kinetics with circadian reaction rates as in Eq. 1. The model equations are as follows:
| [S1] |
In the case of cataplerosis from the rhythmically consumed metabolite (Fig. 3C), we set , and in the case of cataplerosis from the rhythmically produced metabolite (Fig. 3B), we set .
Detailed Description of CRA
General Methodology Applied to Irreversible Reactions.
To introduce the method, we start with the simple case of two sequential circadian irreversible reactions. That means that we assume periodic input and output reactions and acting on a metabolite :
| [S2] |
Note that, for shorter notation, we write here instead of used in the main text and SI Appendix, and we denote the metabolite with small . Without loss of generality, we write the periodic input functions in the form
| [S3] |
where and are the mean reaction rates. The dimensionless circadian input functions are both periodic with circadian frequency . They can be thought of a sinusoids , (Materials and Methods, Eq. 1), although this assumption is not strictly necessary for the following analysis.
Rescaling Eq. S2 by its nonoscillatory steady state, the magnitude (i.e., ), we obtain
| [S4] |
A closed form solution of Eq. S4 does not exist because of the product term . A linear approximation can be obtained by omitting the constant terms and the product term in Eq. S4:
| [S5] |
Formally, Eq. S5 is a Taylor expansion in around the nonoscillatory steady state. Eq. S5 has a periodic solution with circadian frequency , which can be obtained by switching to variables in phase space . The derivative in time space is equivalent to multiplication by in phase space, yielding
| [S6] |
where we applied as approximation for the magnitude.
Similar to the metabolite, we obtain the periodic part of the flux by rescaling to the nonoscillatory steady-state :
| [S7] |
where the approximation is obtained by a first-order Taylor approximation as above. Thus, in phase space, we obtain the linear approximation for the flux, , and with help of Eq. S6,
| [S8] |
Because Eqs. S6 and S8 are linear in the input functions and , we can define scaled response coefficients analogous to MCA (24):
| [S9] |
Note that in SI Appendix we use the notation , where the index corresponds to the input function . The response coefficients measure how the metabolite and the flux are changed because of circadian oscillations of the enzyme activities and . Because they are complex numbers with absolute value and phase , the response coefficients can be interpreted as periodic response functions (Fig. S1C). In the case of sinusoidal input functions , , back-transform to scaled variables in time space can be performed by
| [S10] |
and similar for the flux. In our case of the irreversible reaction chain, the phases and amplitudes of the response functions (Eq. S9) are (as summarized in SI Appendix)
| [S11] |
Of note, plugging those response functions into the back-transform (Eq. S10), we recover our previous analysis of rhythmic production and degradation based on Fourier balancing (3) to first order in .
The 12-/6-h Rules of Circadian Metabolic Reaction Chains.
By CRA, we found that the phase responses to input and output reactions of metabolic reaction chains are approximately , where is the turnover time as defined by Easterby (41) (Eq. S11 shows this result for a simple irreversible reaction; see Dataset S1 and SI Appendix). However, the optimal phases for high amplitudes in the fluxes or metabolites depend only on the phase difference between the two circadian reactions (Materials and Methods). Therefore, we conclude that the optimal phases for high amplitudes in metabolites and fluxes are exactly
| [S12] |
This result entails that, for metabolic reaction chains, maximal amplitudes are never obtained if all reactions are in phase.
Synergy.
Generally, when flux or metabolite amplitude response coefficients for a pair of enzyme-catalyzed reactions, there may be synergy: if phases are aligned properly, two enzymes with moderate activity rhythms together generate a more pronounced flux or concentration rhythm. Such synergy occurs in several motifs (compare SI Appendix), although notably not for the branches of branching points. Any synergism becomes more moderate (sublinear) when enzyme activity amplitudes approach one: relative amplitudes in fluxes or concentrations cannot exceed one, and the linear approximation becomes less accurate.
Matrix Formalism for Systems with Several Metabolites and Fluxes.
For larger systems, it is not practical to derive the linear approximation step by step as shown for the sequence of irreversible reactions above. Rather, we adopt the matrix formalism originally developed for MCA, which was adapted to periodic input functions by Ingalls (21) as follows for unscaled response coefficients (note some typos in the original publication):
| [S13] |
Here, is the identity matrix of appropriate dimension, is the vector of fluxes, and is the vector of rate parameters. is the part of the stoichiometric matrix that is linearly independent, and is an appropriately defined link matrix, which is the identity matrix if . For example, in the case of the irreversible reactions, , , and . Derivatives are taken at the nonoscillatory steady state.
The matrix formalism combined with the fast reaction approximation (see above) allow for rapid calculation of all response coefficients in larger systems, such as the linear chain, branching point, and storage motifs (Mathematica source code provided in Datasets S1 and S2). For convenience, we summarize the final results in SI Appendix.
Overall Turnover Time .
Interestingly, the phase response of the linear chain and storage motifs does not depend on all rate constants individually, but only on the overall reaction time as defined by Easterby (41) (last expression for metabolites):
| [S14] |
The amplitudes depend on ratios between , , and .
The phase equations for the single irreversible reaction thus have an intuitive generalization. Instead of , we obtain , where is the turnover time of the chain. The phase rules arising from the differences between input and output are also conserved. The flux amplitude is dominated by the input reaction, similar to the case . However, it can now have values significantly larger than zero depending on the equilibrium constant of the intermediate reaction. If , the output reaction is equally important as the input reaction, even if the forward and backward reactions are both faster than .
Michaelis–Menten Kinetics.
So far, linear kinetics has been assumed when deriving phase and amplitude responses of fluxes and metabolites to circadian reaction rates. However, enzyme-catalyzed irreversible reactions are very often well-described by Michaelis–Menten reaction rate equations:
| [S15] |
Eq. S15 approaches linear kinetics when but deviates from linear kinetics otherwise. We found that, for the linear chain and the branching point with the outflux having the Michaelis–Menten form, exactly the same equations as for the linear case were nevertheless recovered by CRA for the amplitude and phase responses (Datasets S3–S5). The only difference is that the linear rate constant for the outflux is replaced by the derivative of the Michaelis–Menten rate equation taken at steady state: . For the branching point, the analytical expressions for the response coefficients were much more involved, but using CRA without an explicit steady-state concentration of the metabolite in terms of model parameters again yielded expressions similar to the linear case. Numerical solutions of the three network motifs with Michaelis–Menten kinetics and oscillations in the catalytic activity () confirmed that the main results (e.g., the 6-h rule for flux for the linear chain and the storage motif) indeed approximately hold true regardless of the kinetics being on linear or Michaelis–Menten form (Fig. S3). A notable difference is that the effect size is large over wider regions of for the Michaelis–Menten case when the steady-state value of the metabolite concentration approaches : The phase relationship for enzymes approaching saturation becomes even more important in the Michaelis–Menten case.
Enzymatic Inhibition or Activation.
Enzyme kinetics of the Michaelis–Menten type that account for modifiers (inhibitors and activators) have the form
| [S16] |
where is the maximal enzyme activity, and is a function of the (here) scaled substrate concentration and a regulatory species . For example, the rate equation for competitive inhibition by is . In the case of a circadian enzyme, the maximal activity, the substrate, and the regulatory species are all time-dependent:
| [S17] |
To keep matters simple, we reconsider the motif of rhythmic irreversible production and degradation of a metabolite but now with feedback and feed-forward regulation:
| [S18] |
where , are now the maximal rates of production and degradation, and , are general expressions of enzyme regulation. Note that and depend on time only via the time dependence of , because regulatory species that are not part of the considered reaction network are assumed to enter an effective as in the linear theory above.
Next, we linearize the above expression by assuming and , and we derive in the same way as above (Eq. S6):
| [S19] |
where we used the steady-state relation and the abbreviation . Note that Eq. S6 is recovered by setting and .
The linear approximation of the scaled oscillatory part of the flux is
| [S20] |
and with Eq. S19, we obtain the response coefficients
| [S21] |
For convenience of the reader, we give the resulting amplitude and phase responses explicitly in SI Appendix.
We find that the phase difference for the metabolite is
| [S22] |
such as without enzymatic regulation, and
| [S23] |
for the flux. Therefore, the phase relation is independent of feed-forward regulation, but feedback modulates the phase relationship. Negative feedback () evokes a compensating phase delay up to 6 h (i.e., for strong negative feedback, the phase response equals zero), and positive feedback evokes a phase advance (i.e., for strong positive feedback, the phase difference is 12 h). As for the amplitude responses (SI Appendix), the flux amplitude response increases with feedback, and feed-forward regulation has opposing effects on the amplitude responses on input and output.
Conceptual Model of Circadian Muscle Glucose Metabolism
As discussed in the main text, there are reasons to believe that circadian enzymes are regulated in such a way as to generate a circadian glycolytic flux with appreciable amplitude. Therefore, we sought to identify conditions (i.e., phase relationships between key enzymes) that allow for circadian rhythms with high amplitudes in the glycolytic flux (Fig. 4E). Here, we describe in detail how we derived those conditions.
Model Description.
To rationalize the consequences of circadian rhythms in enzyme activities in a specific model system, we developed a simplified mathematical model of glucose metabolism (Fig. 4A). The linearized model is based on the following considerations:
-
•
Hexokinase (HK) and glycogen phosphorylase (GP) are assumed to be saturated. Accordingly, both the HK and GP reactions are summarized by a constant influx of phosphorylated glucose molecules (). Thus, the upper part of glycolysis resembles a branching point (constant influx and outflux via either PFK or GS).
-
•
The PFK and pyruvate kinase (PK) reactions are irreversible, and therefore separate the upper and middle parts and the middle and lower parts of glycolysis, respectively.
-
•
The middle part of glycolysis between dihydroxyacetone phosphate (DHAP) and phosphoenolpyruvate (PEP) operates close to equilibrium, and is therefore represented by an overall reversible reaction (an estimation of is in Dataset S3).
-
•
In resting mode, lactate is not further metabolized, and as the LDH reaction is reversible this situation resembles the storage motif.
-
•
At heavy exercise, higher LDH activity in the direction of lactate results in accumulation and export of lactate to the bloodstream. Thus, in this situation, lower glycolysis resembles another branching point rather than storage.
The model equations are as follows:
| [S24] |
Here, , , , , (Fig. 4A), and the GS, PFK, and PDH reactions are circadian with periodic rates (Eq. 1). F6P is fructose-6-phosphate, and FBP is fructose-1,6-bisphosphate.
Conditions for High Amplitudes in the Glycolytic Flux.
From the model stated above, we calculated the effect size and optimal phase difference for high amplitude of the glycolytic flux, (Fig. S5A), between the PFK and PDH reactions. As noted in the main text, we analyzed two cases. At rest (basal state), lactate is not exported, and the glycolytic flux operates almost entirely through PDH, which yields the storage motif. At heavy exercise (active state), lactate is exported by the muscle and processed inside the liver (Cori cycle), allowing for rapid availability of the two ATP molecules arising in the LDH reaction. Thus, the glycolytic flux is split between the PDH and LDH reactions, yielding a branching point with rhythms in the influx and only one branch (Fig. S2 A–D, branching with rhythmic influx).
Because of the linear chain motif (Fig. 2 C and D) in the middle part of glycolysis, and depend on the value of the overall equilibrium constant between the PFK and PK reactions. We found an estimate by analysis of published data (Dataset S6) as shown in Fig. S5A, vertical line. With that value, the phase difference of PFK and PDH has a considerable influence on the flux amplitude in all cases, except the flux through LDH (Fig. S5A).
The value of between PFK and GS is always 12 h, irrespective of kinetic parameters, because of the branching point motif (Fig. 2C), and is 1, 7, or 12 h between PFK and PDH, depending on basal or active state and whether the flux through PDH or LDH is considered (Fig. S5A). The values of given above are exactly the phase relationships that are required for maximal amplitudes in the (hypothetical) circadian glycolytic flux, and therefore, we report them as “conditions for maximal flux amplitude” in the main text and Fig. 4E.
Comparison with Measured Enzyme Activities.
Compared with our conditions for a circadian glycolytic flux, the measured times of peak activity do comply with a high amplitude in the flux through PDH at rest or LDH at high activity, but not through PDH at high activity (Figs. 4E and 5B). Simulations of our simplified model of muscle glucose metabolism (Fig. S5 B–D) revealed that, in these two cases, the flux amplitudes are indeed much higher with the measured phases (Fig. S5B) than in simulations with equal phases (Fig. S5C) of PFK, GS, and PDH. Furthermore, the amplitudes with measured phases are close to those expected for the optimal phase differences (Fig. 4E and Fig. S5D), except for the flux through PDH in the active state. Note that this simulation can only serve to compare the amplitudes and phases at different conditions, because the enzymatic rates have not been measured in vivo. However, in our model, the measured phase differences are consistent with the hypothesis of evolutionary optimization of the glycolytic flux at rest to a circadian rhythm with high amplitude.
Supplementary Material
Acknowledgments
We thank Sarah Lück and Paul Thaben for help with mouse experiments, Hanspeter Herzel and Wolfram Liebermeister for discussions, and Satwik Rajaram and Marion Langen for critical reading of the manuscript. This work was supported by Research Fellowship of the Deutsche Forschungsgemeinschaft Grant TH 1861/1-1 (to K.T.) and German Ministry for Education and Research Grant 0315899 (to P.O.W.).
Footnotes
The authors declare no conflict of interest.
This article is a PNAS Direct Submission.
This article contains supporting information online at www.pnas.org/lookup/suppl/doi:10.1073/pnas.1613103114/-/DCSupplemental.
References
- 1.Green CB, Takahashi JS, Bass J. The meter of metabolism. Cell. 2008;134:728–742. doi: 10.1016/j.cell.2008.08.022. [DOI] [PMC free article] [PubMed] [Google Scholar]
- 2.Lück S, Westermark PO. Circadian mRNA expression: Insights from modeling and transcriptomics. Cell Mol Life Sci. 2015;73:497–521. doi: 10.1007/s00018-015-2072-2. [DOI] [PMC free article] [PubMed] [Google Scholar]
- 3.Lück S, Thurley K, Thaben PF, Westermark PO. Rhythmic degradation explains and unifies circadian transcriptome and proteome data. Cell Rep. 2014;9:741–751. doi: 10.1016/j.celrep.2014.09.021. [DOI] [PubMed] [Google Scholar]
- 4.Mauvoisin D, et al. Circadian clock-dependent and -independent rhythmic proteomes implement distinct diurnal functions in mouse liver. Proc Natl Acad Sci USA. 2014;111:167–172. doi: 10.1073/pnas.1314066111. [DOI] [PMC free article] [PubMed] [Google Scholar]
- 5.Robles MS, Cox J, Mann M. In-vivo quantitative proteomics reveals a key contribution of post-transcriptional mechanisms to the circadian regulation of liver metabolism. PLoS Genet. 2014;10:e1004047. doi: 10.1371/journal.pgen.1004047. [DOI] [PMC free article] [PubMed] [Google Scholar]
- 6.Zhang R, Lahens NF, Ballance HI, Hughes ME, Hogenesch JB. A circadian gene expression atlas in mammals: Implications for biology and medicine. Proc Natl Acad Sci USA. 2014;111:16219–16224. doi: 10.1073/pnas.1408886111. [DOI] [PMC free article] [PubMed] [Google Scholar]
- 7.Feuers RJ, et al. The effects of various lighting schedules upon the circadian rhythms of 23 liver or brain enzymes of C57BL/6J mice. Chronobiol Int. 1986;3:221–235. doi: 10.3109/07420528609079540. [DOI] [PubMed] [Google Scholar]
- 8.Civen M, Ulrich R, Trimmer BM, Brown CB. Circadian rhythms of liver enzymes and their relationship to enzyme induction. Science. 1967;157:1563–1564. doi: 10.1126/science.157.3796.1563. [DOI] [PubMed] [Google Scholar]
- 9.Dallmann R, Viola AU, Tarokh L, Cajochen C, Brown SA. The human circadian metabolome. Proc Natl Acad Sci USA. 2012;109:2625–2629. doi: 10.1073/pnas.1114410109. [DOI] [PMC free article] [PubMed] [Google Scholar]
- 10.Fustin JM, et al. Rhythmic nucleotide synthesis in the liver: Temporal segregation of metabolites. Cell Rep. 2012;1:341–349. doi: 10.1016/j.celrep.2012.03.001. [DOI] [PubMed] [Google Scholar]
- 11.Adamovich Y, et al. Resource: Circadian clocks and feeding time regulate the oscillations and levels of hepatic triglycerides. Cell Metab. 2014;19:319–330. doi: 10.1016/j.cmet.2013.12.016. [DOI] [PMC free article] [PubMed] [Google Scholar]
- 12.Cornish-Bowden A. 2012. Fundamentals of Enzyme Kinetics (Wiley-Blackwell, Weinheim, Germany), 4th Ed.
- 13.Zaslaver A, et al. Just-in-time transcription program in metabolic pathways. Nat Genet. 2004;36:486–491. doi: 10.1038/ng1348. [DOI] [PubMed] [Google Scholar]
- 14.Waddell TG, Repovic P, Melendez-Hevia E, Heinrich R, Montero F. Optimization of glycolysis: A new look at the efficiency of energy coupling. Biochem Edu. 1997;25:204–205. [Google Scholar]
- 15.Schwanhausser B, et al. Global quantification of mammalian gene expression control. Nature. 2011;473:337–342. doi: 10.1038/nature10098. [DOI] [PubMed] [Google Scholar]
- 16.Oster H, et al. The circadian rhythm of glucocorticoids is regulated by a gating mechanism residing in the adrenal cortical clock. Cell Metab. 2006;4:163–173. doi: 10.1016/j.cmet.2006.07.002. [DOI] [PubMed] [Google Scholar]
- 17.Panda S, et al. Coordinated transcription of key pathways in the mouse by the circadian clock. Cell. 2002;109:307–320. doi: 10.1016/s0092-8674(02)00722-5. [DOI] [PubMed] [Google Scholar]
- 18.Dyar KA, et al. Muscle insulin sensitivity and glucose metabolism are controlled by the intrinsic muscle clock. Mol Metab. 2014;3:29–41. doi: 10.1016/j.molmet.2013.10.005. [DOI] [PMC free article] [PubMed] [Google Scholar]
- 19.Eckel-Mahan KL, et al. Coordination of the transcriptome and metabolome by the circadian clock. Proc Natl Acad Sci USA. 2012;109:5541–5546. doi: 10.1073/pnas.1118726109. [DOI] [PMC free article] [PubMed] [Google Scholar]
- 20.Clarke CF, Fogelman AM, Edwards PA. Diurnal rhythm of rat liver mRNAs encoding 3-hydroxy-3-methyl-glutaryl coenzyme A reductase. J Biol Chem. 1984;259:10439–10447. [PubMed] [Google Scholar]
- 21.Ingalls BP. A frequency domain approach to sensitivity analysis of biochemical networks. J Phys Chem B. 2004;108:1143–1152. [Google Scholar]
- 22.Kacser H, Burns JA. The control of flux. Symp Soc Exp Biol. 1973;27:65–104. [PubMed] [Google Scholar]
- 23.Heinrich R, Rapoport TA. A linear steady-state treatment of enzymatic chains. General properties, control and effector strength. Eur J Biochem. 1974;42:89–95. doi: 10.1111/j.1432-1033.1974.tb03318.x. [DOI] [PubMed] [Google Scholar]
- 24.Heinrich R, Rapoport SM, Rapoport TA. Metabolic regulation and mathematical models. Prog Biophys Mol Biol. 1977;32:1–82. [PubMed] [Google Scholar]
- 25.Rohwer JM, Schuster S, Westerhoff HV. How to recognize monofunctional units in a metabolic system. J Theor Biol. 1996;179:213–228. doi: 10.1006/jtbi.1996.0062. [DOI] [PubMed] [Google Scholar]
- 26.Heinrich R, Holzhutter HG, Schuster S. A theoretical approach to the evolution and structural design of enzymatic networks; linear enzymatic chains, branched pathways and glycolysis of erythrocytes. Bull Math Biol. 1987;49:539–595. doi: 10.1016/s0092-8240(87)90003-6. [DOI] [PubMed] [Google Scholar]
- 27.Owen OE, Kalhan SC, Hanson RW. The key role of anaplerosis and cataplerosis for citric acid cycle function. J Biol Chem. 2002;277:30409–30412. doi: 10.1074/jbc.R200006200. [DOI] [PubMed] [Google Scholar]
- 28.Neufeld-Cohen A, et al. Circadian control of oscillations in mitochondrial rate-limiting enzymes and nutrient utilization by PERIOD proteins. Proc Natl Acad Sci USA. 2016;113(12):E1673–E1682. doi: 10.1073/pnas.1519650113. [DOI] [PMC free article] [PubMed] [Google Scholar]
- 29.Nelson DL, Cox MM. Lehninger: Principles of Biochemistry. 6th Ed W. H. Freeman; New York: 2013. [Google Scholar]
- 30.Jucker BM, Rennings AJ, Cline GW, Petersen KF, Shulman GI. In vivo NMR investigation of intramuscular glucose metabolism in conscious rats. Am J Physiol. 1997:39–48. doi: 10.1152/ajpendo.1997.273.1.E139. [DOI] [PubMed] [Google Scholar]
- 31.Bonen A, McDermott JC, Tan MH. Glycogenesis and glyconeogenesis in skeletal muscle: Effects of pH and hormones. Am J Physiol. 1990;258:693–700. doi: 10.1152/ajpendo.1990.258.4.E693. [DOI] [PubMed] [Google Scholar]
- 32.Miller BH, et al. Circadian and CLOCK-controlled regulation of the mouse transcriptome and cell proliferation. Proc Natl Acad Sci USA. 2007;104:3342–3347. doi: 10.1073/pnas.0611724104. [DOI] [PMC free article] [PubMed] [Google Scholar]
- 33.Klipp E, Heinrich R, Holzhütter HG. Prediction of temporal gene expression. Metabolic opimization by re-distribution of enzyme activities. Eur J Biochem. 2002;269:5406–5413. doi: 10.1046/j.1432-1033.2002.03223.x. [DOI] [PubMed] [Google Scholar]
- 34.Spriet LL, Howlett RA, Heigenhauser GJ. An enzymatic approach to lactate production in human skeletal muscle during exercise. Med Sci Sport Exerc. 2000;32:756–763. doi: 10.1097/00005768-200004000-00007. [DOI] [PubMed] [Google Scholar]
- 35.Thaben PF, Westermark PO. Detecting rhythms in time series with RAIN. J Biol Rhythms. 2014;29:391–400. doi: 10.1177/0748730414553029. [DOI] [PMC free article] [PubMed] [Google Scholar]
- 36.Wu G, Anafi RC, Hughes ME, Kornacker K, Hogenesch JB. MetaCycle: An integrated R package to evaluate periodicity in large scale data. Bioinformatics. 2016;32:3351–3353. doi: 10.1093/bioinformatics/btw405. [DOI] [PMC free article] [PubMed] [Google Scholar]
- 37.Van der Vinne V, et al. Cold and hunger induce diurnality in a nocturnal mammal: Function and mechanism. Proc Natl Acad Sci USA. 2014;111:15256–15260. doi: 10.1073/pnas.1413135111. [DOI] [PMC free article] [PubMed] [Google Scholar]
- 38.Lamia KA, Storch KF, Weitz CJ. Physiological significance of a peripheral tissue circadian clock. Proc Natl Acad Sci USA. 2008;105:15172–15177. doi: 10.1073/pnas.0806717105. [DOI] [PMC free article] [PubMed] [Google Scholar]
- 39.Cascante M, Marin S. Metabolomics and fluxomics approaches. Essays Biochem. 2008;45:67–82. doi: 10.1042/BSE0450067. [DOI] [PubMed] [Google Scholar]
- 40.Bar-Even A, et al. The moderately efficient enzyme : Evolutionary and physicochemical trends shaping enzyme parameters. Biochemistry. 2011;50:4402–4410. doi: 10.1021/bi2002289. [DOI] [PubMed] [Google Scholar]
- 41.Easterby JS. A generalized theory of the transition time for sequential enzyme reactions. Biochem J. 1981;199:155–161. doi: 10.1042/bj1990155. [DOI] [PMC free article] [PubMed] [Google Scholar]
Associated Data
This section collects any data citations, data availability statements, or supplementary materials included in this article.


