Abstract
We wish to save lives of patients admitted to ICUs. Their mortality is high enough based simply on the severity of the original injury or illness, but is further raised by events during their stay. We target those events that are subacute but potentially catastrophic, such as infection. Sepsis, for example, is a bacterial infection of the bloodstream, that is common in ICU patients and has a >25% risk of death. Logically, early detection and treatment with antibiotics should improve outcomes. Our fundamental precepts are (1) some potentially catastrophic medical and surgical illnesses have subclinical phases during which early diagnosis and treatment might have life-saving effects, (2) these phases are characterized by changes in the normal highly complex but highly adaptive regulation and interaction of the nervous system and other organs such as the heart and lungs, (3) teams of clinicians and quantitative scientists can work together to identify clinically important abnormalities of monitoring data, to develop algorithms that match the clinicians' eye in detecting abnormalities, and to undertake the clinical trials to test their impact on outcomes.
I. INTRODUCTION
While patents in intensive care units throughout a modern tertiary care hospital differ in age, diagnosis, treatment, expected length of stay and prognosis, they all share one thing in common. They are all vulnerable to subacute, potentially catastrophic complications for which early diagnosis leading to early therapy should improve their outcomes. While early signs of impending problems may well be apparent to experienced clinicians, there are countless stories of subacute illness suspected too late. A general solution is to devise continuous monitoring algorithms that detect signatures of physiology going wrong.
This idea stands on the work of Goldberger (10), Buchman (8) and others, who based their viewpoints of health and illness on concepts of non-linear dynamics. In this context, the body is a collection of interconnected cells, organs and wiring incessantly adapting to circumstance through signals and responses. A widely observed manifestation is the variation in the times between heartbeats, a result of the highly responsive autonomic nervous system input to the sinus node. Thus heart rate variability (HRV) is a feature of healthy humans, and reduced HRV signifies illness. It is clear that there are many appearances of normal heart rate time series, but only one during illness. The interpretation is that illness leads to a reduction in complexity of human physiology, and to monotonous behavior that is oblivious to input signals. These are powerful concepts not previously harnessed and reduced to the practice of medicine.
We have pioneered the bedside application of these ideas. We began our work in the Neonatal ICU with the goal of early detection of neonatal sepsis in very low birth weight (VLBW, <1500g) infant (1, 2, 4, 5, 7, 11-17, 19, 20, 22, 24, 26). This is a clear example of the kind of illness where early detection and early therapy with antibiotics should favorably alter the course of the illness. We found a signature of pathophysiologic dynamics in the heart beat intervals, and we developed a predictive model based on detection of the abnormal heart rate characteristics (HRC) of reduced variability and transient decelerations using, among other things, tools of non-linear dynamical analysis.
Here we review the major essential elements in this research field. We begin with a general overview, and then describe the kinds of databases that we use, the mathematical and statistical tools, and the kinds of results we get.
II. METHODS
A. General approach
1. Pick the right problem
This is the hardest part. We seek clinical scenarios in which there is a subclinical phase where we might expect that early diagnosis and treatment will improve outcomes. Neonatal sepsis is the perfect example – common (25% of very low birth-weight infants), deadly (mortality 50% higher, about 20% overall), and no good clinical signs to alert the clinicians. On the other hand, ventricular tachyarrhythmia in adults with heart disease is not as good a target. While common, deadly and without early detection strategies, there is no immediately preventive measure. Implanted defibrillators, which await the problem but then rapidly treat it, will be hard to surpass.
2. Look at the data
This is the most time-consuming part. Clinicians and mathematicians spend hours together looking at the physiological waveform and vital sign records for patients who had the events listed above. We identify with our eyes the features that we wish to quantify - for example, this is how we found reduced variability and transient decelerations prior to neonatal sepsis.
3. Fear no math
This is the most interesting and fun part. We do not subscribe blindly to the idea that physiological variability and its frequency components hold all the answers, though we agree the idea of reduced complexity during illness is a very useful framework. Reduced variability and transient decelerations would never have come to light, though, had we used only traditional heart rate variability measures. Here is the work of the quantitative scientists, then, to reduce the observations of the clinicians to measured parameters, often novel.
4. Do clinical trials
This is the most nerve-wracking part. We developed heart rate characteristics analysis in 4 years, and then spent nearly 7 in a randomized trial. Randomized trials are the only way to convince clinicians to change their practice, and this is how it should be – too many clinical practices have vaporized in the face of randomized trials, such as the use of antiarrhythmic drugs to prevent sudden cardiac death, or hormone replacement after menopause to prevent heart disease. We anticipate that predictive monitoring, though, will improve outcomes and not lead to new harms.
B. Databases
We are using 2 large databases for new algorithm development in infants and adults.
1. Data from the prospective HeRO trial in the NICU. The prospectively collected data elements include RR intervals, calculations of sample entropy, sample asymmetry, standard deviation along with times and results of blood cultures obtained for suspicion of sepsis, antibiotic use, time on mechanical ventilator, and death.
2. Waveform and vital sign data collected daily from ICU beds. Since January 2009, we have been storing digital waveforms from as many as 75 beds, a partial sample of the 200 ICU and 100 monitored ward beds. We store 3 EKG leads, respiratory impedance waveform, and the O2 saturation signal along with GE monitor-derived bedside alarms and vital signs – about 75MB per bed per day. Any signal displayed on the bedside monitor is automatically captured – this is relevant to the Neurological ICU where, for example, intracranial pressure waveforms are important. Waveforms are archived on our dedicated grid computing cluster consisting of 10 desktop and workstation PCs with a total of 80 processing cores, 40 GB RAM, and 100 TB storage. The cluster is hosted inside the UVa secure clinical network, and two firewalls prevent unauthorized access.
C. Mathematical and statistical tools
Among others, we employ:
Time-domain parameters, such as the mean and variance to estimate the center and the width of the distributions. Most observations during illness in adults, including those with trauma are of reduced HRV (3, 23) measured is standard ways (25).
Frequency-domain parameters, or band specific variances. An incontrovertible finding is of reduced sinus arrhythmia during illness, reflected as a reduced area under the spectrum at the respiratory frequency.
Phase domain, in which the instantaneous phase of waveforms are found using the Hilbert transform. This is a novel application, and results in phase interaction plots that quantify the heart rate impact of breaths at different points of the cardiac cycle. For example, the coincidence of a heartbeat and the beginning of expiration results in more dramatic slowing.
Signal quality index, a package of algorithms developed by
Clifford and coworkers in the large MIMIC II database of ICU waveforms (6, 21). It results in RR intervals, EKG-derived respiration, and a fused chest impedance plethysmography waveform.
Entropy estimation using sample entropy and the coefficient of sample entropy, which we have recently developed as a detector of atrial fibrillation in very short – 12 beats – heart rate time series. We will test the idea that changes in entropy of the heart rate and other time series is altered as illness develops (9).
Deceleration (or acceleration) detection using a novel wavelet-transform-based algorithm that we developed for neonatal sepsis detection (7). The algorithm is readily adapted to detect the accelerations that we identified in preliminary inspection of trauma ICU data.
We combine them using multivariate statistical methods, such as logistic regression (this is the basis of the HRC index for the NICU)(15, 16, 18), k-nearest neighbor analysis (26), neural nets, and other techniques. Generally, 50 events allow for a predictive model with 5 predictive variables and 95% CI of 0.3 around the ROC area. We designate the 24 hours prior to the event as the outcome of interest. Thus the output of the model is the probability of an event in the next 24 hours, a truly predictive result. We divide by the average probability of the event, and present the clinician with the fold-increase in risk of an upcoming event. In the case of neonatal sepsis prediction in the NICU, we call this the HRC index or the HeRO score.
III. RESULTS
A. Visualization of database and calculations
We have developed methods to view and study data for many infants at once. We array clinical data and extracted monitoring parameters along a time axis for the entire population. The horizontal axis is time in days since birth. From the existing database of more than 1100 admissions, more than 220 of the VLBW.
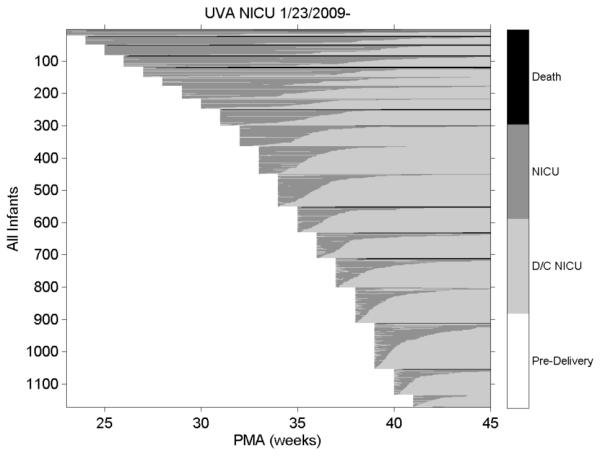
1. Natural history of NICU admissions. The graphic in Figure 1 represents each infant as a horizontal line extending from birth to discharge in terms of post-menstrual age. Each row is an individual patient with the start, stop and length of hospitalization marked by post-menstrual age (PMA) in weeks. The right hand vertical bar explains the gray scale coding. Thus the most premature infants are admitted near PMA 23 or 24 weeks and more are discharged at a later PMA compared with infants born closer to term.
Figure 1.

NICU stays for all University of Virginia (UVa) infants: the right hand axis gives the status of the infant. Death=death in NICU; NICU=NICU days; D/C= discharge
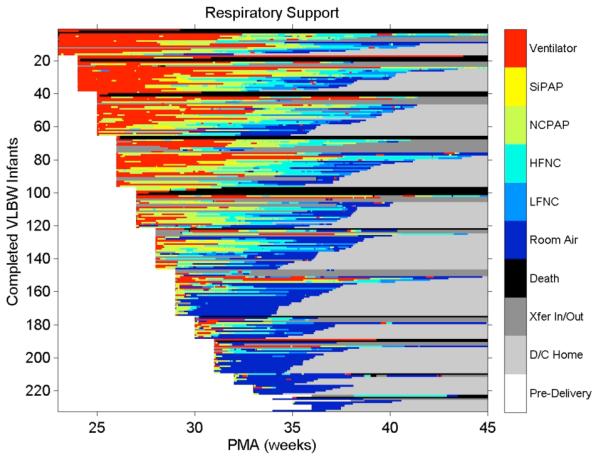
2. Heat map of respiratory support in VLBW infants. The color scale on the right is arranged so that less intense and invasive respiratory support modalities are marked by cooler colors. Figure 2 affirms the clinical tenet that more premature infants receive more intense support, and for longer. Note that many infants of GA > 31 weeks require no support for much of the NICU stay.
Figure 2.

Heat map of respiratory support: the right hand axis relates the color to the level of support, with warmer colors denoting more invasive or vigorous support
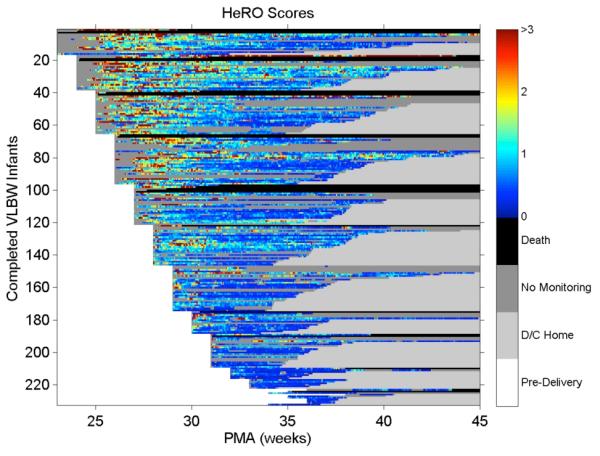
3. HeRO score in VLBW infants color-coded by fold-increase in risk of sepsis in the next 24 hours. These values were calculated automatically from the RR intervals as determined from the stored physiologic waveform database. As shown in Figure 3, high scores are not limited to the most premature.
Figure 3.

Heat map of HeRO scores: the right hand axis relates the color to the score, with warmer colors denoting higher risk of imminent illness
This new database is being used to develop new time series algorithms to detect neonatal apnea, and to study the interaction of breathing and heart rate using non-linear dynamical tools centered in the phase domain.
B. Multivariable statistical prediction of outcome
A non-invasive estimate of the risk of in-hospital death that is available from early in the hospital course and that is constantly updated might be a useful tool in NICU clinical care. We modeled 152 deaths in 1489 VLBW infants who received only conventional monitoring using the prospectively obtained data described above in a randomized trial of HRC monitoring using multivariable logistic regression. In order of significance, the average HeRO score, presence of ventilator, birth weight, Apgar score at 5 (but not 1) minutes, and sepsis within the past 10 days predicted mortality (p<0.005 for each). The model had good discrimination, with ROC area near 0.85 starting at 3 hours of monitoring. Thus HRC monitoring and clinical data about ventilation and sepsis predict NICU death beginning at 3 hours. These findings may add to the benefit of HeRO monitoring in the NICU.
C. Patterns of neonatal apnea in individual patients
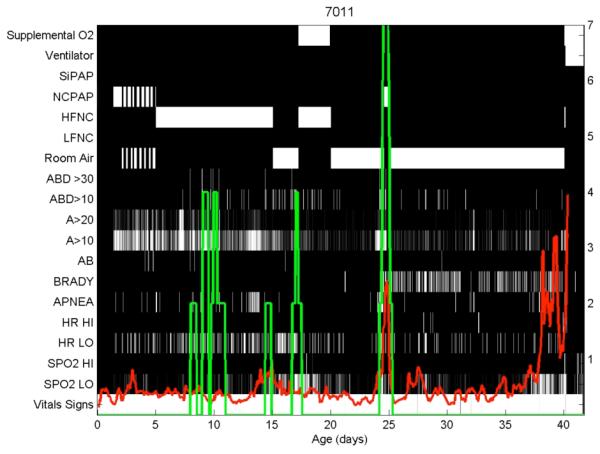
Using a novel detector of apnea, we can detect and characterize episodes in our new database of waveforms and vital signs. Figure 4 shows an event map of respiratory support, apnea episodes, and monitor alarms for an infant who died of necrotizing enterocolitis after a 41 day NICU stay. The left vertical axis is labeled categorically:
Figure 4.

Respiratory and HeRO map of a single infant.
NCPAP, nasal CPAP;
HFNC and LFNC, high- and low-flow nasal cannula;
ABD>30 and >10, central apneas with bradycardia and O2 desaturations lasting >30 and >10 seconds;
A>20 and >10, apneas lasting >20 and >10 seconds;
AB, apnea and bradycardia nursing sheet entry;
BRADY and APNEA, monitor alarms;
HR HI and LO, monitor alarms for high and low HR;
SPO2 HI and LO, monitor alarms for high and low O2 saturation.
The right vertical axis relates to the green line (number of ABD30 events in past 24 hours) and the red line is the HeRO score (in fold-increase in risk of sepsis in next 24 hours).
We use these displays in our joint meetings of clinicians and quantitative scientists to look for phenomena of clinical relevance. Research questions include: are prolonged apneas (ABD>30 events) preceded by an increase in the number of shorter apneas?
IV. CONCLUSIONS
Predictive monitoring for subacute potentially catastrophic illnesses in ICU patients stands to transform the practice of medicine. Developing such algorithms, though, is very time- and labor-intensive, and requires large databases with meticulous clinical annotation, and close collaboration of quantitative scientists with expert clinicians. We are excited by the prospects of this field based on our results in premature infants with sepsis, and are extending these ideas and methods to the adult ICUs.
Acknowledgments
This work was supported in part by grants GM064640, HD064582 and HD064488 from the National Institutes of Health, by Medical Predictive Science Corporation, Charlottesville, VA, USA, and by the American Heart Association.
Contributor Information
J. Randall Moorman, Department of Internal Medicine, University of Virginia; (Box 800158, Charlottesville, VA, USA, 22908; 434 982 3367.
Craig E. Rusin, Departments of Medicine and Pediatrics, University of Virginia
Hoshik Lee, Department of Physics, College of William and Mary.
Lauren E. Guin, Departments of Medicine and Pediatrics, University of Virginia
Matthew T. Clark, Departments of Medicine and Pediatrics, University of Virginia
John B. Delos, Department of Physics, College of William and Mary
John Kattwinkel, Departments of Medicine and Pediatrics, University of Virginia.
Douglas E. Lake, Departments of Medicine and Pediatrics, University of Virginia
REFERENCES
- [1].Addison K, Griffin MP, Moorman JR, Lake DE, O'Shea TM. Heart rate characteristics and neurodevelopmental outcome in very low birth weight infants. J Perinatol. 2009 doi: 10.1038/jp.2009.81. [DOI] [PMC free article] [PubMed] [Google Scholar]
- [2].Aghili AA, Rizwan, Griffin MP, Moorman JR. Scaling and ordering of neonatal heart rate variability. Phys Rev Lett. 1995;74:1254–1257. doi: 10.1103/PhysRevLett.74.1254. [DOI] [PubMed] [Google Scholar]
- [3].Buchman TG, Stein PK, Goldstein B. Heart rate variability in critical illness and critical care. CurrOpinCrit Care. 2002;8:311–315. doi: 10.1097/00075198-200208000-00007. [DOI] [PubMed] [Google Scholar]
- [4].Cao H, Lake DE, Griffin MP, Moorman JR. Increased nonstationarity of neonatal heart rate before the clinical diagnosis of sepsis. Ann Biomed Eng. 2004;32:233–244. doi: 10.1023/b:abme.0000012743.81754.0b. [DOI] [PubMed] [Google Scholar]
- [5].Chang KL, Monahan KJ, Griffin MP, Lake D, Moorman JR. Comparison and application of frequency domain methods in analysis of neonatal heart rate time series. Ann Biomed Eng. 2001;29:764–774. doi: 10.1114/1.1397791. [DOI] [PubMed] [Google Scholar]
- [6].Clifford GD, Long WJ, Moody GB, Szolovits P. Robust parameter extraction for decision support using multimodal intensive care data. Philos Transact A Math Phys Eng Sci. 2009;367:411–429. doi: 10.1098/rsta.2008.0157. [DOI] [PMC free article] [PubMed] [Google Scholar]
- [7].Flower AA, Moorman JR, Lake DE, Delos JB. Dynamical theory of periodic heart rate decelerations in premature infants. Experimental Medicine and Biology. 2010;235:531–538. doi: 10.1258/ebm.2010.009336. [DOI] [PMC free article] [PubMed] [Google Scholar]
- [8].Godin PJ, Buchman TG. Uncoupling of biological oscillators: a complementary hypothesis concerning the pathogenesis of multiple organ dysfunction syndrome. Crit Care Med. 1996;24:1107–1116. doi: 10.1097/00003246-199607000-00008. [DOI] [PubMed] [Google Scholar]
- [9].Godin PJ, Fleisher LA, Eidsath A, Vandivier RW, Preas HL, Banks SM, Buchman TG, Suffredini AF. Experimental human endo-toxemia increases cardiac regularity. Crit Care Med. 1996;24:1117–1124. doi: 10.1097/00003246-199607000-00009. [DOI] [PubMed] [Google Scholar]
- [10].Goldberger AL, West BJ, Degn H, Holden AV, Olsen LF. Chaos in biological systems. Plenum Press; New York: 1987. Chaos in physiology: health or disease? pp. 1–4. [Google Scholar]
- [11].Griffin MP, Lake D, Moorman JR. Heart rate characteristics and clinical signs in neonatal sepsis. Pediatric Research. 2007;61:222–227. doi: 10.1203/01.pdr.0000252438.65759.af. [DOI] [PubMed] [Google Scholar]
- [12].Griffin MP, Lake DE, Bissonette EA, Harrell FE, Jr., O'Shea TM, Moorman JR. Heart rate characteristics: novel physiomarkers to predict neonatal infection and death. Pediatrics. 2005;116:1070–1074. doi: 10.1542/peds.2004-2461. [DOI] [PubMed] [Google Scholar]
- [13].Griffin MP, Lake DE, Moorman JR. Heart rate characteristics and laboratory tests in neonatal sepsis. Pediatrics. 2005;115:937–941. doi: 10.1542/peds.2004-1393. [DOI] [PubMed] [Google Scholar]
- [14].Griffin MP, Moorman JR. Toward the early diagnosis of neonatal sepsis and sepsis-like illness using novel heart rate analysis. Pediatrics. 2001;107:97–104. doi: 10.1542/peds.107.1.97. [DOI] [PubMed] [Google Scholar]
- [15].Griffin MP, O'Shea TM, Bissonette EA, Harrell FE, Jr., Lake DE, Moorman JR. Abnormal heart rate characteristics are associated with neonatal mortality. Pediatr Res. 2004;55:782–788. doi: 10.1203/01.PDR.0000119366.21770.9E. [DOI] [PubMed] [Google Scholar]
- [16].Griffin MP, O'Shea TM, Bissonette EA, Harrell FE, Jr., Lake DE, Moorman JR. Abnormal heart rate characteristics preceding neonatal sepsis and sepsis-like illness. Pediatr Res. 2003;53:920–926. doi: 10.1203/01.PDR.0000064904.05313.D2. [DOI] [PubMed] [Google Scholar]
- [17].Griffin MP, Scollan DF, Moorman JR. The dynamic range of neonatal heart rate variability. Journal of Cardiovascular Electrophysiology. 1994;5:112–124. doi: 10.1111/j.1540-8167.1994.tb01151.x. [DOI] [PubMed] [Google Scholar]
- [18].Harrell FE. Regression modeling strategies. Springer; 2001. [Google Scholar]
- [19].Kovatchev BP, Farhy LS, Cao H, Griffin MP, Lake DE, Moorman JR. Sample asymmetry analysis of heart rate characteristics with application to neonatal sepsis and systemic inflammatory response syndrome. Pediatr Res. 2003;54:892–898. doi: 10.1203/01.PDR.0000088074.97781.4F. [DOI] [PubMed] [Google Scholar]
- [20].Lake DE, Richman JS, Griffin MP, Moorman JR. Sample entropy analysis of neonatal heart rate variability. American Journal of Physiology. 2002;283:R789–R797. doi: 10.1152/ajpregu.00069.2002. [DOI] [PubMed] [Google Scholar]
- [21].Li Q, Mark RG, Clifford GD. Robust heart rate estimation from multiple asynchronous noisy sources using signal quality indices and a Kalman filter. Physiol Meas. 2008;29:15–32. doi: 10.1088/0967-3334/29/1/002. [DOI] [PMC free article] [PubMed] [Google Scholar]
- [22].Moorman JR, Lake DE, Griffin MP. Heart rate characteristics monitoring in neonatal sepsis. IEEE Transactions in Biomedical Engineering. 2006;53:126–132. doi: 10.1109/TBME.2005.859810. [DOI] [PubMed] [Google Scholar]
- [23].Morris JA, Jr., Norris PR, Ozdas A, Waitman LR, Harrell FE, Jr., Williams AE, Cao H, Jenkins JM. Reduced heart rate variability: an indicator of cardiac uncoupling and diminished physiologic reserve in 1,425 trauma patients. J Trauma. 2006;60:1165–1173. doi: 10.1097/01.ta.0000220384.04978.3b. discussion 1173-1164. [DOI] [PubMed] [Google Scholar]
- [24].Nelson JC, Rizwan u, Griffin MP, Moorman JR. Probing the order within neonatal heart rate variability. Pediatr Res. 1998;43:823–831. doi: 10.1203/00006450-199806000-00017. [DOI] [PubMed] [Google Scholar]
- [25].Task Force Heart rate variability: standards of measurement, interpretation and clinical use. Circulation. 1996;93:1043–1065. [PubMed] [Google Scholar]
- [26].Xiao Y, Griffin P, Lake DE, Moorman JR. Nearest-neighbor and regression analyses of clinical and heart rate characteristics in the early diagnosis of neonatal sepsis. Med Decis Making. 2009;30:258–266. doi: 10.1177/0272989X09337791. [DOI] [PMC free article] [PubMed] [Google Scholar]


