

Abstract
Increasing research suggests that mitochondrial defects play a major role in Alzheimer’s disease (AD) pathogenesis. We aimed to better understand changes in mitochondria with the development and progression of AD. We compared APPsw/PS1dE9 transgenic mice at 3, 6, 9, and 12 months old as an animal model of AD and age-matched C57BL/6 mice as controls. The learning ability and spatial memory ability of APPsw/PS1dE9 mice showed significant differences compared with controls until 9 and 12 months. Mitochondrial morphology was altered in hippocampus tissue of APPsw/PS1dE9 mice beginning from the third month. ‘Medullary corpuscle’, which is formed by the accumulation of a large amount of degenerative and fragmented mitochondria in neuropils, may be the characteristic change observed on electron microscopy at a late stage of AD. Moreover, levels of mitochondrial fusion proteins (optic atrophy 1 and mitofusin 2) and fission proteins (dynamin-related protein 1 and fission 1) were altered in transgenic mice compared with controls with progression of AD. We found increased levels of fission and fusion proteins in APP/PS1 mice at 3 months, indicating that the presence of abnormal mitochondrial dynamics may be events in early AD progression. Changes in mitochondrial preceded the onset of memory decline as measured by the modified Morris water maze test. Abnormal mitochondrial dynamics could be a marker for early diagnosis of AD and monitoring disease progression. Further research is needed to study the signaling pathways that govern mitochondrial fission/fusion in AD.
Keywords: Alzheimer’s disease, mitochondrial dynamics, mitochondrial dysfunction, mitochondrial fission, mitochondrial fusion
Introduction
Alzheimer’s disease (AD) is a neurodegenerative disease characterized by progressive memory loss, behavioral language, visuospatial impairments, and changes in personality 1. AD is characterized by loss of neurons, intracellular neurofibrillary tangles, and extracellular senile plaques composed of β-amyloid deposits 2. However, increasing research suggests that mitochondrial defects play a major role in the pathogenesis of AD 3–5. Mitochondria are the powerhouses of all cells except erythrocytes. Neurons are especially vulnerable to mitochondrial dysfunction owing to high energy demands and dependence on respiration for ATP generation 6. Multiple studies have found reduced levels of mitochondrial ATP in affected brain regions of AD transgenic mice 7,8, which further suggests that mitochondrial dysfunction is a significant characteristic of AD pathogenesis. Mitochondrial defects might arise from abnormal mitochondrial dynamics 9.
Mitochondria are highly dynamic and plastic organelles that are continually altering morphology by rapid and reversible fission and fusion 10. Fission is regulated by dynamin-related protein 1 (DRP1, GTPase) and fission 1 (FIS1), and fusion is regulated by optic atrophy 1 (OPA1) responsible for inner-membrane fusion; mitofusins (MFN1 and MFN2) are responsible for outer-membrane fusion 11,12. Mitochondrial dynamics are essential for cell survival. However, neurons affected by AD feature unbalanced mitochondrial dynamics, which results in structural and functional abnormalities, leading to neuronal damage 5.
Abnormal mitochondrial dynamics in the pathogenesis of AD is becoming a research hotspot 13. Multiple studies report mitochondrial dysfunction selectively in cortical and hippocampal postmortem brain tissues from AD patients 14 and AD transgenic mice 15. More recently, a study found reduced levels of DRP1, OPA1, MFN1, and MFN2 and increased levels of FIS1 in brain tissue from AD patients 16. Impaired mitochondrial dynamics (increased mitochondrial fission and decreased fusion) may explain the increased mitochondrial fragmentation, defective mitochondrial function, impaired axonal transport of mitochondria, and synaptic degeneration observed in neurons affected by AD 17. Increasing evidence suggests structural and functional abnormalities in mitochondria involved in AD 15,16. However, in AD neurons, the extent and characteristics of mitochondrial structural damage and mitochondrial proteins at different stages of the disease are still unclear.
Materials and methods
Animals and tissues
Heterozygous β-amyloid PPswe/PS1dE9 double-transgenic mice (APP/PS1) with a C57BL/6 background and age-matched C57BL/6 control mice (C57) at age 3, 6, 9, and 12 months were used. All mice were males (n=15 per group) and all were obtained from Beijing HFK Bioscience, Beijing, China (Permit no. scxk 2014-0004). Mice were deeply euthanized by 10% chloral hydrate, followed by cervical dislocation. Within 3 min, the brains were rapidly removed; one hemisphere was dissected for electron microscopy and the other was used for Western blotting. All procedures followed the guidelines of the Ethical Committee for Animal Experiments of Shandong University (Jinan, China).
Behavior test
We used the modified Morris water maze test to assess learning and spatial memory ability of mice 18. The procedure consisted of 1-day adapting tests without a platform and 5-day hidden platform tests, plus a spatial probe trial 24 h after the last hidden platform test; 15 mice were used in each group. In the spatial acquisition tests, the longest time in finding the platform was 60 s. If a mouse did not find the platform within 60 s, it was guided to the platform. Every mouse was trained four times per day. The platform was located in the southwest quadrant of the water tank. Starting locations were semirandomly selected at the north, east, southeast, and northwest corners. The time taken for a mouse to explore and arrive at the platform was recorded as the escape latency. After 24 h of the last hidden platform test had been completed, a single probe trial was performed to test memory retention, in which the platform was removed. The new start location was northeast and each mouse was allowed to swim for 60 s. The time spent traveling in the target quadrant (where the platform was previously located) was recorded and the times crossing the point where the platform had been located were counted to test whether they remembered the original position of the platform.
Transmission electron microscopy
According to the conventional transmission electron microscopy (TEM) sample preparation method 19, dissected hippocampus CA1 was quickly cut into 1-mm-thick slices and immediately placed in 3% glutaraldehyde in phosphate buffer for 2 h. The slices were then postfixed in a 1% osmium-tetroxide PBS for 1 h, and subsequently rinsed, dehydrated, saturated, and embedded in EPON812 resin. Then, ultrathin slices were cut on an ultramicrotome after semithin sections positioning. They were then rinsed and poststained with lead citrate and uranyl acetate and imaged under a JEM-1200 EX electron microscope (JEOL Ltd., Tokyo, Japan). Overall, 15–20 randomly selected micrographs per group were obtained at 15 000 magnification and analyzed by a blinded investigator. Images of mitochondria in cell bodies of 15 CA1 neurons were obtained. Mitochondrial length in neurons was measured using Image J software (NIH Image for the Macintosh, Cupertino, California, USA).
Western blot analysis
For Western blot, hippocampus tissues were flash frozen and then stored at –80°C until homogenization. Tissues were homogenized for 30 min in ice-cold RIPA lysing buffer [25 mM Tris–HCl (pH 7.6), 150 mM NaCl; 1% NP40; 1% sodium deoxycholate; 0.1% sodium deoxycholate, 0.1% SDS] for a radioimmunoprecipitation assay (Redwood City, California, USA). Protein levels were tested using the bicinchoninic acid method. We prepared a 10% separation gel and a 5% stacking gel. Proteins were separated by SDS-PAGE (140 V), then transferred to a polyvinylidene fluoride membrane (150 mA, constant current, 2 h) and incubated for 1 h at room temperature with 5% skim milk in tris-buffered saline/t solution and then with primary antibodies overnight at 4°C. The membranes were washed with a tris-buffered saline/t buffer three times (5 min/time) and then incubated for 1 h with secondary antibodies. Proteins were exposed by electrochemiluminescence; membranes were washed three times at 5 min intervals and analyzed using a PharosFX Plus Molecular Imager (Bio-Rad). The antibodies were anti-DRP1 (8570, 1 : 1000; Cell Signaling Technology, Danvers, Massachusetts, USA), anti-FIS1 (10956-1-Ap, 1 : 500; Proteintech, Wuhan, P,R,C), anti-MFN2 (ab124773, 1:1000; Abcam, Cambridge, Massachusetts, USA), anti-OPA1 (ab157457, 1 : 1000; Abcam), and anti-β-actin (20536-1-Ap, 1 : 2000; Proteintech).
Statistical analysis
All data are expressed as mean±SD and were analyzed using SPSS 17.0 (SPSS Inc., Chicago, Illinois, USA). The water maze data were analyzed by analysis of variance and with multiple variables by multifactor analysis of variance. Multiple comparisons between means involved the least significant difference or the Student–Newman–Keuls method. Significance was set at P less than 0.05.
Results
Spatial learning and memory impairments in APP/PS1 mice
Spatial learning was measured as escape latency in the water maze each day (n=15 mice in each group). Over the 5 days of training, the escape latency of each group reduced gradually (Fig. 1b–e). The escape latency of APP/PS1 mice was longer than controls, and showed significant differences until 9 and 12 months compared with C57 mice. However, no statistical differences were detected at 3 and 6 months (Fig. 1a).
Fig. 1.
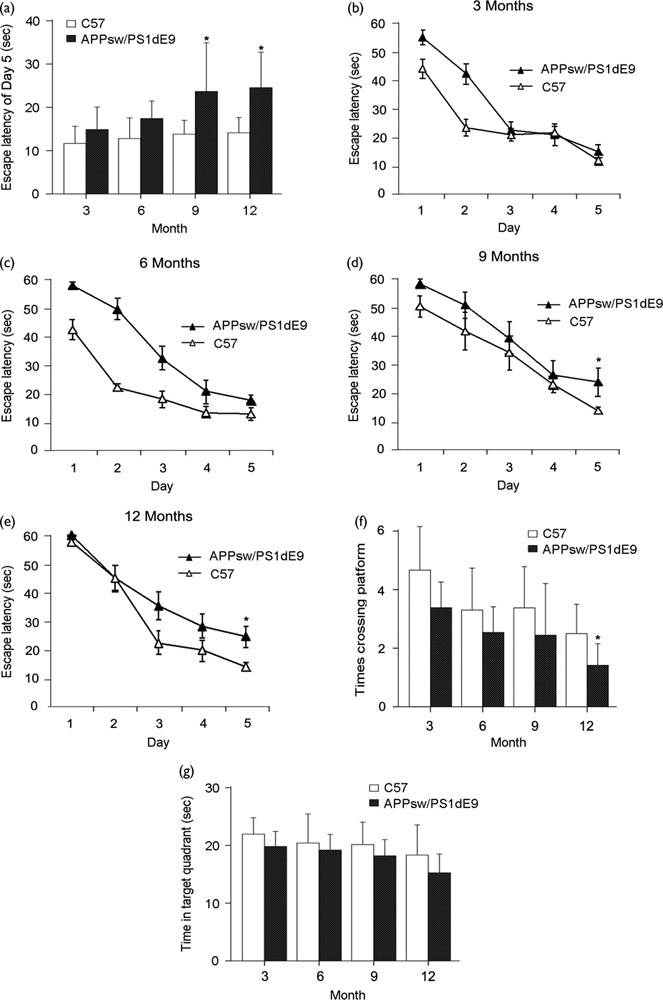
Spatial learning and memory impairments in APP/PS1 Mice. Escape latency, number of platform location crossings, and time spent in the target quadrant for transgenic and control C57 mice at age 3, 6, 9, and 12 months. (a) The escape latency of APP/PS1 mice was longer than the controls, and showed significant differences until 9 (P=0.047) and 12 months (P=0.021) compared with C57 mice. (b–e) Over the 5 days of training, the escape latency of each group reduced gradually. (b) Data from 3-month-old mice. (c) Data from 6-month-old mice. (d) Data from 9-month-old mice (P=0.048). (e) Data from 12-month-old mice (P=0.042). (f) Number of platform location crossings (P=0.046). (g) Time spent in the target quadrant. Data are presented as mean±SE, *P<0.05, n=15 in each group.
Spatial memory was evaluated by the probe trial performed 24 h after the last training session. The number of platform location crossings and the time spent in the target quadrant of APP/PS1 mice were consistently lower and shorter than those of the controls, which suggests an overall significance. However, the times crossing platform location of APP/PS1 mice at 12 months compared with C57 mice show only a significant difference out of eight comparisons (Fig. 1f and g).
Thus, the learning ability and spatial memory ability of APP/PS1 transgenic mice showed significant differences compared with age-matched C57 mice until 9 and 12 months.
Altered mitochondrial morphology in APP/PS1 mice precedes the onset of memory deficit
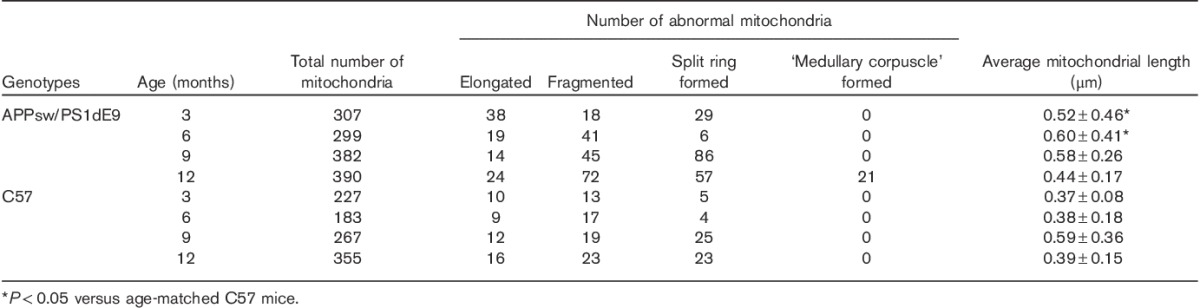
TEM was used to observe the hippocampus CA1 zone ultrastructure of APP/PS1 transgenic and C57 mice at different ages. Mitochondrial morphology changes in APP/PS1 mice started at age 3 months compared with the length and shape of mitochondria in C57 brains at the same age (Fig. 2). Several elongated mitochondria were identified, mitochondria gathered around the nucleus, and mitochondria were increased in number because of the increased formation of the mitochondrial split ring (Table 1). A mitochondrion divides by developing a ring around the organelle that constricts to pinch it into two halves. However, mitochondrial split rings were rare and mitochondria were larger (Fig. 2 and Table 1). Many fragmented mitochondria marked with disrupted membranes and without clear cristae appeared in APP/PS1 transgenic mice at the age of 6 months (Fig. 2 and Table 1). Then, the number of mitochondria split rings increased significantly for many damaged degenerative and fragmented mitochondria in AD mouse brains at the age of 9 months (Fig. 2). Finally, the ‘medullary corpuscle’ (an accumulation of small mitochondria and structurally damaged mitochondria with broken cristae) was found in neuropils in APP/PS1 transgenic mice at the age of 12 months (Fig. 2). These mitochondria changes were rarely observed in C57 mouse tissues (Fig. 2 and Table 1). Therefore, the changes in mitochondrial morphology started at age 3 months in APP/PS1 mouse models before the onset of memory decline.
Fig. 2.
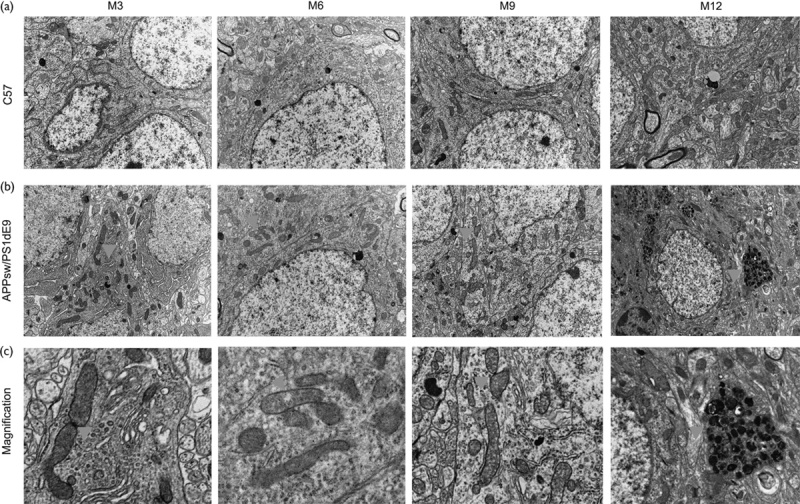
Mitochondrial morphology is altered in the hippocampus of APP/PS1 mice. (a) Hippocampus CA1 zone ultrastructure of C57 mice at age 3, 6, 9, and 12 months. (b) Hippocampus CA1 zone ultrastructure of APP/PS1 mice at age 3, 6, 9, and 12 months. (c) Each one of the images is the enlarged version of the correspondingly arrowaheaded area above in (b). Arrows show altered mitochondria: (M3) elongated mitochondria with mitochondria split rings formed. (M6) fragmented mitochondria marked with disrupted membranes and without clear cristae. (M9) mitochondria split rings increased significantly. (M12) ‘medullary corpuscle’ formed by the accumulation of a large amount of degenerative and fragmented mitochondria in neuropils. These mitochondria changes were rarely observed in C57 mouse tissues. M, months.
Table 1.
Quantitative analysis of mitochondria in CA1 neuronal cell bodies from APPsw/PS1dE9 and C57 mice on the basis of an electron microscopy examination
Altered expression of mitochondrial fission or fusion proteins may lead to changes in mitochondrial morphology
To determine whether mitochondrial structural proteins are altered in levels as AD progresses, we compared the protein levels of DRP1, FIS1, MFN2, and OPA1 in hippocampus tissues from APP/PS1 and C57 mice at ages 3, 6, 9, and 12 months (Fig. 3a). Levels of proteins related to fission (DRP1 and FIS1) and fusion (OPA1 and MFN2) were significantly increased in APP/PS1 mice at the age of 3 months compared with C57 mice (Fig. 3b–e). In contrast, levels of fission proteins DRP1 and FIS1 and mitochondrial inner-membrane fusion protein OPA1 were decreased at 6 months, but those of the mitochondrial outer-membrane fusion protein MFN2 were increased in APP/PS1 mice compared with C57 mice (Fig. 3b–e). Protein levels of DRP1, FIS1, OPA1, and MFN2 at 9 and 12 months were significantly increased compared with the controls (but not FIS1 at 9 months) (Fig. 3b–e). Our data suggest that the expression of fission and fusion proteins is altered in APP/PS1 mice with age and changes in mitochondrial morphology in APP/PS1 mice (Fig. 2) may be caused by altered expression of key proteins involved in mitochondrial dynamics.
Fig. 3.
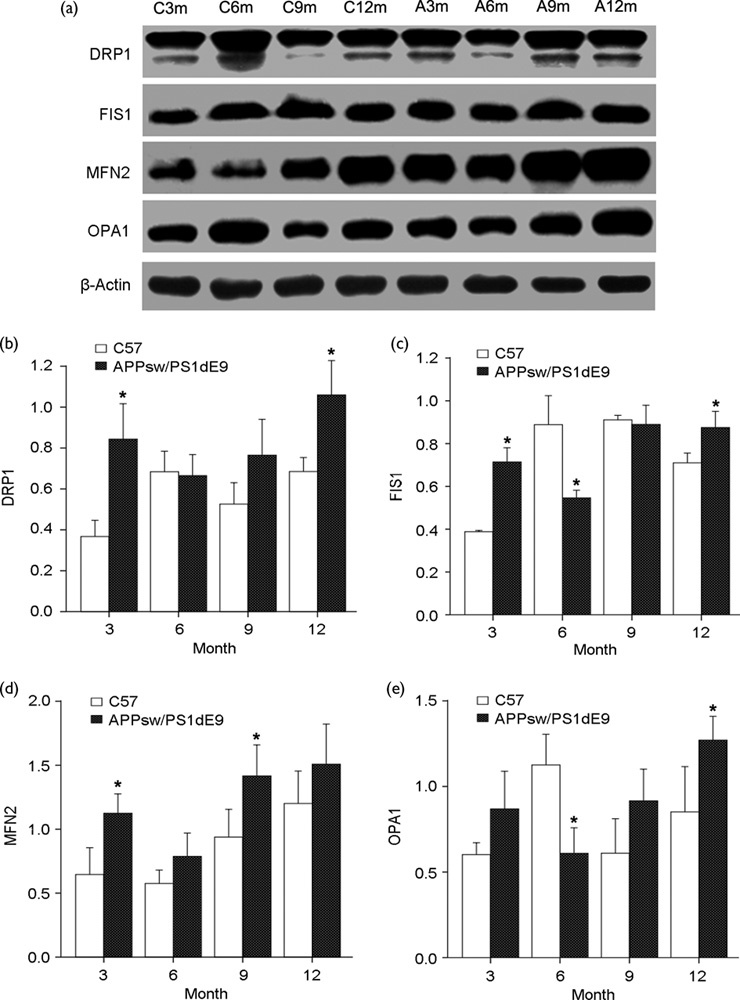
Mitochondrial dynamics changes in APP/PS1 mice. (a) Immunoblotting analysis of mitochondrial fusion [optic atrophy 1 (OPA1) and mitofusion 2 (MFN2)] and fission proteins [dynamin-related protein 1 (DRP1) and fission 1 (FIS1)] in hippocampi of APP/PS1 mice compared with C57 mice at different ages. Quantification of protein levels of (b) DRP1, (c) FIS1, (d) MFN2, and (e) OPA1 at different ages (*P<0.05 compared with the control). A, APPsw/PS1dE9; C, C57; m, month.
Discussion
In this study, we show that mitochondrial dynamics changes differ in APP/PS1 mice with age compared with controls and that mitochondrial morphology changes occur in APP/PS1 mice before the onset of memory decline. We used the modified Morris water maze test and showed that the spatial learning and memory of APP/PS1 mice was significantly decreased compared with controls until 9 and 12 months.
By TEM, we found mitochondrial fragmentation in neurons in all stages of the AD mouse brain, which is consistent with the altered ultrastructure observed in AD neurons from human brains and other mouse models 20,21. Mitochondrial fragmentation increased with disease progression, but before the onset of the memory phenotype. The ‘medullary corpuscle’, which is formed by the accumulation of a large amount of degenerative and fragmented mitochondria in neuropils, may be the characteristic change at the late stage of AD.
Changes in mitochondrial morphology may affect mitochondrial function 22. However, mitochondrial morphology is regulated by the balance of mitochondrial fission and fusion 23. Mitochondrial dynamics control the shape, localization, and function of mitochondria 24. How mitochondrial dynamics alter during AD development and progression remains unclear. A clearer understanding may provide new therapies for AD.
We studied mitochondrial structural proteins with disease progression and found differences in the expression of mitochondrial fusion and fission proteins in APP/PS1 mice compared with age-matched C57 mice with aging. In 3-month-old APP/PS1 mice, fission proteins (DRP1 and FIS1) and fusion proteins (MFN2 and OPA1) increased significantly in level. With disease progression, levels of DRP1, FIS1, and OPA1 decreased and the level of MFN2 increased in APP/PS1 mice compared with C57 mice at 6 months of age. Ultimately, the levels of DRP1, FIS1, MFN2, and OPA1 increased significantly and progressively in APP/PS1 mice at 9 and 12 months compared with the controls (but not FIS1 at 9 months).
Overall, our data suggest that changes in mitochondrial structural proteins in APP/PS1 and C57 mice correlate with genotype and age. We found increased levels of fission and fusion proteins in APP/PS1 mice at 3 months, indicating that the presence of abnormal mitochondrial dynamics may be events in early AD progression. Wang and colleagues found that APP overexpression reduced the levels of DLP1 and OPA1, which is in agreement with our observation of APP/PS1 mice at 6 months. However, what stage of AD progression was studied in APP-overexpressing M17 cells in the study by Wang and colleagues is unclear. Wang et al. 25 also reported that the manipulation of OPA1 but not DRP1 or FIS1 level rescued mitochondrial fragmentation. In contrast to the study by Wang and colleagues, Manczak et al. 9 reported that DRP1 and FIS1 levels increased significantly and progressively in patients with early, definite, and severe AD, but levels of MFN1 and MFN2 fusion proteins decreased. Some of the Manczak and colleagues findings are in agreement with those in our study because we found that DRP1 and FIS1 levels increased in APP/PS1 mice at 3, 9, and 12 months. However, in our study, the level of MFN2 fusion protein was increased. The differences in results may be because of the choice of control group and the aim of the study.
Conclusion
The above findings led to the conclusion that mitochondrial morphology and mitochondrial dynamics in AD pathogenesis are age related, which are significant in developing new treatment strategies by modifying abnormal mitochondrial dynamics in AD at different stages of disease progression. More importantly, we found that the progressive decline of memory appears later than mitochondrial dysfunction in APP/PS1 transgenic mice with disease progression; thus, abnormal mitochondrial dynamics may be early events in AD progression. These changes may provide us with new insight to study the mechanism of AD and could be used for early diagnosis and monitoring of AD progression. However, appropriate manipulation of fission and fusion genes to ameliorate neurodegenerative processes will be a challenge because the requirements for fission and fusion differ between cell types and cellular compartments.
Acknowledgements
This research was supported by the Youth Foundation of the 2nd Hospital of Shandong University (Y2014010010) and the National Natural Science Foundation of China (Nos. 81171214, 81571052, and 81401052) and Key projects of Research and development of Shandong province (2015GSF118056).
Conflicts of interest
There are no conflicts of interest.
References
- 1.Ballard C, Gauthier S, Corbett A, Brayne C, Aarsland D, Jones E. Alzheimer’s disease. Lancet 2011; 377:1019–1031. [DOI] [PubMed] [Google Scholar]
- 2.Anandatheerthavarada HK, Devi L. Amyloid precursor protein and mitochondrial dysfunction in Alzheimer’s disease. Neuroscientist 2007; 13:626–638. [DOI] [PubMed] [Google Scholar]
- 3.Swerdlow RH. The neurodegenerative mitochondriopathies. J Alzheimers Dis 2009; 17:737–751. [DOI] [PMC free article] [PubMed] [Google Scholar]
- 4.Martin LJ. Mitochondrial and cell death mechanisms in neurodegenerative diseases. Pharmaceuticals (Basel) 2010; 3:839–915. [DOI] [PMC free article] [PubMed] [Google Scholar]
- 5.Reddy PH, Reddy TP. Mitochondria as a therapeutic target for aging and neurodegenerative diseases. Curr Alzheimer Res 2011; 8:393–409. [DOI] [PMC free article] [PubMed] [Google Scholar]
- 6.Du H, Guo L, Yan SS. Synaptic mitochondrial pathology in Alzheimer’s disease. Antioxid Redox Signal 2012; 16:1467–1475. [DOI] [PMC free article] [PubMed] [Google Scholar]
- 7.Yao J, Irwin RW, Zhao L, Nilsen J, Hamilton RT, Brinton RD. Mitochondrial bioenergetic deficit precedes Alzheimer’s pathology in female mouse model of Alzheimer’s disease. Proc Natl Acad Sci USA 2009; 106:14670–14675. [DOI] [PMC free article] [PubMed] [Google Scholar]
- 8.Dragicevic N, Mamcarz M, Zhu Y, Buzzeo R, Tan J, Arendash GW, Bradshaw PC. Mitochondrial amyloid-beta levels are associated with the extent of mitochondrial dysfunction in different brain regions and the degree of cognitive impairment in Alzheimer’s transgenic mice. J Alzheimers Dis 2010; 20 (Suppl 2):S535–S550. [DOI] [PubMed] [Google Scholar]
- 9.Manczak M, Calkins MJ, Reddy PH. Impaired mitochondrial dynamics and abnormal interaction of amyloid beta with mitochondrial protein Drp1 in neurons from patients with Alzheimer’s disease: implications for neuronal damage. Hum Mol Genet 2011; 20:2495–2509. [DOI] [PMC free article] [PubMed] [Google Scholar]
- 10.Okamoto K, Shaw JM. Mitochondrial morphology and dynamics in yeast and multicellular eukaryotes. Annu Rev Genet 2005; 39:503–536. [DOI] [PubMed] [Google Scholar]
- 11.Hall AR, Burke N, Dongworth RK, Hausenloy DJ. Mitochondrial fusion and fission proteins: novel therapeutic targets for combating cardiovascular disease. Br J Pharmacol 2014; 171:1890–1906. [DOI] [PMC free article] [PubMed] [Google Scholar]
- 12.Cho DH, Nakamura T, Lipton SA. Mitochondrial dynamics in cell death and neurodegeneration. Cell Mol Life Sci 2010; 67:3435–3447. [DOI] [PMC free article] [PubMed] [Google Scholar]
- 13.Santos RX, Correia SC, Wang X, Perry G, Smith MA, Moreira PI, Zhu X. Alzheimer’s disease: diverse aspects of mitochondrial malfunctioning. Int J Clin Exp Pathol 2010; 3:570–581. [PMC free article] [PubMed] [Google Scholar]
- 14.Devi L, Prabhu BM, Galati DF, Avadhani NG, Anandatheerthavarada HK. Accumulation of amyloid precursor protein in the mitochondrial import channels of human Alzheimer’s disease brain is associated with mitochondrial dysfunction. J Neurosci 2006; 26:9057–9068. [DOI] [PMC free article] [PubMed] [Google Scholar]
- 15.Manczak M, Mao P, Calkins MJ, Cornea A, Reddy AP, Murphy MP, et al. Mitochondria-targeted antioxidants protect against amyloid-beta toxicity in Alzheimer’s disease neurons. J Alzheimers Dis 2010; 20 (Suppl 2):S609–S631. [DOI] [PMC free article] [PubMed] [Google Scholar]
- 16.Wang X, Su B, Lee HG, Li X, Perry G, Smith MA, Zhu X. Impaired balance of mitochondrial fission and fusion in Alzheimer’s disease. J Neurosci 2009; 29:9090–9103. [DOI] [PMC free article] [PubMed] [Google Scholar]
- 17.Calkins MJ, Manczak M, Mao P, Shirendeb U, Reddy PH. Impaired mitochondrial biogenesis, defective axonal transport of mitochondria, abnormal mitochondrial dynamics and synaptic degeneration in a mouse model of Alzheimer’s disease. Hum Mol Genet 2011; 20:4515–4529. [DOI] [PMC free article] [PubMed] [Google Scholar]
- 18.Vorhees CV, Williams MT. Morris water maze: procedures for assessing spatial and related forms of learning and memory. Nat Protoc 2006; 1:848–858. [DOI] [PMC free article] [PubMed] [Google Scholar]
- 19.Yan J, Liu XH, Han MZ, Wang YM, Sun XL, Yu N, et al. Blockage of GSK3beta-mediated Drp1 phosphorylation provides neuroprotection in neuronal and mouse models of Alzheimer’s disease. Neurobiol Aging 2015; 36:211–227. [DOI] [PubMed] [Google Scholar]
- 20.Yu T, Jhun BS, Yoon Y. High-glucose stimulation increases reactive oxygen species production through the calcium and mitogen-activated protein kinase-mediated activation of mitochondrial fission. Antioxid Redox Signal 2011; 14:425–437. [DOI] [PMC free article] [PubMed] [Google Scholar]
- 21.Du H, Yan SS. Mitochondrial medicine for neurodegenerative diseases. Int J Biochem Cell Biol, 42:560–572. [DOI] [PMC free article] [PubMed] [Google Scholar]
- 22.Chen H, Chomyn A, Chan DC. Disruption of fusion results in mitochondrial heterogeneity and dysfunction. J Biol Chem 2005; 280:26185–26192. [DOI] [PubMed] [Google Scholar]
- 23.Chan DC. Mitochondria: dynamic organelles in disease, aging, and development. Cell 2006; 125:1241–1252. [DOI] [PubMed] [Google Scholar]
- 24.Santos RX, Correia SC, Wang X, Perry G, Smith MA, Moreira PI, Zhu X. A synergistic dysfunction of mitochondrial fission/fusion dynamics and mitophagy in Alzheimer’s disease. J Alzheimers Dis 2010; 20 (Suppl 2):S401–S412. [DOI] [PMC free article] [PubMed] [Google Scholar]
- 25.Wang X, Su B, Siedlak SL, Moreira PI, Fujioka H, Wang Y, et al. Amyloid-beta overproduction causes abnormal mitochondrial dynamics via differential modulation of mitochondrial fission/fusion proteins. Proc Natl Acad Sci USA 2008; 105:19318–19323. [DOI] [PMC free article] [PubMed] [Google Scholar]