

Abstract
Objective
To conduct an untargeted, high resolution exploration of metabolic pathways that were altered in association with hepatic steatosis in adolescents.
Study design
This prospective, case control study included 39 Hispanic-American, obese adolescents aged 11–17 years evaluated for hepatic steatosis using magnetic resonance spectroscopy. Of these 39 individuals, 30 had hepatic steatosis ≥ 5% and 9 were matched controls with hepatic steatosis < 5%). Fasting plasma samples were analyzed in triplicate using ultra-high resolution metabolomics on a Thermo Fisher Q Exactive mass spectrometer, coupled with C18 reverse phase liquid chromatography. Differences in plasma metabolites between adolescents with and without NAFLD was determined by independent t-tests and visualized using Manhattan plots. Untargeted pathway analyses using Mummichog were performed among the significant metabolites to identify pathways that were most dysregulated in NAFLD.
Results
The metabolomics analysis yielded 9,583 metabolites, and 7,711 with 80% presence across all samples remained for statistical testing. Of these, 478 metabolites were associated with the presence of NAFLD compared with the matched controls. Pathway analysis revealed that along with lipid metabolism, several major amino acid pathways were dysregulated in NAFLD, with tyrosine metabolism being the most affected.
Conclusions
Metabolic pathways of several amino acids are significantly disturbed in adolescents with elevated hepatic steatosis. This is a novel finding and suggests that these pathways may be integral in the mechanisms of NAFLD.
Keywords: tyrosine, tryptophan, methionine, branched-chain amino acids, mass spectrometry
Non-alcoholic fatty liver disease (NAFLD) has increased in prevalence and now is the most common chronic liver disease in children (1, 2). Hispanic-Americans have the highest risk of NAFLD possibly due to genetic variations, predisposition to increased adiposity, and increased exposure to high consumption of sugar-sweetened beverages (3–5). Much of our understanding of the pathogenesis of NAFLD is based upon evidence from animal models and studies in adults with NAFLD. Data in the pediatric population with NAFLD are still limited and studies exploring potential mechanisms are needed.
High resolution metabolomics is a powerful analytical tool that analyzes both individual metabolites and systemic alterations of signaling pathways for disease (6, 7). When applied as untargeted assays, high-resolution mass spectrometry can detect many endogenous metabolites, thus allowing novel discovery that is not limited to narrowly focused hypotheses. Recent advances in data extraction for ultra-high resolution mass spectrometry allow relative quantification of thousands of metabolites (8), including metabolites in 146 out of 154 known human metabolic pathways (9). A new pathway and network analysis tool used by our group and others, Mummichog, provides an approach for unbiased interrogation of high-resolution metabolomics data for all known metabolic pathways (10). In the current pilot study, we used these approaches in an exploratory, unbiased, untargeted metabolomics analysis of plasma samples from a group of well-matched adolescent with NAFLD and control participants to identify metabolic pathways that are dysregulated in adolescents with NAFLD.
METHODS
The study protocol was approved by the Emory University Institutional Review Board (IRB) and the Children’s Healthcare of Atlanta IRB; informed consent (parental consent for participants < 18 years) and assent were obtained for each participant. Recruitment methods and inclusion/exclusion criteria have been described in detail elsewhere (11). Briefly, we recruited adolescents aged 11–18 years, self-identified as Hispanics, BMI ≥ 85th percentile for age and sex, and daily consumption of sugar-sweetened beverages > 2. Exclusion criteria included chronic alcohol consumption, previously known liver disease, any other chronic disease requiring daily medication and any acute illness and anti-oxidation therapy/supplement prior to the enrollment. Cases and controls were recruited identically and assigned into the respective categories after evaluation and completion of the magnetic resonance spectroscopy (MRS) procedure. Presence of “presumed NAFLD” (cases) was defined as MRS for hepatic steatosis ≥5% (12, 13) in combination with typical clinical history. Controls were defined as those with hepatic steatosis <5%. The MRS procedure is described in detail elsewhere (14). Participants underwent a complete history, physical exam and laboratory evaluation. Their blood samples were collected in EDTA-coated tubes after an overnight fast (at least 12 hours), processed immediately, and stored at −80°C. All participants with baseline plasma samples available were included in this analysis.
Ultra-high resolution metabolomics analysis and data processing
Frozen plasma samples were transported on dry ice to the Emory Department of Medicine Clinical Biomarkers Laboratory and maintained at −80°C until analysis. Thawed samples were processed and analyzed using liquid chromatography with ultra-high resolution mass spectrometry (LC-MS) as previously described (15). Briefly, 20 samples, along with pooled reference sample, were prepared and analyzed on a daily basis to prevent freeze/thaw cycles. For each sample, 65μL of plasma was used and acetonitrile containing a mixture of 14 stable isotope internal standards was added to the aliquot at a 2:1 ratio in order to precipitate proteins (15). The samples were kept on ice for 30 minutes and then centrifuged for 10 minutes at 13,400 × rpm at 4°C. The supernatant was then removed and placed into autosampler vials. Mass spectral data were collected with a 10-minute gradient on a Dionex UltiMate 3000 rapid separation LC system coupled with a Thermo Q Exactive MS system (Thermo Fisher Scientific, San Diego, CA). Ions were scanned in the mass-to-charge ratio (m/z) range from 85 to 1275 in the positive ionization mode with a resolution of 70,000. Three technical replicates were run for each sample using dual column chromatography procedure (15) with C18 chromatography (Higgins analytical, 100×2.1mm columns). Data were stored as. raw files and converted to computable document format (CDF) using Xcalibur file converter software (Thermo Fisher Scientific, San Diego, CA) for further processing. Following LC-MS, the data were processed using apLCMS (16) and xMSanalyzer (8) to perform peak detection, noise filtering, m/z and retention time alignment, and feature quantification. The metabolite values were averaged for triplicates; and data were log2 transformed and subjected to quality assessment including exclusion of data for technical replicates with overall Pearson correlation (r) < 0.70. Extraction of mass spectral data initially yielded 9,583 metabolites. Of these, 7,711 metabolites were present in > 80% of samples and were used for subsequent analysis.
Statistical Analyses
Descriptive statistics for demographic and clinical data were performed using independent t-tests or Mann-Whitney U tests (for variables without normal distribution). SEx was compared by Fisher Exact tests. The differential expression of plasma metabolites between NAFLD and controls was determined using t-tests and visualized using Manhattan plots. False discovery rate (FDR) was computed using Benjamini-Hochberg method (17), which is important in biomarker discovery where adjustments for multiple comparisons are needed to protect against FDR. For our pathway discovery analysis, we used a more conservative approach that avoided FDR error, by including all metabolites that were significant (raw p value < 0.05) and then performing statistical testing of these metabolites for pathway enrichment. The 478 significant metabolites were depicted by a heat map and subjected to pathway analysis using Mummichog (10), a set of algorithms specifically designed for high-throughput metabolomics. To complement univariate statistics, we also performed linear regression model, adjusted for age and sex, to test the significance of metabolite association with steatosis.
RESULTS
The demographics and clinical data of the study population are summarized in Table I. All 39 participants were obese (BMI > 95th percentile for age and sex) and self-identified as Hispanic (16 boys and 23 girls). The average age and body weight of participants was 13.8 ± 2.43 years and 80.8 ± 18.2 kilograms (mean ± SD), respectively; and hepatic steatosis ranged from 2.66% to 27.0%. Compared with controls, adolescents with ≥5% hepatic steatosis had increased liver enzymes, plasma triglycerides, insulin, as well as insulin resistance (p < 0.05 for all). No significant differences were observed between the two groups in terms of age, sex, body weight, BMI z-score, plasma glucose, or other lipid measurements.
Table 1.
Demographic and clinical characteristics of study population.
| Total population (n=39)
|
Hepatic fat < 5% (n=9) |
Hepatic fat ≥ 5% (n=30) |
||
|---|---|---|---|---|
| Mean (SD) | Range | |||
| Age, years | 13.79 (2.43) | 11 – 18 | 14.44 (2.19) | 13.60 (2.50) |
| Male, n (%)† | 16 (41.03) | 3 (33.33) | 13 (43.33) | |
| Body weight (kg) | 80.75 (18.18) | 51.6 – 117 | 83.93 (23.88) | 9.80 (16.48) |
| BMI z-score | 2.06 (0.32) | 1.58 – 3.42 | 1.97 (0.27) | 2.09 (0.34) |
| Hepatic fat (%)* | 10.1 (5.97) | 2.66 – 27.0 | 3.75 (0.60) | 11.97 (5.52) |
| ALT (U/L)* | 35.90 (61.46) | 12.0 – 398 | 17.33 (6.16) | 41.47 (69.28) |
| AST (U/L)* | 55.10 (161.28) | 17.0 – 1035 | 20.33 (3.08) | 65.53 (183.28) |
| Triglyceride (mg/dl)* | 145.09 (101.04) | 34.1 – 456 | 79.60 (30.27) | 165.73 (106.75) |
| Cholesterol (mg/dl) | 166.08 (39.39) | 111 – 294 | 154.44 (22.58) | 169.57 (42.87) |
| LDL (mg/dl) | 105.83 (35.88) | 52.9 – 221 | 90.89 (26.20) | 110.32 (37.52) |
| HDL (mg/dl) | 44.24 (9.30) | 27.8 – 62.4 | 48.32 (9.59) | 43.01 (9.01) |
| Glucose (mg/dl) | 92.96 (17.54) | 29.3 – 128 | 92.43 (18.38) | 93.11 (17.61) |
| Insulin (mU/L)* | 32.47 (26.94) | 10.8 – 157 | 18.61 (6.57) | 36.92 (29.50) |
| HOMA-IR* | 7.75 (8.13) | 1.72 – 47.7 | 4.17 (1.28) | 8.91 (9.06) |
HOMA-IR was calculated as fasting glucose (mg/dl) * insulin (mU/L)/405; Data are expressed as mean (SD).
Values represent n (%).
p<0.05 comparing children with hepatic steatosis ≥ 5% to control individuals (hepatic steatosis < 5%).
Significant metabolites distinguish NAFLD from controls
To determine the metabolic differences between controls and adolescents with NAFLD, the 7,711 metabolites were analyzed by independent t-tests. Manhattan plots depict each as a function of the m/z and chromatographic retention time (Figure 1), with the indication of 478 metabolites above the p < 0.05 cutoff line. Figure 1, A shows that the metabolites vary over a broad range of molecular masses, from low mass metabolites such as metabolic intermediates to relatively high mass metabolites such as complex glycolipids. Additionally, Figure 1, B shows that many significant metabolites have retention times expected for lipophilic chemicals, e.g., fatty acids, sterols, glycerides and complex lipids. However, a relatively large fraction of the significant metabolites were eluted with characteristics of hydrophilic chemicals, such as amino acids and related metabolic intermediates.
Figure 1.
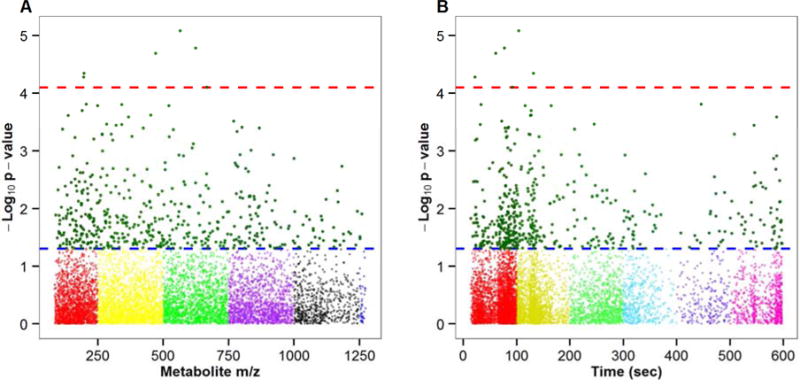
Plasma metabolites that were significantly associated with the presence of hepatic steatosis. (A) Type 1 Manhattan plot showing the negative log p (-log p) for each metabolite (m/z feature) as a function of the m/z (mass/charge). (B) Type 2 Manhattan plot showing the -log p for each metabolite as a function of chromatographic retention time. The 478 statistically significant features are shown in green above the dashed blue horizontal line (raw p < 0.05), and all other colors are arbitrary. The red dashed line indicates false discovery rate of 0.1 (Benjamini-Hochberg correction).
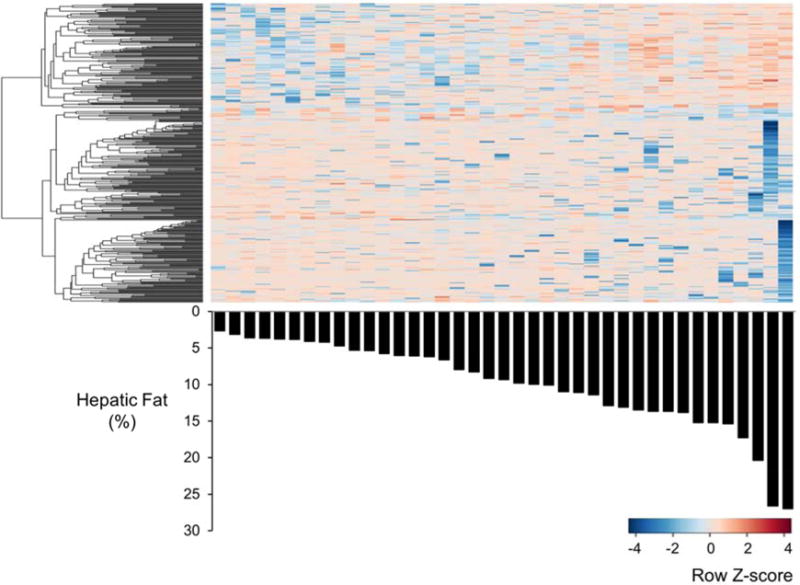
The average intensities of the 478 metabolites are graphed in the heat map (Figure 2, A) and exhibit a clear differential expression between adolescents with NAFLD and their matched overweight controls. Table II (available at www.jpeds.com) shows m/z, retention time, and p-value of these metabolites. Representative plots for metabolites comparison between NAFLD and control groups are included in Figure 2, B-E as examples. Given the unbalanced sample size between the groups, we also analyzed the data using linear regression models to complement univariate analysis. A total of 393 m/z were found to significantly correlate with the severity of hepatic steatosis after adjusting for age and sex. Corresponding Manhattan plots and heat map are provided (Figures 3 and 4; available at www.jpeds.com).
Figure 2.
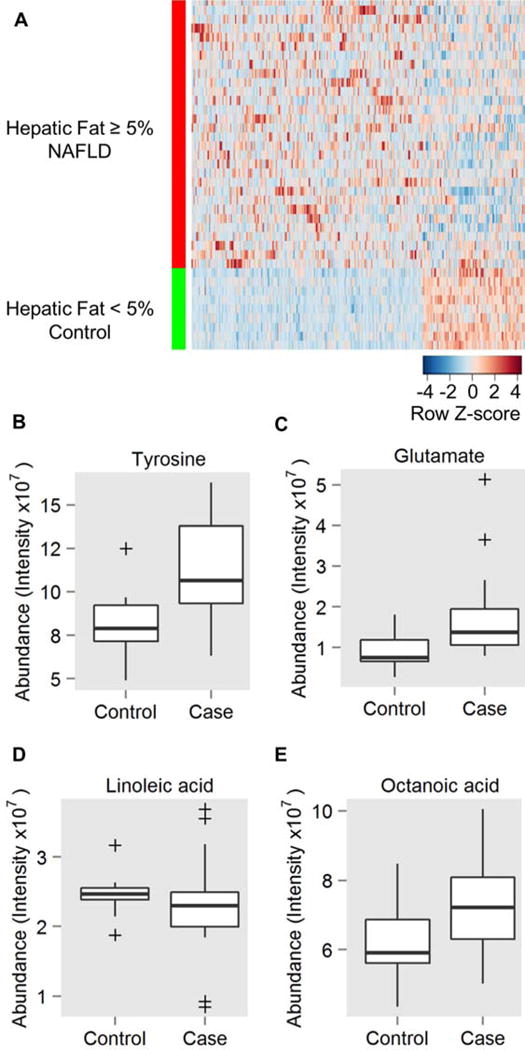
(A) Heat map generated using one-way hierarchical clustering. Metabolite intensities of the significant metabolites that were differentially expressed between NAFLD and controls. Each row represents a participant and each column represents a metabolite feature. The top 478 metabolites (raw p < 0.05) are shown. Blue hues indicate lower intensities and red hues indicate higher intensities. (B–E) Example metabolites are shown in the box plots.
Table 2 (online only).
The m/z, retention time, and p-value for those significant 478 metabolites identified by independent t-tests (raw p < 0.05) comparing children with and without hepatic steatosis.
| m/z | Retention Time (s) | T Statistic | raw p-value |
|---|---|---|---|
| 564.6704 | 103.7302 | 5.3668 | 0.00001 |
| 622.9683 | 76.5872 | 5.0294 | 0.00002 |
| 470.2060 | 60.8574 | 5.0189 | 0.00002 |
| 197.0487 | 131.2556 | 4.7355 | 0.00004 |
| 195.0863 | 21.8536 | 4.5793 | 0.0001 |
| 666.5207 | 91.8453 | −5.0373 | 0.0001 |
| 206.1391 | 446.1082 | 4.2328 | 0.0002 |
| 341.3288 | 32.8496 | −4.2120 | 0.0002 |
| 249.0717 | 115.4367 | 4.3380 | 0.0002 |
| 521.8654 | 164.4972 | 4.2446 | 0.0002 |
| 190.0778 | 126.8233 | 4.1449 | 0.0002 |
| 452.2795 | 126.9677 | 4.0762 | 0.0002 |
| 136.0761 | 125.6614 | 4.3482 | 0.0002 |
| 367.2467 | 587.0451 | 4.0393 | 0.0003 |
| 768.9362 | 72.1495 | 4.0444 | 0.0003 |
| 283.0689 | 244.9569 | 4.0480 | 0.0003 |
| 341.3169 | 31.6208 | −3.9391 | 0.0004 |
| 319.2759 | 544.8568 | −3.9582 | 0.0004 |
| 800.6766 | 84.2267 | −3.9731 | 0.0004 |
| 423.8866 | 78.3853 | 3.8950 | 0.0004 |
| 866.5883 | 83.0478 | 3.8940 | 0.0004 |
| 115.0954 | 208.2347 | −4.2216 | 0.0004 |
| 538.6645 | 101.0162 | −3.9448 | 0.0004 |
| 782.4976 | 79.6607 | 4.3143 | 0.0005 |
| 266.2485 | 507.9879 | 3.8228 | 0.0005 |
| 300.2000 | 122.9075 | 3.8599 | 0.0005 |
| 266.0387 | 125.0782 | 3.8300 | 0.0005 |
| 379.9297 | 81.5448 | 3.7964 | 0.0006 |
| 523.0735 | 141.5253 | 4.0897 | 0.0006 |
| 163.0365 | 80.6291 | 3.8330 | 0.0006 |
| 235.1805 | 25.2858 | −3.7801 | 0.0006 |
| 307.1512 | 22.6644 | 4.1669 | 0.0006 |
| 614.5962 | 95.9455 | −4.1692 | 0.0007 |
| 610.5617 | 83.2667 | −3.6363 | 0.0009 |
| 834.8247 | 87.8251 | 3.6830 | 0.0010 |
| 267.2283 | 141.2739 | −3.9441 | 0.0010 |
| 793.4005 | 217.3045 | 3.5249 | 0.0012 |
| 919.6810 | 183.4213 | 3.5418 | 0.0012 |
| 560.1350 | 302.7599 | −4.0643 | 0.0012 |
| 577.2120 | 587.1666 | 3.5064 | 0.0012 |
| 154.0877 | 133.4353 | 3.5124 | 0.0012 |
| 999.6405 | 581.5206 | 3.4846 | 0.0013 |
| 507.3484 | 54.6965 | 3.5058 | 0.0016 |
| 774.4945 | 84.2768 | −3.9937 | 0.0016 |
| 209.1865 | 124.6240 | 3.4477 | 0.0016 |
| 778.5758 | 89.4459 | −3.5277 | 0.0018 |
| 1181.7517 | 221.3542 | −3.5491 | 0.0019 |
| 784.7399 | 108.3482 | 3.3549 | 0.0019 |
| 102.0748 | 149.4992 | 3.7123 | 0.0019 |
| 267.0137 | 128.0370 | 3.3788 | 0.0020 |
| 308.0985 | 73.0300 | 3.3762 | 0.0020 |
| 814.6684 | 48.4064 | 3.3197 | 0.0020 |
| 362.2912 | 585.8737 | 3.8226 | 0.0021 |
| 437.8643 | 107.6672 | −3.7811 | 0.0021 |
| 507.2225 | 69.6853 | 3.3322 | 0.0021 |
| 170.0602 | 123.8347 | 3.4860 | 0.0021 |
| 825.5185 | 67.4989 | 3.2912 | 0.0023 |
| 182.0818 | 121.0438 | 3.5968 | 0.0024 |
| 193.1592 | 545.9001 | 3.2825 | 0.0024 |
| 665.6079 | 341.0599 | 3.2602 | 0.0025 |
| 229.0584 | 229.9666 | 3.2845 | 0.0026 |
| 388.9553 | 75.9072 | −3.5324 | 0.0026 |
| 285.0705 | 150.6155 | 3.2195 | 0.0027 |
| 221.1907 | 470.1963 | 3.3020 | 0.0028 |
| 259.9968 | 80.3682 | 3.2509 | 0.0029 |
| 162.9115 | 134.8087 | 3.1675 | 0.0031 |
| 352.3007 | 592.7982 | −3.1680 | 0.0033 |
| 418.2810 | 22.2902 | −3.2473 | 0.0034 |
| 178.1595 | 18.6617 | −3.1746 | 0.0034 |
| 579.3833 | 207.3417 | 3.1617 | 0.0034 |
| 201.1121 | 25.7369 | 3.1272 | 0.0035 |
| 148.0608 | 132.0117 | 3.1936 | 0.0035 |
| 623.2896 | 557.4474 | 3.4219 | 0.0036 |
| 223.9639 | 137.8016 | 3.0888 | 0.0039 |
| 583.1235 | 195.8330 | 3.0890 | 0.0039 |
| 282.2515 | 547.4747 | −3.1126 | 0.0040 |
| 449.1595 | 98.6643 | 3.0780 | 0.0040 |
| 663.8577 | 78.8377 | 3.1136 | 0.0040 |
| 904.2113 | 247.4826 | 3.0795 | 0.0040 |
| 166.0648 | 129.5959 | 3.0685 | 0.0041 |
| 124.8976 | 78.6455 | −3.3973 | 0.0041 |
| 318.2731 | 544.0071 | −3.1153 | 0.0042 |
| 452.2779 | 560.7656 | 3.0920 | 0.0043 |
| 672.4963 | 99.7173 | 3.2594 | 0.0045 |
| 534.2564 | 566.8856 | 3.0258 | 0.0045 |
| 210.0964 | 120.3541 | 3.0665 | 0.0045 |
| 194.0073 | 87.0393 | 3.0781 | 0.0048 |
| 245.1383 | 35.9803 | 3.0517 | 0.0048 |
| 98.0589 | 131.1315 | 3.0253 | 0.0048 |
| 368.1605 | 269.2046 | 3.0305 | 0.0049 |
| 1165.5730 | 260.4608 | 3.1213 | 0.0049 |
| 494.7287 | 100.0588 | −3.1010 | 0.0050 |
| 169.9560 | 320.6431 | 2.9995 | 0.0050 |
| 189.0757 | 121.3408 | 3.2227 | 0.0051 |
| 797.6654 | 207.8353 | 3.0242 | 0.0052 |
| 299.9137 | 489.6902 | 2.9842 | 0.0053 |
| 896.7103 | 95.1996 | 2.9803 | 0.0054 |
| 189.5239 | 132.7676 | −3.4619 | 0.0054 |
| 330.9340 | 76.5588 | 2.9842 | 0.0056 |
| 212.0079 | 473.3980 | 3.1674 | 0.0056 |
| 778.5381 | 85.1197 | 2.9454 | 0.0056 |
| 480.7065 | 101.2657 | −3.4057 | 0.0058 |
| 132.1430 | 126.6855 | 3.0003 | 0.0058 |
| 260.9497 | 77.5716 | 2.9202 | 0.0059 |
| 640.1787 | 250.5106 | 2.9304 | 0.0060 |
| 833.0242 | 175.5403 | 2.9127 | 0.0061 |
| 828.5519 | 81.0809 | −3.0716 | 0.0062 |
| 847.2484 | 241.6592 | 2.9070 | 0.0062 |
| 793.4369 | 186.8270 | 2.8983 | 0.0063 |
| 373.2334 | 68.3125 | 2.9200 | 0.0065 |
| 350.0669 | 132.7095 | 3.0474 | 0.0066 |
| 803.0938 | 268.8463 | −3.1003 | 0.0066 |
| 1121.5527 | 179.9437 | 2.9618 | 0.0068 |
| 848.4299 | 90.7924 | −2.9672 | 0.0069 |
| 211.0507 | 129.8802 | 2.8552 | 0.0071 |
| 258.1197 | 98.4465 | −3.1716 | 0.0072 |
| 927.4948 | 285.2016 | 2.9972 | 0.0072 |
| 175.1381 | 502.8493 | 2.9956 | 0.0074 |
| 447.3486 | 39.2154 | −2.8738 | 0.0074 |
| 726.0279 | 170.1583 | 2.8357 | 0.0075 |
| 892.5056 | 93.8288 | 2.9957 | 0.0075 |
| 530.3167 | 593.7240 | 2.9923 | 0.0075 |
| 1167.3704 | 260.9473 | 2.8464 | 0.0076 |
| 447.3486 | 592.5028 | −3.0211 | 0.0076 |
| 654.2286 | 73.7277 | −3.0762 | 0.0078 |
| 252.9976 | 539.6478 | 2.8389 | 0.0078 |
| 247.0131 | 276.2647 | 2.8053 | 0.0080 |
| 187.1117 | 162.1547 | 2.7994 | 0.0081 |
| 187.1151 | 162.1547 | 2.7994 | 0.0081 |
| 187.1077 | 162.1547 | 2.7993 | 0.0081 |
| 426.7416 | 101.0215 | −3.1152 | 0.0082 |
| 569.3837 | 117.0912 | 2.7965 | 0.0083 |
| 544.6574 | 96.4219 | −2.8947 | 0.0084 |
| 502.0880 | 121.1091 | 2.8844 | 0.0085 |
| 186.9566 | 354.3669 | 3.1402 | 0.0087 |
| 435.0181 | 91.0522 | 2.7832 | 0.0088 |
| 866.4012 | 95.7060 | −3.0159 | 0.0090 |
| 596.5350 | 84.6994 | −2.9484 | 0.0091 |
| 829.4990 | 104.7474 | 2.7537 | 0.0092 |
| 678.9260 | 68.0021 | −2.9025 | 0.0092 |
| 600.6183 | 93.3924 | −2.9905 | 0.0092 |
| 111.0209 | 22.7036 | 2.8411 | 0.0095 |
| 451.3270 | 72.0344 | 2.7386 | 0.0095 |
| 862.3149 | 94.9421 | 2.7395 | 0.0095 |
| 145.9857 | 576.4479 | −2.8601 | 0.0097 |
| 224.0917 | 70.6154 | 2.7787 | 0.0102 |
| 288.1240 | 588.1791 | 2.7188 | 0.0104 |
| 135.1019 | 207.5538 | 2.7131 | 0.0104 |
| 166.0549 | 132.5779 | 2.9916 | 0.0107 |
| 915.4584 | 301.4019 | −3.0782 | 0.0108 |
| 274.8735 | 122.6094 | 2.6825 | 0.0111 |
| 1241.3517 | 463.4331 | −3.1503 | 0.0111 |
| 560.0789 | 308.7494 | 2.7702 | 0.0112 |
| 1001.7593 | 340.1007 | 2.6826 | 0.0113 |
| 750.6704 | 82.7363 | 2.6923 | 0.0114 |
| 414.2700 | 96.0740 | 2.6727 | 0.0115 |
| 744.6495 | 83.6059 | 2.8450 | 0.0115 |
| 285.2059 | 575.9652 | −2.6886 | 0.0118 |
| 148.0276 | 106.9030 | 2.6709 | 0.0119 |
| 634.5708 | 83.7423 | 3.0013 | 0.0119 |
| 147.0032 | 83.9463 | 2.6760 | 0.0121 |
| 854.6031 | 93.4644 | 2.7551 | 0.0121 |
| 135.0791 | 515.9009 | −2.7470 | 0.0122 |
| 1259.2139 | 462.6762 | −2.9954 | 0.0124 |
| 282.2514 | 23.4233 | −2.7987 | 0.0125 |
| 202.9881 | 348.8864 | 2.7443 | 0.0126 |
| 217.0041 | 369.9174 | 2.8815 | 0.0127 |
| 275.8894 | 21.6391 | 2.8837 | 0.0129 |
| 89.0089 | 539.6976 | 2.7272 | 0.0129 |
| 832.7747 | 80.5941 | 2.6544 | 0.0130 |
| 219.1393 | 99.1404 | 2.6275 | 0.0130 |
| 102.0555 | 106.4840 | 2.7922 | 0.0130 |
| 348.2897 | 99.7025 | 2.6131 | 0.0134 |
| 320.8704 | 129.8703 | −3.0099 | 0.0134 |
| 860.7103 | 88.7020 | 2.5965 | 0.0135 |
| 1047.6533 | 72.5185 | 2.6024 | 0.0135 |
| 1102.7593 | 72.5831 | 2.5942 | 0.0135 |
| 213.0190 | 361.8103 | 2.9349 | 0.0136 |
| 517.2432 | 473.3033 | 2.6222 | 0.0136 |
| 129.0189 | 317.1095 | −2.7428 | 0.0136 |
| 556.6381 | 101.4486 | −2.7282 | 0.0136 |
| 187.1269 | 36.5466 | −2.6674 | 0.0137 |
| 409.2809 | 66.1889 | 2.5835 | 0.0139 |
| 295.6430 | 523.1791 | 2.6922 | 0.0140 |
| 358.2783 | 124.1527 | −2.8579 | 0.0142 |
| 325.3101 | 38.1803 | 2.5931 | 0.0142 |
| 796.1174 | 305.9222 | 2.6361 | 0.0142 |
| 223.0851 | 85.8950 | 2.5909 | 0.0142 |
| 728.4268 | 94.3450 | 2.6426 | 0.0142 |
| 467.8028 | 499.9916 | −2.8821 | 0.0146 |
| 219.1960 | 587.8024 | 2.7175 | 0.0147 |
| 118.2265 | 14.1699 | −2.6811 | 0.0147 |
| 129.1107 | 228.5618 | −2.8424 | 0.0147 |
| 235.1544 | 311.3332 | 2.5576 | 0.0148 |
| 496.3116 | 24.2735 | 2.6757 | 0.0151 |
| 484.6121 | 86.3039 | −2.6291 | 0.0153 |
| 837.2825 | 312.2886 | 2.5944 | 0.0154 |
| 1058.7736 | 69.7802 | 2.5504 | 0.0155 |
| 154.0366 | 128.4183 | 2.5373 | 0.0155 |
| 345.0605 | 74.7797 | 2.8200 | 0.0155 |
| 1105.5425 | 213.0835 | 2.6048 | 0.0156 |
| 339.2361 | 556.9816 | 2.5414 | 0.0157 |
| 1105.7749 | 70.1157 | 2.5362 | 0.0157 |
| 154.0593 | 121.0715 | 2.5329 | 0.0157 |
| 528.3095 | 595.9483 | 2.6123 | 0.0159 |
| 104.1362 | 95.5367 | 2.6881 | 0.0160 |
| 234.1336 | 63.1877 | 2.5187 | 0.0163 |
| 165.5575 | 136.3536 | 2.5171 | 0.0164 |
| 579.1344 | 109.9877 | 2.5390 | 0.0165 |
| 279.1452 | 300.5276 | 2.6426 | 0.0166 |
| 469.3570 | 53.1636 | 2.6224 | 0.0166 |
| 231.1128 | 72.2441 | 2.5023 | 0.0169 |
| 231.1236 | 72.2441 | 2.5023 | 0.0169 |
| 706.5231 | 594.3112 | −2.6764 | 0.0169 |
| 279.2326 | 528.7537 | −2.6787 | 0.0169 |
| 425.0165 | 73.2281 | 2.5085 | 0.0170 |
| 926.1804 | 96.1400 | 2.5113 | 0.0171 |
| 710.4761 | 595.1054 | 2.5159 | 0.0173 |
| 295.2273 | 26.0998 | −2.7496 | 0.0174 |
| 325.2382 | 22.0334 | −2.5098 | 0.0175 |
| 361.1267 | 79.3354 | 2.5080 | 0.0175 |
| 356.3532 | 130.1361 | −2.6332 | 0.0176 |
| 345.0469 | 75.0731 | 2.7016 | 0.0176 |
| 354.1069 | 25.7248 | 2.5636 | 0.0177 |
| 281.2480 | 19.0961 | −2.6569 | 0.0177 |
| 676.6365 | 105.9327 | −2.6553 | 0.0181 |
| 868.3215 | 72.5550 | −2.6259 | 0.0182 |
| 104.0793 | 88.9202 | 2.6367 | 0.0185 |
| 455.1786 | 65.9654 | −2.4705 | 0.0186 |
| 389.7279 | 49.8795 | 2.4962 | 0.0187 |
| 931.7749 | 166.6826 | −2.7030 | 0.0187 |
| 557.4353 | 57.4045 | −2.4806 | 0.0188 |
| 572.3731 | 564.0842 | −2.5974 | 0.0190 |
| 143.9592 | 322.8608 | 2.6273 | 0.0191 |
| 166.0585 | 126.3036 | 2.4888 | 0.0191 |
| 1034.7729 | 67.0585 | 2.4558 | 0.0192 |
| 595.2587 | 521.2635 | 2.5426 | 0.0192 |
| 442.8035 | 110.2401 | −2.7745 | 0.0193 |
| 639.6075 | 358.1871 | 2.5938 | 0.0194 |
| 404.8208 | 84.6725 | −2.4539 | 0.0195 |
| 236.0414 | 130.6668 | 2.4636 | 0.0198 |
| 359.1523 | 133.0009 | 2.4429 | 0.0199 |
| 980.5823 | 582.5947 | 2.5141 | 0.0199 |
| 184.0734 | 66.8144 | 2.4321 | 0.0200 |
| 168.9048 | 97.3294 | −2.4382 | 0.0200 |
| 445.3425 | 65.4284 | 2.5828 | 0.0201 |
| 771.9704 | 28.1106 | 2.5596 | 0.0204 |
| 831.4737 | 208.4953 | −2.5600 | 0.0204 |
| 186.1130 | 126.4227 | 2.4683 | 0.0205 |
| 820.5590 | 69.5054 | −2.6267 | 0.0206 |
| 248.9767 | 84.2778 | 2.4652 | 0.0208 |
| 295.2273 | 579.7409 | −2.6377 | 0.0208 |
| 385.9734 | 126.9202 | 2.4422 | 0.0210 |
| 1150.8187 | 144.3391 | 2.4890 | 0.0212 |
| 948.8084 | 69.3628 | 2.4292 | 0.0213 |
| 896.3576 | 94.9330 | 2.4412 | 0.0215 |
| 275.1642 | 46.6458 | 2.4013 | 0.0215 |
| 445.1129 | 84.5835 | 2.5032 | 0.0217 |
| 816.9029 | 77.4875 | 2.4308 | 0.0218 |
| 549.8218 | 41.2542 | −2.7123 | 0.0218 |
| 191.1283 | 359.9311 | 2.4544 | 0.0218 |
| 877.7280 | 105.6176 | 2.3947 | 0.0218 |
| 707.4569 | 70.1211 | 2.4140 | 0.0219 |
| 371.2997 | 128.2872 | 2.3909 | 0.0220 |
| 1072.7817 | 71.8534 | 2.4053 | 0.0222 |
| 978.3208 | 244.0231 | −2.5098 | 0.0223 |
| 708.1685 | 309.4535 | −2.5163 | 0.0224 |
| 253.0116 | 131.9862 | 2.3856 | 0.0230 |
| 162.9772 | 82.2204 | 2.3981 | 0.0231 |
| 535.8393 | 527.4886 | −2.4839 | 0.0231 |
| 196.0916 | 195.2546 | 2.5609 | 0.0233 |
| 461.2888 | 596.6725 | 2.5013 | 0.0237 |
| 1072.2832 | 75.2269 | 2.3582 | 0.0238 |
| 159.1133 | 138.4637 | 2.5733 | 0.0241 |
| 245.1020 | 35.4256 | 2.3777 | 0.0242 |
| 264.9431 | 88.3105 | 2.3655 | 0.0243 |
| 444.3689 | 583.2432 | 2.4694 | 0.0245 |
| 217.5729 | 135.0681 | 2.3623 | 0.0247 |
| 261.1315 | 479.8815 | 2.4541 | 0.0247 |
| 436.3647 | 39.8249 | −2.5429 | 0.0247 |
| 688.5336 | 93.4485 | −2.3405 | 0.0248 |
| 1108.9444 | 318.8944 | 2.5145 | 0.0249 |
| 657.5453 | 355.1619 | 2.3887 | 0.0251 |
| 170.1373 | 490.1952 | −2.5120 | 0.0251 |
| 100.9176 | 85.1854 | −2.4668 | 0.0252 |
| 1207.7541 | 68.1324 | 2.3462 | 0.0253 |
| 482.3260 | 23.7066 | 2.3981 | 0.0260 |
| 652.7199 | 94.8171 | 2.5767 | 0.0260 |
| 598.6204 | 98.5461 | −2.5703 | 0.0261 |
| 416.0745 | 543.6826 | 2.4391 | 0.0261 |
| 441.1670 | 79.3222 | 2.3412 | 0.0262 |
| 877.4990 | 165.9005 | 2.3279 | 0.0263 |
| 830.3651 | 82.5107 | −2.4899 | 0.0263 |
| 120.0911 | 130.7559 | 2.5128 | 0.0263 |
| 484.7888 | 98.8744 | −2.3791 | 0.0263 |
| 485.2113 | 61.3019 | 2.3238 | 0.0264 |
| 315.1787 | 460.3038 | 2.4885 | 0.0266 |
| 104.0981 | 93.3120 | 2.3594 | 0.0267 |
| 679.2538 | 407.3213 | −2.5571 | 0.0267 |
| 323.1625 | 582.2947 | 2.4344 | 0.0270 |
| 102.1195 | 503.2219 | 2.3429 | 0.0271 |
| 858.4561 | 96.6583 | −2.5782 | 0.0271 |
| 187.1441 | 113.0096 | 2.3204 | 0.0274 |
| 190.9464 | 84.5877 | 2.2960 | 0.0274 |
| 343.9646 | 123.0149 | 2.3204 | 0.0275 |
| 590.5899 | 82.2671 | −2.4765 | 0.0275 |
| 225.1968 | 526.0273 | 2.4011 | 0.0275 |
| 1215.6004 | 274.9095 | 2.4501 | 0.0276 |
| 746.6210 | 104.5098 | 2.3966 | 0.0277 |
| 245.0921 | 37.0751 | 2.3033 | 0.0279 |
| 1188.7338 | 67.5009 | 2.2926 | 0.0280 |
| 759.2342 | 317.2024 | 2.2862 | 0.0282 |
| 207.1109 | 86.2525 | 2.3008 | 0.0284 |
| 118.0657 | 124.8134 | 2.4902 | 0.0286 |
| 365.2111 | 60.8906 | 2.2923 | 0.0288 |
| 447.7519 | 138.5800 | 2.2770 | 0.0290 |
| 110.0096 | 93.4538 | 2.2863 | 0.0290 |
| 167.9825 | 319.2683 | −2.4854 | 0.0291 |
| 233.1563 | 90.5420 | 2.2748 | 0.0291 |
| 187.1481 | 111.3600 | 2.2891 | 0.0293 |
| 234.2052 | 433.6214 | 2.2997 | 0.0294 |
| 495.9385 | 21.9147 | 2.3944 | 0.0295 |
| 524.3022 | 25.6931 | 2.3349 | 0.0295 |
| 850.5132 | 105.4149 | −2.5127 | 0.0297 |
| 457.0221 | 150.4271 | 2.4917 | 0.0297 |
| 595.2586 | 17.5468 | 2.3994 | 0.0302 |
| 859.3958 | 271.7200 | 2.3193 | 0.0306 |
| 674.4755 | 86.1487 | −2.3594 | 0.0306 |
| 1014.1575 | 36.2651 | 2.2473 | 0.0307 |
| 460.0088 | 142.4104 | 2.2685 | 0.0307 |
| 208.0398 | 136.5522 | 2.3691 | 0.0307 |
| 305.2481 | 591.8352 | −2.4250 | 0.0309 |
| 300.1339 | 128.4823 | 2.2717 | 0.0311 |
| 1251.2848 | 152.0316 | 2.2727 | 0.0311 |
| 252.5076 | 55.3442 | 2.2392 | 0.0312 |
| 789.6844 | 46.6586 | 2.3040 | 0.0314 |
| 1079.4905 | 250.0460 | −2.3938 | 0.0316 |
| 350.9880 | 300.2569 | −2.3329 | 0.0317 |
| 626.9902 | 77.5762 | 2.2300 | 0.0322 |
| 580.5598 | 82.4311 | −2.3528 | 0.0323 |
| 616.5945 | 100.6188 | −2.3652 | 0.0323 |
| 345.2836 | 128.5798 | 2.3025 | 0.0324 |
| 309.0170 | 116.4402 | 2.3183 | 0.0324 |
| 95.0717 | 130.7708 | 2.2355 | 0.0324 |
| 328.9848 | 78.7879 | 2.2398 | 0.0327 |
| 1097.3191 | 280.2955 | −2.4441 | 0.0330 |
| 828.8125 | 68.4051 | 2.3257 | 0.0331 |
| 151.1445 | 116.9770 | 2.2379 | 0.0332 |
| 664.4912 | 97.0853 | −2.2183 | 0.0332 |
| 1251.7460 | 208.6278 | 2.2245 | 0.0333 |
| 183.0787 | 123.2713 | 2.3669 | 0.0336 |
| 497.0996 | 84.5807 | −2.3425 | 0.0338 |
| 882.7310 | 99.9430 | 2.2311 | 0.0338 |
| 882.1906 | 276.8319 | 2.3391 | 0.0342 |
| 779.2546 | 243.8686 | 2.2497 | 0.0344 |
| 131.0709 | 318.8327 | −2.3231 | 0.0344 |
| 389.3979 | 135.7407 | 2.2121 | 0.0344 |
| 525.2800 | 578.5024 | −2.3808 | 0.0351 |
| 502.7594 | 111.0335 | −2.3387 | 0.0351 |
| 670.6029 | 106.6893 | −2.3474 | 0.0352 |
| 179.1436 | 486.2833 | 2.2766 | 0.0352 |
| 846.3419 | 86.9474 | −2.2969 | 0.0354 |
| 453.0664 | 90.6766 | 2.2011 | 0.0354 |
| 770.6317 | 93.7486 | −2.4255 | 0.0355 |
| 166.9952 | 438.0766 | 2.2501 | 0.0355 |
| 431.1277 | 86.1175 | 2.2018 | 0.0355 |
| 736.5053 | 90.1780 | −2.3195 | 0.0358 |
| 1112.3215 | 143.4791 | 2.1926 | 0.0358 |
| 1153.3876 | 240.2124 | 2.2773 | 0.0359 |
| 848.3362 | 88.0847 | −2.3620 | 0.0360 |
| 1158.7866 | 38.2660 | 2.1805 | 0.0365 |
| 391.8027 | 80.4556 | 2.1794 | 0.0365 |
| 1189.6000 | 253.7042 | 2.2593 | 0.0366 |
| 997.2397 | 174.1947 | 2.1786 | 0.0368 |
| 312.1731 | 538.2499 | −2.2384 | 0.0368 |
| 361.2720 | 67.6739 | −2.1873 | 0.0370 |
| 131.0251 | 36.7777 | −2.3801 | 0.0371 |
| 646.5170 | 94.1426 | −2.1733 | 0.0371 |
| 173.1536 | 127.3142 | 2.1628 | 0.0371 |
| 789.2857 | 297.8826 | −2.3643 | 0.0371 |
| 499.1599 | 146.7845 | −2.4327 | 0.0372 |
| 799.6810 | 266.5944 | 2.1798 | 0.0373 |
| 351.9915 | 120.4191 | 2.2409 | 0.0373 |
| 436.7708 | 104.4612 | −2.3114 | 0.0374 |
| 408.2583 | 48.7209 | −2.2533 | 0.0378 |
| 515.1166 | 79.3632 | −2.4550 | 0.0379 |
| 142.1424 | 44.4855 | −2.1770 | 0.0379 |
| 226.1809 | 482.3806 | 2.1599 | 0.0380 |
| 193.1574 | 88.3561 | 2.1700 | 0.0381 |
| 328.1543 | 86.2151 | 2.1702 | 0.0381 |
| 245.2270 | 547.9524 | −2.4094 | 0.0382 |
| 621.4725 | 74.6469 | 2.1766 | 0.0383 |
| 700.6511 | 96.8308 | −2.2294 | 0.0384 |
| 196.9733 | 83.4755 | −2.2640 | 0.0386 |
| 158.8751 | 82.1926 | −2.3395 | 0.0387 |
| 720.7057 | 99.7494 | 2.2550 | 0.0387 |
| 223.5679 | 136.3991 | 2.1433 | 0.0388 |
| 623.3116 | 170.7596 | 2.1407 | 0.0390 |
| 1065.6865 | 35.2074 | −2.3829 | 0.0391 |
| 397.2221 | 63.2341 | −2.2183 | 0.0392 |
| 812.6152 | 44.8832 | −2.1999 | 0.0393 |
| 734.4685 | 85.0038 | −2.2946 | 0.0393 |
| 287.1005 | 86.1880 | 2.1598 | 0.0396 |
| 213.1104 | 444.6036 | 2.1752 | 0.0396 |
| 490.3903 | 559.4256 | 2.1870 | 0.0398 |
| 593.1501 | 233.4651 | −2.2375 | 0.0399 |
| 660.4890 | 596.2891 | −2.3013 | 0.0400 |
| 386.2575 | 44.9159 | −2.2348 | 0.0401 |
| 1001.9471 | 269.8929 | 2.2201 | 0.0402 |
| 857.2710 | 281.3829 | 2.2175 | 0.0402 |
| 212.9999 | 75.1502 | 2.1556 | 0.0404 |
| 510.7562 | 80.5582 | 2.1384 | 0.0404 |
| 795.6106 | 588.3803 | −2.2231 | 0.0404 |
| 117.1109 | 32.2339 | 2.1857 | 0.0407 |
| 424.2159 | 53.2928 | −2.3126 | 0.0408 |
| 390.3586 | 596.9991 | −2.1804 | 0.0408 |
| 210.1349 | 171.0087 | 2.1251 | 0.0410 |
| 531.3522 | 68.0133 | −2.3699 | 0.0413 |
| 542.9288 | 75.7276 | 2.1222 | 0.0413 |
| 143.0705 | 331.2408 | 2.3199 | 0.0416 |
| 130.0656 | 124.4059 | 2.2348 | 0.0421 |
| 964.5641 | 101.2439 | 2.1772 | 0.0421 |
| 399.3310 | 130.5402 | 2.1299 | 0.0422 |
| 262.5283 | 133.1886 | 2.1566 | 0.0423 |
| 384.8092 | 80.3859 | 2.1231 | 0.0424 |
| 954.7005 | 91.9812 | 2.1017 | 0.0425 |
| 1175.7615 | 38.3434 | 2.1111 | 0.0428 |
| 649.3794 | 64.0310 | 2.1271 | 0.0428 |
| 1235.5691 | 295.0008 | −2.3212 | 0.0430 |
| 1055.6444 | 33.7153 | 2.1190 | 0.0433 |
| 500.3524 | 23.3518 | 2.2036 | 0.0434 |
| 486.7859 | 101.4374 | −2.2061 | 0.0434 |
| 771.4889 | 31.5850 | 2.1101 | 0.0434 |
| 869.7957 | 253.5504 | 2.1737 | 0.0436 |
| 286.9080 | 76.9940 | −2.2884 | 0.0438 |
| 906.8006 | 73.4232 | −2.1955 | 0.0438 |
| 290.8561 | 101.3444 | −2.2183 | 0.0438 |
| 106.0505 | 130.9749 | 2.1779 | 0.0438 |
| 608.6493 | 98.5103 | −2.2439 | 0.0440 |
| 717.5453 | 199.5778 | 2.1056 | 0.0442 |
| 185.0080 | 478.2734 | 2.1532 | 0.0443 |
| 475.0035 | 75.4333 | 2.1681 | 0.0444 |
| 1093.7357 | 238.7050 | 2.1502 | 0.0445 |
| 671.1818 | 317.2536 | 2.1774 | 0.0448 |
| 729.5927 | 22.9846 | −2.2322 | 0.0448 |
| 825.4069 | 181.9744 | 2.0934 | 0.0448 |
| 245.1285 | 34.8544 | 2.0759 | 0.0452 |
| 300.2620 | 549.8782 | −2.2133 | 0.0452 |
| 491.1184 | 180.8856 | −2.2224 | 0.0452 |
| 909.0992 | 223.0298 | 2.1000 | 0.0456 |
| 104.1213 | 94.8793 | 2.1200 | 0.0457 |
| 481.3029 | 586.9917 | 2.0889 | 0.0460 |
| 945.6711 | 69.6305 | 2.0744 | 0.0461 |
| 519.1133 | 75.5853 | 2.1122 | 0.0462 |
| 1152.7704 | 70.3388 | 2.0650 | 0.0466 |
| 491.1286 | 179.7062 | −2.1634 | 0.0467 |
| 331.2096 | 423.8635 | 2.0829 | 0.0469 |
| 1019.4478 | 247.4423 | −2.1895 | 0.0471 |
| 153.0663 | 153.2820 | 2.1464 | 0.0472 |
| 1016.1720 | 31.0947 | 2.0532 | 0.0472 |
| 934.3890 | 99.7433 | −2.2351 | 0.0475 |
| 291.0863 | 79.1524 | 2.0504 | 0.0477 |
| 273.0471 | 131.6236 | −2.1688 | 0.0479 |
| 421.2714 | 50.4030 | −2.1603 | 0.0482 |
| 811.4277 | 155.2491 | 2.0601 | 0.0482 |
| 924.4951 | 110.9436 | 2.0468 | 0.0483 |
| 537.1908 | 280.4257 | −2.2821 | 0.0486 |
| 220.9603 | 83.6205 | 2.0413 | 0.0486 |
| 768.5556 | 586.8200 | −2.1504 | 0.0487 |
| 566.2278 | 89.4311 | 2.0411 | 0.0488 |
| 238.2169 | 583.1807 | 2.0981 | 0.0492 |
| 308.9233 | 86.8955 | 2.1327 | 0.0492 |
| 130.1230 | 342.0550 | −2.1568 | 0.0494 |
| 668.6039 | 100.7552 | −2.0926 | 0.0496 |
| 161.0926 | 131.8532 | 2.0364 | 0.0496 |
| 189.9974 | 318.2937 | 2.1875 | 0.0497 |
| 266.9383 | 76.8595 | 2.0624 | 0.0497 |
| 741.8390 | 68.2700 | 2.0278 | 0.0499 |
Figure 3.
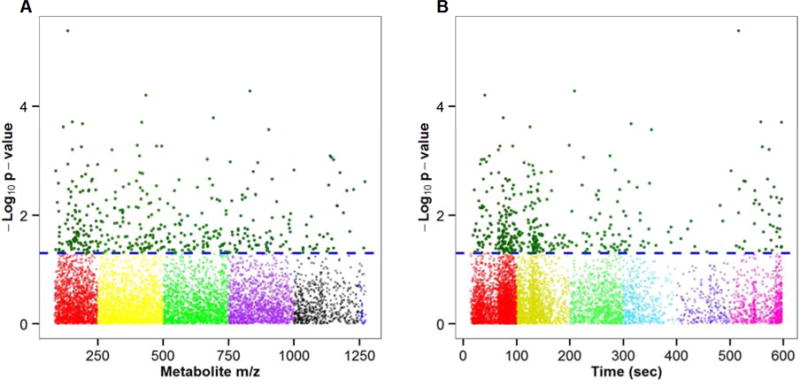
Figure 4.
Amino acid and fatty acid pathways are dysregulated in NAFLD
To explore underlying pathways dysregulated in adolescents with NAFLD, we used the software tool Mummichog (10) to test for significant pathways. As expected, multiple lipid metabolism pathways were affected such as de novo lipogenesis and fatty acid metabolism. Interestingly, a series of amino acid metabolic pathways were also dysregulated in adolescents with NAFLD (Table III). Of note, tyrosine metabolism was the most dysregulated pathway in adolescents with NAFLD. Furthermore, a strong positive association between plasma tyrosine levels and hepatic steatosis was observed even after controlling for age, sex, BMI z-score, insulin, and HOMA-IR (Table IV; available at www.jpeds.com). We also performed the pathway analysis based upon the 393 metabolites identified by the regression model (Table III). In both models, tyrosine metabolism was the most affected pathway. Other altered amino acid pathways included branched-chain amino acids (BCAA), methionine and cysteine.
Table 3.
Significantly dysregulated pathways in NAFLD. The 478 significant metabolites from Student’s t-test and 393 significant metabolites from regression model were used as Mummichog input, respectively. Only pathways with more than five hits of significant metabolites (overlap size) are shown.
| Pathway | Input from t-test | Input from regression model | ||
|---|---|---|---|---|
| overlap size | p-value | overlap size | p-value | |
| Tyrosine metabolism | 17 | <0.001 | 15 | 0.002 |
| Fatty acid activation | 9 | <0.001 | ||
| de novo lipogenesis | 8 | <0.001 | ||
| Linoleate metabolism | 6 | <0.001 | ||
| Vitamin E metabolism | 9 | <0.001 | ||
| Trypmiddlehan metabolism | 10 | 0.001 | ||
| Glycerophospholipid metabolism | 8 | 0.001 | ||
| Drug metabolism - cytochrome P450 | 8 | 0.002 | ||
| Purine metabolism | 10 | 0.003 | ||
| Pyrimidine metabolism | 7 | 0.003 | ||
| Glycine, serine, alanine, and threonine metabolism | 7 | 0.013 | 8 | 0.035 |
| Leukotriene metabolism | 7 | 0.016 | ||
| Methionine and cysteine metabolism | 7 | 0.020 | ||
| Valine, leucine and isoleucine degradation | 7 | 0.039 | ||
Table 4.
β coefficients for the association between hepatic steatosis and plasma tyrosine levels.
| Linear regression covariates | β coefficient | P value |
|---|---|---|
| Age, sex | 0.481 | 0.003 |
| Age, sex, BMI z score | 0.450 | 0.010 |
| Age, sex, BMI z score, HOMA-IR | 0.451 | 0.014 |
HOMA-IR is an index for insulin resistance and is calculated as fasting glucose (mg/dl) * insulin (mU/L)/405.
DISCUSSION
NAFLD is a multifaceted disease and known metabolic disturbances in NAFLD include upregulated de novo lipogenesis and elevated free fatty acids (18, 19). In our current analysis of the plasma metabolome in a group of obese, Hispanic-American adolescents, we found several amino acid metabolic pathways that were dysregulated with the presence of NAFLD. These findings are important because amino acid metabolism may serve as a novel target for the development of therapeutics for children with NAFLD.
Tyrosine metabolism was the most dysregulated pathway in adolescents with NAFLD. Previous work has provided evidence supporting the link of tyrosine metabolism with the risk for developing hyperglycemia (20), insulin resistance (21, 22), metabolic syndrome (23), and diabetes (24). Given that NAFLD is typically co-existent with insulin resistance and often co-occurs with metabolic syndrome and diabetes, it is not surprising that adolescents with NAFLD in our study exhibited dysregulation in tyrosine metabolism. In addition, we observed that plasma tyrosine levels were positively associated with the severity of steatosis in the liver, even after adjusting for age, sex, BMI z-score, and HOMA-IR. This finding is supported by a previous study analyzing frozen liver samples, which showed increased hepatic tyrosine levels in steatohepatitis when compared with simple steatosis alone (25). We expanded this observation to the pediatric population and furthered it by demonstrating an independent correlation between tyrosine levels and hepatic steatosis regardless of obesity and insulin resistance.
To date, the origins and mechanisms of tyrosine metabolism dysregulation in hepatic steatosis remain poorly elucidated. A possible explanation is that tyrosine can enter into the ketogenic pathway and be degraded directly to acetyl-CoA through ketogenesis. Therefore, high dietary tyrosine intake in the setting of calorie excess may further stimulate fatty acid synthesis and contribute to lipid deposition in the liver. It is also possible that alterations in gut microbiota, which has been seen in pediatric NAFLD (26, 27), can modulate the systemic metabolism of the host involving fatty acids and tyrosine metabolism (28) which in turn can contribute to the pathophysiology of hepatic steatosis. With the rapid expansion of “-omics”-based technology in the field of toxicology, it has been reported that derangements in tyrosine metabolism may be associated with overexposure to environmental contaminants (29, 30), such as pesticides and herbicides, that may modulate tyrosine metabolism and could potentially be involved in NAFLD pathogenesis (31).
Our data also revealed dysregulation of several other major amino acids associated with the presence of hepatic steatosis including tryptophan, branched-chain amino acids (BCAA), glycine, serine, alanine and threonine. Because liver is a critical organ for amino acid homeostasis, the imbalances could be a consequence of abnormal liver function. BCAA (leucine, isoleucine, valine) have been the most frequently investigated and observations from case control studies indicate higher BCAA levels in adults with NAFLD when compared with age- and sex-matched controls (25, 32); however, it remains unknown whether this elevation is confounded by insulin resistance. Even though elevated plasma BCAA and its dysregulated metabolism are evident during insulin resistance and type 2 diabetes (21, 24), the role of BCAA in the pathogenesis of NAFLD, particularly in children, remains unsolved. Evidence for altered tryptophan, glycine, serine, alanine, and threonine metabolism in NAFLD is very limited and an area of future exploration.
Skeletal muscle and adipose tissue are also important regulators of amino acid metabolism and could be a source of the altered metabolism observed in this analysis. The altered levels of circulating amino acids in NAFLD might be attributed to tissue-specific dysregulation of their metabolic activities (33). We only measured the plasma metabolome in this pilot study and future studies are needed to investigate tissue-specific amino acid metabolism in patients with hepatic steatosis and fibrosis.
Strengths of the study include the untargeted approach, the huge number of metabolites identified and the well matched groups. In addition, we recruited children who had not previously been identified to have NAFLD and thus they all were in an untreated disease state providing an accurate view of the pathophysiology. There were also several limitations. The sample size was relatively small and was unbalanced between groups. We accounted for this effect using regression models but a larger control group would be helpful in future studies. This study exclusively included the Hispanic-Americans because of their high risk for NAFLD thus the findings might not be generalized to other races. We chose to compare children with NAFLD with obese, individuals without NAFLD and the pathways found differentiated NAFLD from obese without NAFLD. A normal weight, metabolically healthy, control group could be included in a future study to establish the differences from normal.
In conclusion, this exploratory metabolomics analysis demonstrated that amino acid metabolism is dysregulated in adolescents with NAFLD compared with age-, BMI-, and ethnicity-matched adolescents without evidence of significant steatosis on imaging. The alterations in amino acid metabolism, in addition to the expected upregulation of lipid metabolic pathways, is a novel finding in pediatric NAFLD. These preliminary findings suggest research is needed to explore causal links between amino acid metabolism and the pathogenesis of NAFLD and highlight the need to consider these pathways in the development of therapeutic targets for NAFLD treatment in children.
Acknowledgments
Funded by the National Institutes of Health (NIH; K23 DK080953) and the National Center for Advancing Translational Sciences of the NIH (UL1TR000454). The content is solely the responsibility of the authors and does not necessarily represent the official views of the NIH.
Abbreviations
- BCAA
branched chain amino acid
- LC-MS
liquid chromatography with ultra-high resolution mass spectrometry
- MRS
magnetic resonance spectroscopy
- NAFLD
non-alcoholic fatty liver disease
Footnotes
Publisher's Disclaimer: This is a PDF file of an unedited manuscript that has been accepted for publication. As a service to our customers we are providing this early version of the manuscript. The manuscript will undergo copyediting, typesetting, and review of the resulting proof before it is published in its final citable form. Please note that during the production process errors may be discovered which could affect the content, and all legal disclaimers that apply to the journal pertain.
The authors declare no conflicts of interest.
References
- 1.Welsh JA, Karpen S, Vos MB. Increasing prevalence of nonalcoholic fatty liver disease among United States adolescents, 1988–1994 to 2007–2010. J Pediatr. 2013;162:496–500.e1. doi: 10.1016/j.jpeds.2012.08.043. [DOI] [PMC free article] [PubMed] [Google Scholar]
- 2.Loomba R, Sanyal AJ. The global NAFLD epidemic. Nat Rev Gastroenterol Hepatol. 2013;10:686–90. doi: 10.1038/nrgastro.2013.171. [DOI] [PubMed] [Google Scholar]
- 3.Schneider AL, Lazo M, Selvin E, Clark JM. Racial differences in nonalcoholic fatty liver disease in the U.S. population. Obesity (Silver Spring) 2014;22:292–9. doi: 10.1002/oby.20426. [DOI] [PMC free article] [PubMed] [Google Scholar]
- 4.Goran MI, Walker R, Allayee H. Genetic-related and carbohydrate-related factors affecting liver fat accumulation. Curr Opin Clin Nutr Metab Care. 2012;15:392–6. doi: 10.1097/MCO.0b013e3283544477. [DOI] [PMC free article] [PubMed] [Google Scholar]
- 5.Vos MB, Kimmons JE, Gillespie C, Welsh J, Blanck HM. Dietary fructose consumption among US children and adults: the Third National Health and Nutrition Examination Survey. Medscape J Med. 2008;10:160. [PMC free article] [PubMed] [Google Scholar]
- 6.Fitzpatrick AM, Park Y, Brown LA, Jones DP. Children with severe asthma have unique oxidative stress-associated metabolomic profiles. J Allergy Clin Immunol. 2014;133:258–61.e1–8. doi: 10.1016/j.jaci.2013.10.012. [DOI] [PMC free article] [PubMed] [Google Scholar]
- 7.Cribbs SK, Park Y, Guidot DM, Martin GS, Brown LA, Lennox J, et al. Metabolomics of bronchoalveolar lavage differentiate healthy HIV-1-infected subjects from controls. AIDS Res Hum Retroviruses. 2014;30:579–85. doi: 10.1089/aid.2013.0198. [DOI] [PMC free article] [PubMed] [Google Scholar]
- 8.Uppal K, Soltow QA, Strobel FH, Pittard WS, Gernert KM, Yu T, et al. xMSanalyzer: automated pipeline for improved feature detection and downstream analysis of large-scale, non-targeted metabolomics data. BMC Bioinformatics. 2013;14:15. doi: 10.1186/1471-2105-14-15. [DOI] [PMC free article] [PubMed] [Google Scholar]
- 9.Jones DP, Park Y, Ziegler TR. Nutritional metabolomics: progress in addressing complexity in diet and health. Annu Rev Nutr. 2012;32:183–202. doi: 10.1146/annurev-nutr-072610-145159. [DOI] [PMC free article] [PubMed] [Google Scholar]
- 10.Li S, Park Y, Duraisingham S, Strobel FH, Khan N, Soltow QA, et al. Predicting network activity from high throughput metabolomics. PLoS Comput Biol. 2013;9:e1003123. doi: 10.1371/journal.pcbi.1003123. [DOI] [PMC free article] [PubMed] [Google Scholar]
- 11.Jin R, Le NA, Cleeton R, Sun X, Cruz Munos J, Otvos J, et al. Amount of hepatic fat predicts cardiovascular risk independent of insulin resistance among Hispanic-American adolescents. Lipids Health Dis. 2015;14:39. doi: 10.1186/s12944-015-0038-x. [DOI] [PMC free article] [PubMed] [Google Scholar]
- 12.Ralli EP, Rubin SH, Rinzler S. THE LIVER LIPIDS IN NORMAL HUMAN LIVERS AND IN CASES OF CIRRHOSIS AND FATTY INFILTRATION OF THE LIVER. J Clin Invest. 1941;20:93–7. doi: 10.1172/JCI101200. [DOI] [PMC free article] [PubMed] [Google Scholar]
- 13.Lee MJ, Bagci P, Kong J, Vos MB, Sharma P, Kalb B, et al. Liver steatosis assessment: correlations among pathology, radiology, clinical data and automated image analysis software. Pathol Res Pract. 2013;209:371–9. doi: 10.1016/j.prp.2013.04.001. [DOI] [PubMed] [Google Scholar]
- 14.Pineda N, Sharma P, Xu Q, Hu X, Vos M, Martin DR. Measurement of hepatic lipid: high-speed T2-corrected multiecho acquisition at 1H MR spectroscopy–a rapid and accurate technique. Radiology. 2009;252:568–76. doi: 10.1148/radiol.2523082084. [DOI] [PubMed] [Google Scholar]
- 15.Soltow QA, Strobel FH, Mansfield KG, Wachtman L, Park Y, Jones DP. High-performance metabolic profiling with dual chromatography-Fourier-transform mass spectrometry (DC-FTMS) for study of the exposome. Metabolomics. 2013;9:132–43. doi: 10.1007/s11306-011-0332-1. [DOI] [PMC free article] [PubMed] [Google Scholar]
- 16.Yu T, Park Y, Johnson JM, Jones DP. apLCMS–adaptive processing of high-resolution LC/MS data. Bioinformatics. 2009;25:1930–6. doi: 10.1093/bioinformatics/btp291. [DOI] [PMC free article] [PubMed] [Google Scholar]
- 17.Benjamini Y, Hochberg Y. Controlling the False Discovery Rate: A Practical and Powerful Approach to Multiple Testing. Journal of the Royal Statistical Society Series B (Methodological) 1995;57:289–300. [Google Scholar]
- 18.Puri P, Wiest MM, Cheung O, Mirshahi F, Sargeant C, Min HK, et al. The plasma lipidomic signature of nonalcoholic steatohepatitis. Hepatology. 2009;50:1827–38. doi: 10.1002/hep.23229. [DOI] [PMC free article] [PubMed] [Google Scholar]
- 19.Lambert JE, Ramos-Roman MA, Browning JD, Parks EJ. Increased de novo lipogenesis is a distinct characteristic of individuals with nonalcoholic fatty liver disease. Gastroenterology. 2014;146:726–35. doi: 10.1053/j.gastro.2013.11.049. [DOI] [PMC free article] [PubMed] [Google Scholar]
- 20.Wurtz P, Tiainen M, Makinen VP, Kangas AJ, Soininen P, Saltevo J, et al. Circulating metabolite predictors of glycemia in middle-aged men and women. Diabetes Care. 2012;35:1749–56. doi: 10.2337/dc11-1838. [DOI] [PMC free article] [PubMed] [Google Scholar]
- 21.Wurtz P, Soininen P, Kangas AJ, Ronnemaa T, Lehtimaki T, Kahonen M, et al. Branched-chain and aromatic amino acids are predictors of insulin resistance in young adults. Diabetes Care. 2013;36:648–55. doi: 10.2337/dc12-0895. [DOI] [PMC free article] [PubMed] [Google Scholar]
- 22.Wurtz P, Makinen VP, Soininen P, Kangas AJ, Tukiainen T, Kettunen J, et al. Metabolic signatures of insulin resistance in 7,098 young adults. Diabetes. 2012;61:1372–80. doi: 10.2337/db11-1355. [DOI] [PMC free article] [PubMed] [Google Scholar]
- 23.Wiklund PK, Pekkala S, Autio R, Munukka E, Xu L, Saltevo J, et al. Serum metabolic profiles in overweight and obese women with and without metabolic syndrome. Diabetol Metab Syndr. 2014;6:40. doi: 10.1186/1758-5996-6-40. [DOI] [PMC free article] [PubMed] [Google Scholar]
- 24.Wang TJ, Larson MG, Vasan RS, Cheng S, Rhee EP, McCabe E, et al. Metabolite profiles and the risk of developing diabetes. Nat Med. 2011;17:448–53. doi: 10.1038/nm.2307. [DOI] [PMC free article] [PubMed] [Google Scholar]
- 25.Lake AD, Novak P, Shipkova P, Aranibar N, Robertson DG, Reily MD, et al. Branched chain amino acid metabolism profiles in progressive human nonalcoholic fatty liver disease. Amino Acids. 2015;47:603–15. doi: 10.1007/s00726-014-1894-9. [DOI] [PMC free article] [PubMed] [Google Scholar]
- 26.Michail S, Lin M, Frey MR, Fanter R, Paliy O, Hilbush B, et al. Altered gut microbial energy and metabolism in children with non-alcoholic fatty liver disease. FEMS Microbiol Ecol. 2015;91:1–9. doi: 10.1093/femsec/fiu002. [DOI] [PMC free article] [PubMed] [Google Scholar]
- 27.Vos MB. Nutrition, nonalcoholic fatty liver disease and the microbiome: recent progress in the field. Curr Opin Lipidol. 2014;25:61–6. doi: 10.1097/MOL.0000000000000043. [DOI] [PMC free article] [PubMed] [Google Scholar]
- 28.Zheng X, Xie G, Zhao A, Zhao L, Yao C, Chiu NH, et al. The footprints of gut microbial-mammalian co-metabolism. J Proteome Res. 2011;10:5512–22. doi: 10.1021/pr2007945. [DOI] [PubMed] [Google Scholar]
- 29.Lin Z, Roede JR, He C, Jones DP, Filipov NM. Short-term oral atrazine exposure alters the plasma metabolome of male C57BL/6 mice and disrupts alpha-linolenate, tryptophan, tyrosine and other major metabolic pathways. Toxicology. 2014;326:130–41. doi: 10.1016/j.tox.2014.11.001. [DOI] [PubMed] [Google Scholar]
- 30.Wei DD, Wang JS, Wang PR, Li MH, Yang MH, Kong LY. Toxic effects of chronic low-dose exposure of thioacetamide on rats based on NMR metabolic profiling. J Pharm Biomed Anal. 2014;98:334–8. doi: 10.1016/j.jpba.2014.05.035. [DOI] [PubMed] [Google Scholar]
- 31.Arciello M, Gori M, Maggio R, Barbaro B, Tarocchi M, Galli A, et al. Environmental pollution: a tangible risk for NAFLD pathogenesis. Int J Mol Sci. 2013;14:22052–66. doi: 10.3390/ijms141122052. [DOI] [PMC free article] [PubMed] [Google Scholar]
- 32.Kalhan SC, Guo L, Edmison J, Dasarathy S, McCullough AJ, Hanson RW, et al. Plasma metabolomic profile in nonalcoholic fatty liver disease. Metabolism: clinical and experimental. 2011;60:404–13. doi: 10.1016/j.metabol.2010.03.006. [DOI] [PMC free article] [PubMed] [Google Scholar]
- 33.Cheng S, Wiklund P, Autio R, Borra R, Ojanen X, Xu L, et al. Adipose Tissue Dysfunction and Altered Systemic Amino Acid Metabolism Are Associated with Non-Alcoholic Fatty Liver Disease. PLoS One. 2015;10:e0138889. doi: 10.1371/journal.pone.0138889. [DOI] [PMC free article] [PubMed] [Google Scholar]