Abstract
We study mixing in Stokesian vesicle suspensions in two dimensions on a cylindrical Couette apparatus using numerical simulations. The vesicle flow simulation is done using a boundary integral method, and the advection-diffusion equation for the mixing of the solute is solved using a pseudo-spectral scheme. We study the effect of the area fraction, the viscosity contrast between the inside (the vesicles) and the outside (the bulk) fluid, the initial condition of the solute, and the mixing metric. We compare mixing in the suspension with mixing in the Couette apparatus without vesicles. On the one hand, the presence of vesicles in most cases slightly suppresses mixing. This is because the solute can be only diffused across the vesicle interface and not advected. On the other hand, there exist spatial distributions of the solute for which the unperturbed Couette flow completely fails to mix whereas the presence of vesicles enables mixing. We derive a simple condition that relates the velocity and solute and can be used to characterize the cases in which the presence of vesicles promotes mixing.
I. INTRODUCTION
Vesicles are closed phospholipid membranes suspended in a viscous solution. They are found in biological systems and play an important role in intracellular and intercellular transport. Artificial vesicles are used in a variety of drug-delivery systems and in the study of biomembrane mechanics. Vesicle-inspired mechanical models can be used to approximate red blood cell mechanics and non-local hydrodynamic interactions. Most vesicle suspension flows take place in vanishing Reynolds number regime. Although there has been a lot of work in characterizing the dynamics of vesicles, there has been very little work in characterizing mixing in vesicle flows.
A. Contributions
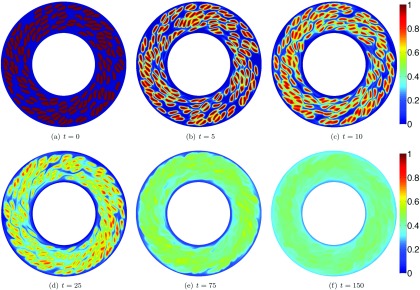
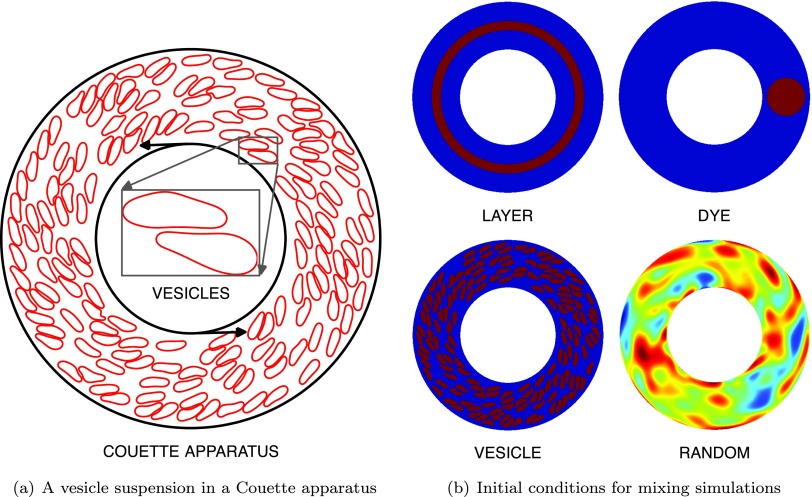
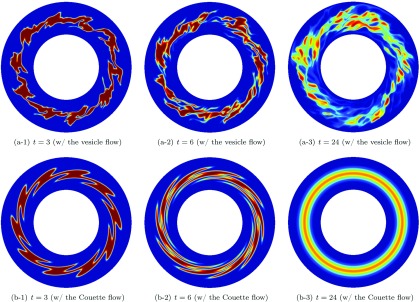
To the best of our knowledge, this is one of the first papers studying the effects of vesicle suspensions on mixing. We consider a simple setup: a two-dimensional cylindrical Couette apparatus in the zero Reynolds number regime. The size of the vesicles is comparable to the size of the apparatus, so we study systems for which it is not clear how to use an upscaled model since there is no separation of scales (see Figure 1, for an example). We only consider no-slip boundary conditions where the inner cylinder rotates at a fixed rate and the outer cylinder is stationary. We study the system numerically with an integro-differential equation formulation for the fluid dynamics and a pseudo-spectral scheme for a passive advection-diffusion equation. We compare the mixing in the absence and the presence of vesicles. There is no unique way to define mixing but our results are based mostly on negative Sobolev norms of the concentration. We study the effects of the Peclet number, the area fraction, and the viscosity contrast between the fluids inside and outside of the vesicles. We also study several different initial conditions for the passively transported quantity (“the solute”). The membranes of the vesicles in our model are assumed to be impermeable for the background fluid (“the solvent”) and permeable for the solute. Since, in the model, Lagrangian trajectories do not cross the vesicle membrane, this has the effect of reducing advective mixing. Overall, we find that for the same average Peclet number, the presence of vesicles slightly reduces mixing. Interestingly, however, this is not always the case. There exist certain rather special initial conditions for the passively transported quantity that this is not the case. For these conditions in the absence of vesicles there is no advective mixing while the presence of vesicles increases mixing. One such initial condition is the “LAYER” initial condition in Figure 2(b).
FIG. 1.
Here we show an example of a simulation of mixing in a suspension of vesicles. The suspension has a 40% area fraction of vesicles and no viscosity contrast. The initial condition for the solute is one inside the vesicles and zero outside the vesicles. This advection-dominated transport problem has . In this simulation, we use 256 and 1024 discretization points in the radial and the azimuthal directions, respectively. In the simulation of the vesicle suspension, we discretize a vesicle with N = 96 points and a wall with points. The time horizon (Th = 150) corresponds to 24 revolutions of the inner cylinder in the Couette apparatus. We take a total of 3750 time steps in our mixing simulation. All numerical simulations were performed using an in-house MATLAB code.
FIG. 2.
The geometry used in this work is a cylindrical Couette apparatus. It consists of two concentric cylinders, where the inner cylinder is rotating and the outer cylinder is stationary. We also show the vesicle suspension. First we perform a vesicle-flow numerical simulation to compute the velocity field of the suspension. This step is independent of the advection-diffusion equation since the transported quantity is passive. Once the velocity field is computed, we solve the transport problem for a number of different initial conditions depicted in (b). Red corresponds to high concentration (maximum value is 1) and blue corresponds to low concentration (minimum value is 0).
B. Limitations
The main limitation is that we only consider a specific two-dimensional flow. So, generalizations to other type of flows are not immediate. Also, we consider several metrics for mixing, but other metrics can be considered. Although we use a constant diffusion coefficient for the solute in the passive advection-diffusion model, the diffusion coefficient can depend on whether the diffusion is considered in the fluid bulk, the fluid enclosed by the vesicle, or the vesicle membrane. We also assume that the vesicle membrane is impermeable to the suspending fluid. Additionally, we investigate the effects of only the area fraction, the viscosity contrast, and the Peclet number on mixing.
C. Related work
Mixing has been studied extensively as it is important in many scientific and industrial settings. Classical works in mixing3,24 consider large scale systems such as combustion in engines and pollution in seas. Mixing is of fundamental importance to many biological systems. The survival of many microorganisms requires the transport of substances such as nutrients, but these substances have slow rates of diffusion. The enhancement of mixing by mechanical stirring mechanisms such as micro-swimmers has been investigated both experimentally19,22 and numerically.27,48 We are interested in mixing in microfluidic settings in which the flow complexity is driven by moving boundaries or suspensions of deformable particles.
Mixing in flows with moving and deformable boundaries has been studied.6,17,35 However, none of these works discuss mixing of vesicle suspensions. Of course, there are many studies on the rheology of vesicle flows such as tank-treading and tumbling motions.15,20,23,31,34 Vesicles also model red blood cells and are used to study microcirculation.37 Therefore, mixing in vesicles can be related to mixing in capillaries and arterioles. Regarding the numerical method for vesicles, we use our in-house algorithms for vesicle simulations,39,40,41,49 and we refer the reader to Refs. 39 and 40 for a review of the related work on the two-dimensional vesicle simulations.
Another important aspect in our work is the quantification of mixing. Although there is extensive work on metrics for mixing, there is not a universal measure.14,21,26,29,36 We review some of the metrics specifically for advection. Metrics derived from dynamical systems consider the locations of tracer particles after a single period of a periodic flow. One example is the Poincaré section4 which examines the position of particles after multiple periods of the flow. If the separation between neighboring particles increases exponentially with each period, then we say that the flow is chaotic, and the exponent, which is called the stretching rate or Lyapunov exponent, quantifies the mixing. In particular, larger Lyapunov exponents correspond to better mixing, and this approach is used in Ref. 32. Mixing can also be measured statistically. One measure is the mixing variance metric. Another measure is the Kolmogorov-Sinai entropy that computes an integral of Lyapunov exponents over a domain.10 Another set of metrics is based on tracking the interface between the solute and the solvent. When an effective mixing takes place, this interface grows rapidly. The exponential rate of the growth is called the interface stretch30 and measures global stretching unlike Lyapunov exponents.1,2
The aforementioned metrics are appropriate to measure mixing for advection dominated flows. However, the introduction of diffusion further enhances mixing. We refer the reader to Ref. 13 for a more detailed discussion on the different metrics for different Peclet numbers and initial conditions. When quantifying mixing due to diffusion, metrics that are based on the solute are more informative. For example, the Euclidean (L2) norm and the maximum norm ()5,43 can be used. However, Lp norms do not decay in the absence of diffusion, and therefore cannot quantify mixing due to advection. Thus, there is a need for a metric that captures mixing due to both diffusion and advection. One metric that captures mixing due to diffusion and advection is the negative index H−1 Sobolev norm,28,29 which we will refer to as the “mix norm.” Additionally,11,18 compare the H−1 norm with Lp norms. In addition to being able to capture mixing due to advection and diffusion, the H−1 norm depends on the initial concentration field.
Since all the numerical methods we adopt often appear in the literature, we only briefly describe our numerical scheme. We use a Fourier-Chebyshev collocation7,47 method to discretize the equation in space. We use a Strang operator splitting time-stepping scheme,44 which we combine with a semi-Lagrangian method for the advection.42,52
D. Methodology
We consider the advective and the diffusive mixing of a passive scalar in a Couette apparatus (see Figure 2(a)) that has a rotating the inner cylinder and a stationary outer cylinder. The relevant dimensionless number of the transport problem is the ratio of the advective transport rate and the diffusive transport rate, or the Peclet number Pe,45
| (1.1) |
where is the time average of the L2 norm of the velocity field v, i.e., and measures the kinetic energy, Lc is the characteristic length scale (the diameter of the apparatus), and D is the diffusivity of the transported quantity. As an example, we discuss transport in microcirculation. The diameters of a capillary and an arteriole are and the mean velocities of blood flow in them are and , respectively.16,37,51 The diffusivities of oxygen and an iron-oxide nanoparticle are 51 and ,33 respectively. Therefore, the Peclet number for the transfer of oxygen or nanoparticles ranges from 10 to 104.
Vesicle suspensions have several parameters such as the distribution of sizes of the vesicles, the reduced volume, the bending resistance, the “volume” fraction (in 2D the ratio between the area occupied by the vesicles and the total area of the apparatus; we call it area fraction throughout the paper), and the viscosity contrast between the fluid inside the vesicle and the bulk fluid. All these parameters could affect mixing. Here, however, we consider only two main vesicle parameters: the area fraction and the viscosity contrast. Of course, another parameter is the imposed external velocity field. In our case it is the velocity generated by the rotating inner cylinder in the Couette apparatus, and we parameterize it by the Peclet number. Again, taking an example from microcirculation, the volume fraction of red blood cells in human blood is typically around 45% and their viscosity contrast with plasma ranges from 5 to 10.16
Our numerical simulations require two steps. First, we simulate the vesicle motion for various values of area fraction and viscosity contrast and then compute the velocity field on a Fourier-Chebyshev grid. Second, using this velocity field, we simulate mixing in the Couette apparatus for the initial conditions in Figure 2(b) and denote the corresponding concentration of the solute with ϕ. We remark that numerical algorithms for the calculation of the velocity and ϕ are very different. The suspension dynamics are computed using a boundary integral equation method while the advection-diffusion equation is solved using a pseudospectral method. We also simulate mixing of the same initial concentration in the apparatus with the same Peclet number but without any vesicles, and we denote this concentration by . Using , we define a mixing efficiency η as
| (1.2) |
which compares the mixing efficiency of the Couette apparatus with vesicles to that without vesicles (the default Couette flow). If η is greater than one, the vesicle flow mixes better. When computing the Peclet number (1.1), we use the spatio-temporal average of the velocity field to quantify the advective transport rate. Since the velocity field v depends on the area fraction and the viscosity contrast, it changes with the area fraction and viscosity contrast of the suspension. Thus, we adjust the diffusivity D to keep the Peclet number the same in computing and ϕ. In this manner, we investigate the effects of the area fraction and the viscosity contrast on the mixing efficiency. Additionally, we look at these effects under various Peclet numbers for the initial conditions in Figure 2(b).
E. Organization of the paper
In Sec. II we briefly summarize the formulation for the numerical simulation of vesicle flows. We, then, present the temporal and the spatial discretization methods for the advection-diffusion equation in Sec. III. After we define the mixing metrics in Sec. IV, we show the results of the numerical experiments and discuss the effects of the area fraction, the viscosity contrast, and the initial condition of the transported quantity on the mixing efficiency in Sec. V.
II. SIMULATION OF A VESICLE SUSPENSION
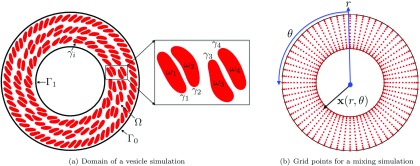
In this section, we briefly summarize the numerical scheme for the vesicle dynamics. We refer the reader to Refs. 38–40 for further details. The fluid domain is denoted by Ω, the boundary of the ith vesicle by , and the interior of the ith vesicle by . We also write and . The vesicle boundaries are parameterized as xi (s,t), where s is the arc length and t is time. This notation is also described in Figure 3.
FIG. 3.
We illustrate the domain of a vesicle simulation in (a). The interior and boundary of the ith vesicle are denoted by and , respectively. The vesicle suspension formulation is described in Sec. II. (b) shows the polar coordinate Fourier-Chebyshev grid where we discretize the transport equation. The transport equations are described in Sec. III.
In Stokesian fluids, the inertial forces are negligible compared to the viscous forces resulting in a small Reynolds number (Re). In the limit of , the momentum and continuity equations are
| (2.1) |
where μ is the fluid viscosity, v is the fluid velocity, and p is the pressure. We assume that the viscosities of the exterior and interior fluids are constant. The no-slip boundary condition on the interface of vesicles implies that
| (2.2) |
In addition, we impose a no-slip velocity boundary condition on the inner and outer boundaries of the Couette apparatus. Next, we assume that the surface of the vesicles is locally inextensible. This constraint is to the divergence of the velocity on γ vanishing,
| (2.3) |
Another governing equation comes from the balance of momentum on the interface of the vesicles. It enforces the jump in the surface traction to be equal to the net force applied by the interface onto the fluid,
| (2.4) |
where is the Cauchy stress tensor, n is the outward normal vector of , is the jump across the interface, and f is the net force applied by the interface onto the fluid. The net force f is the nonlinear function of xi (s,t),
| (2.5) |
The first term on the right hand side is the force due to bending rigidity and the second term is the force due to the tension σ on the interface. We assume that there is no other force such as the gravitational force on the interface. Additionally, a scaling analysis41 shows that the bending rigidity sets the time scale and the tension σ can be interpreted as a Lagrange multiplier enforcing the local inextensibility constraint.49 Therefore, and σ do not affect mixing and are not considered here. Finally, the position of the boundaries of M vesicles evolves as
| (2.6) |
where is the background velocity and vj (xi) is the velocity due to the jth vesicle acting on the ith vesicle.
The complete set of nonlinear Equations (2.1)–(2.6) governs the evolution of the vesicle interfaces. We use an integral equation method since it can naturally handle the moving geometry, achieve high-order accuracy, and resolve the viscosity contrast. The tension and traction jump in (2.5) for a given xi (s,t) are computed spectrally with Fourier differentiation. Finally, the boundary conditions (2.2) and (2.3) result in a coupled system of equations with integral, differential, and algebraic components that can be solved by applying a time stepping method such as fully explicit,53 block semi-implicit,41 semi-implicit,39 or spectral deferred correction.40 Because of the high-order derivatives in (2.5), we use a semi-implicit method to address stiffness. Once the positions and tensions of the vesicles are obtained, the integral equation formulation allows us to compute the velocity v at any point in the domain as a postprocessing step. Then, this velocity field is used in our advection-diffusion solver.
III. ADVECTION-DIFFUSION EQUATION
The advection-diffusion equation governs mixing of a passive scalar. Its nondimensional form with Neumann boundary conditions is
| (3.1a) |
| (3.1b) |
where, ϕ is the concentration, v is the velocity, t is time, Ω is the Couette geometry in Figure 2(a), and Γ is the boundary of Ω. We now present the numerical scheme we have adopted to solve (3.1).
A. Temporal discretization
The Strang splitting method expresses the solution operator in (3.1a) in terms of the advection () and the diffusion () operators,
| (3.2a) |
| (3.2b) |
where and . Given some initial concentration field, the Strang splitting updates the concentration in three steps: first it solves the advection equation (3.2a) in [tn,t(n+1)/2], second the diffusion equation (3.2b) in [tn,tn+1], and third the advection equation (3.2a) in [t(n+1)/2,tn+1]. This splitting is second-order accurate, but the methods used to solve each subproblem also determine the accuracy of the complete scheme. In this study, we solve the advection problem (3.2a) and the diffusion problem (3.2b) with a semi-Lagrangian method and a Crank-Nicolson method, respectively. This decoupling results in an unconditionally stable scheme.8
1. Semi-Lagrangian method for advection
The advection equation (3.2a) in Lagrangian form is
which means that ϕ is constant along the characteristic path x(t) which satisfies
| (3.3) |
In the semi-Lagrangian method, first we solve (3.3) backward in time to find the Lagrangian point or “departure point” xd that arrives at a point xa that coincides with the discretization points used for the diffusion solve (see Figure 3(b)). This trajectory is computed with the second-order explicit midpoint rule
| (3.4a) |
| (3.4b) |
where is the time step size for the advection problem (usually where is the time step size for the diffusion problem). Since we have integrated along the characteristic, the concentration at xa satisfies . In general, the departure points xd do not coincide with the grid points, thus we interpolate the concentration at xd using cubic interpolation with . Additionally, we also interpolate the velocity at the mid-point xm in (3.4b) using the same method. This particular semi-Lagrangian scheme is second-order accurate in time.12,52
2. Crank-Nicolson for diffusion
We use a Crank-Nicolson scheme to discretize the diffusion equation (3.2b) in time
| (3.5) |
Since (3.5) is not L-stable, high frequency components of ϕ can lead to spurious numerical oscillations.9 Since we choose discrete initial conditions (see Figure 2(b)), high frequencies components will be present.25 Therefore, we require a method that behaves as a numerical low-pass filter so that high frequencies are suppressed. We apply the L-stable backward Euler method initially to smooth the initial condition.50,54 Since backward Euler is only first-order accurate, it is only applied for with a time step size . Then, to achieve second-order accuracy, Crank-Nicholson is used for .
B. Spatial discretization
Taking the advantage of symmetries in the geometry, we use polar coordinates (see Figure 3(b)) and a pseudo-spectral representation of ϕ. Since ϕ is periodic in θ, we use a Fourier series in θ,
| (3.6) |
Then, we discretize the Fourier coefficients in r using Chebyshev polynomials as
where is the number of uniformly distributed collocation points in and Nr is the number of collocation points in r. Additionally, ∈ and we define the radial coordinate as , where the radii of the inner and the outer cylinders are r1 and r2, respectively. The resulting grid points are illustrated in Figure 3(b).
After substituting (3.6) into (3.5) and applying the Laplacian Δ, the resulting diagonal set of linear equations is
| (3.7) |
where the operators are
and I is the identity matrix. Equation (3.7) is efficiently solved using the fast cosine transform.
We have tested our numerical scheme on different initial conditions and velocity fields. For smooth velocity fields and initial conditions, the method is second-order accurate in time and spectrally accurate in space. We have also tested our solver on velocity fields that are not continuous, such as those for vesicle suspensions, and we achieve similar convergence rates for smooth initial conditions.
IV. METRICS OF MIXING
To measure mixing in advection-dominated transport, some of the early work18,29 suggests that the H−1 norm is appropriate and discusses the disadvantages of Lp norms. In this section, we define and compare the L1, L2, and H−1 norms on an example problem.
The Lp norm of the concentration ϕ is
We only use p = 1,2. The H−1 norm of a concentration field ϕ is a negative Sobolev norm and is defined as
where g is the solution of the boundary value problem
| (4.1) |
where I is the identity operator and Δ is the Laplacian. We solve (4.1) using the Fourier-Chebyshev collocation scheme described in Sec. III B. In L2 and H−1, smaller norms of ϕ correspond to a more mixed concentration field.
Remark: By integrating (3.1a) over Ω, integrating by parts, and applying the Neumann boundary condition (3.1b) and the incompressibility constraint, we have
Here we have used the fact that the concentration field is positive. Since the completely mixed state corresponds to a uniform concentration , we have
for all time. Therefore the L1 norm is not an appropriate norm to measure mixing. The L2 norm measures fluctuations from the mean . It has been shown that the L2 norm of the concentration monotonically approaches zero in the absence of sources since18
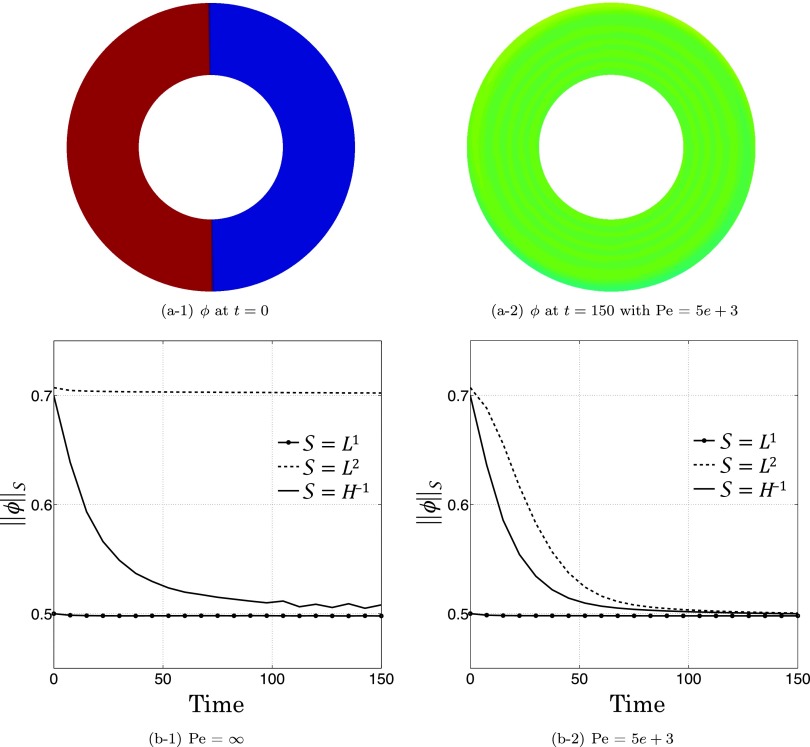
Therefore, if the diffusion coefficient is non-zero, or , and the concentration field is not uniform, then the L2 norm of the concentration field decreases with time. We demonstrate these properties of the L1 and L2 norm in Figure 4. The initial condition is depicted in Figure 4(a-1) and we consider a simple Couette flow without any vesicles. The number of collocation points is Nr = 128 and . The rest of the parameters are in Table I. First, Figure 4(b-1) shows that neither the L1 norm nor the L2 is able to capture mixing due to pure advection (i.e., Pe ), while the H−1 norm decays as the concentration is mixed. Second, Figure 4(b-2) demonstrates that in the presence of diffusion, the L1 norm is still independent of time, but the L2 and H−1 norms decrease with mixing. Additionally, in the presence of diffusion, since the concentration becomes uniform, the three norms approach the same value.
FIG. 4.
We illustrate the differences between L1, L2, and H−1 norms when applied as mixing metrics of a concentration field. The advection velocity is a simple cylindrical Couette flow without vesicles. We consider two Peclet numbers and . Mixing measures are usually normalized by their initial values in the literature, but we do not normalize here so that we can demonstrate that the three norms converge to the same value as . We measure the degree of mixing by L1, L2, and H−1 norms for both Peclet numbers in (b-1) and (b-2). (b–1) shows that the L1 and L2 norms do not decay without diffusion, even though mixing is taking place by advection. Additionally, we observe in (b–2) that as the concentration becomes uniform over the domain (i.e., ), the L2 and the H−1 norms approach one another and ultimately converge to the constant L1 norm.
TABLE I.
Physical parameters for mixing simulations.
| Notation | Units | Value | |
|---|---|---|---|
| Angular velocity of the inner cylinder | ω | Rad/unit time | 1 |
| Radius of inner cylinder | r1 | Unit length | 10 |
| Radius of outer cylinder | r2 | Unit length | 20 |
| Unit length | μm | 3 |
In advection-dominated flows, in which the diffusivity constant D is small, the concentration gradient can become large enough that the L2 norm will decay.18 However, if D is sufficiently small, this will not provide a meaningful quantification for mixing. In contrast, the H−1 norm captures mixing due to both advection and diffusion which results in a more accurate method for measuring mixing for a large range of Peclet numbers. Since we are interested in advection-dominated transport, the H−1 norm is preferable to the L2 norm to quantify mixing and to define the mixing efficiency (1.2). If the efficiency , then and thus the presence of vesicles promotes mixing. Similarly, if , then the presence of vesicles suppresses mixing.
V. NUMERICAL EXPERIMENTS
In this section, we discuss the effects of the presence of vesicles on mixing. We investigate the dependence of the mixing efficiency on the area fraction (AF) and the viscosity contrast (VC). The area fraction of a vesicle suspension is the ratio of the area occupied by the vesicles to the area of the fluid bulk. The viscosity contrast is the ratio of viscosities of the interior and the exterior fluids. Additionally, we run tests on the different initial conditions in Figure 2(b). Let us summarize the experiments we perform.
-
•
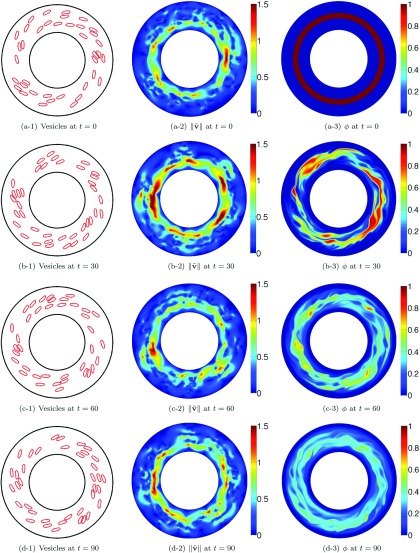
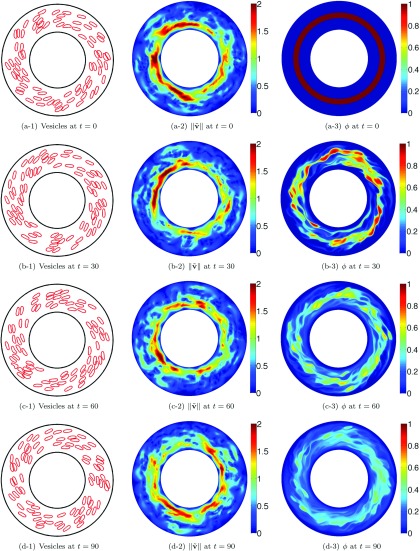
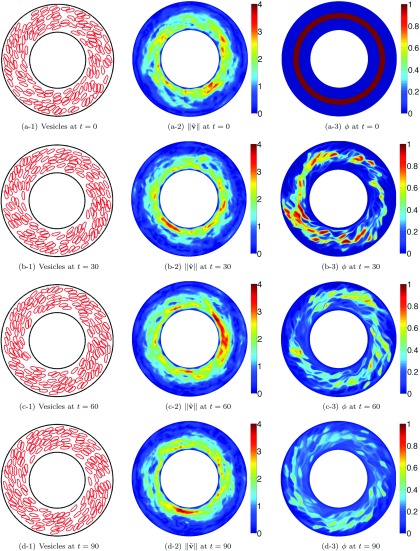
Effects of area fraction (Figures 7–9): Here we aim to understand whether the presence of more vesicles in a suspension promotes or suppresses mixing. For this purpose, we simulate mixing in vesicle suspensions with area fractions 10%, 20%, and 40%, and with the layer initial condition and Pe = 1e + 104. We visualize several times the snapshots of the concentration field, the vesicle positions, and the velocity field (in fact, we visualize its difference from the pure Couette flow). The results indicate, for this setup, that increasing the area fraction promotes mixing.
-
•
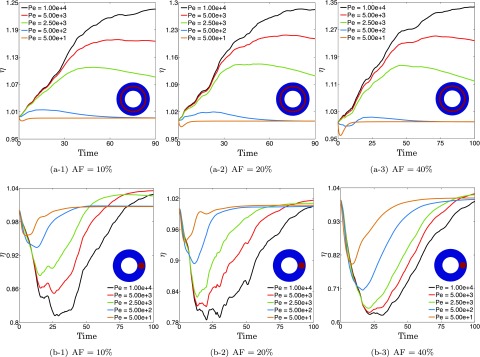
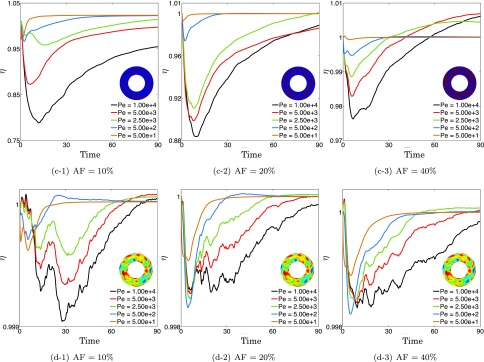
Effects of Peclet number and initial condition (Figures 10 and 11): We simulate mixing in the vesicle suspensions with three area fractions of 10%, 20%, and 40% with various Peclet numbers and initial conditions (Figure 2(b)). In order to quantify the effect of the Peclet number and initial condition, we plot the mixing efficiency η with respect to time. The results show that the presence of vesicles manifests its effects on mixing at very high Peclet numbers. However, depending on the initial condition, the vesicles promote (layer initial condition), suppress (dye initial condition), and do not affect (random initial condition) mixing.
-
•
Effects of viscosity contrast (Figure 14): We consider vesicle suspensions with area fractions 5% and 10% and various viscosity contrasts. We perform the viscosity contrast tests on the layer and dye initial conditions. At higher viscosity contrasts, the vesicles undergo the more complex tumbling dynamic when compared to the tank-treading dynamic at lower viscosity contrasts. The result is more complicated stirring which increases the mixing efficiency. However, the viscosity contrast has less of an effect on the efficiency when compared to the area fraction.
FIG. 7.
The effects of a 10% area fraction on the velocity field and mixing (Sec. V B). Here we present the vesicle positions (left), the magnitude of the velocity field due only to the vesicles (middle), and the concentration ϕ (right) for the area fraction of 10% and the layer initial condition. Each row corresponds to a different time.
FIG. 8.
The effects of a 20% area fraction on the velocity field and mixing (Sec. V B). Here we present the vesicle positions (left), the magnitude of the velocity field due only to the vesicles (middle), and the concentration ϕ (right) for the area fraction of 20% and the layer initial condition. Each row corresponds to a different time.
FIG. 9.
The effects of a 40% area fraction on the velocity field and mixing (Sec. V B). Here we present the vesicle positions (left), the magnitude of the velocity field due only to the vesicles (middle), and the concentration ϕ (right) for the area fraction of 40% and the layer initial condition. Each row corresponds to a different time.
FIG. 10.
The effects of the area fraction on the degree of mixing for various Peclet numbers and initial conditions (Sec. V C). The first row demonstrates that the mixing efficiency η increases with increasing area fraction of the vesicles for the layer initial condition. The second row shows that η decreases when the initial condition is switched to the dye.
FIG. 11.
The effects of the area fraction on the degree of mixing for various Peclet numbers and the initial conditions (Sec. V C). The first row shows the mixing efficiency η with respect to time for the vesicle initial conditions for each area fractions and the second row is for the random initial condition. The results illustrate that there is no clear effect of the presence mixing if the random initial condition is used.
FIG. 14.
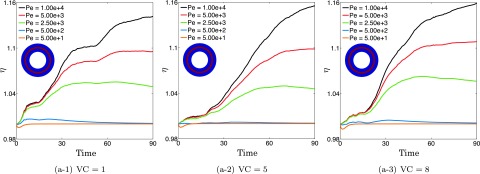
The effects of the viscosity contrast on mixing. We use the layer initial condition and the area fraction of 5%. The results show that the viscosity contrast has less of an effect on the mixing efficiency than the area fraction. We do observe an increase in the maximum mixing efficiency η as the viscosity contrasts increases from 1 to 8 (see (a-1) and (a-3)), and this might stem from the fact that vesicles start to tumble for VC (see Ref. 20).
We consider vesicles of reduced area 0.65. The inner boundary rotates at a constant angular velocity while the outer boundary is fixed. The inner boundary of the simulations with area fractions of 5% and 40% completes 32 rotations, while it completes 21 rotations in all other simulations. In all the runs, the vesicles are discretized with 64 points, and in all but one run, the outer walls are discretized with 128 points. For the simulation with 40% area fraction, the outer boundary is discretized with 256 points. Additionally, the error is controlled with an adaptive time integration scheme.40
We list the physical parameters and values of the mixing simulation in Table I. We discretize the transport equation with Nr = 256 collocation points in the radial direction and with collocation points in the azimuthal direction.Crank-Nicholson is used to solve the diffusion equation (3.5) with the time step size and a semi-Lagrangian method is used to solve the advection equation (3.4) with the time step size . Here, a unit time corresponds to 1.5 ms and a single rotation of the inner boundary requires time units.
For physically meaningful experiments, it is necessary that the dynamic system of a vesicle suspension is statistically stationary. To address this issue, let us discuss how we detect the statistical stationarity in this study.
A. Statistical analysis
As we mentioned earlier, the velocity from the vesicle simulations are used to drive the advective part of mixing. Here we describe the procedure we use to ensure that the velocity is not polluted by effects of the initial position and shape of the vesicles. In all experiments we assume that the vesicle suspensions eventually become statistically stationary. That is, we assume that all artifacts of the initial condition vanish when the system reaches this statistical equilibrium, and we use statistics of the velocity field to determine the onset of this statistical equilibrium. We start the mixing simulation once these statistics, which we will define shortly, become time independent.
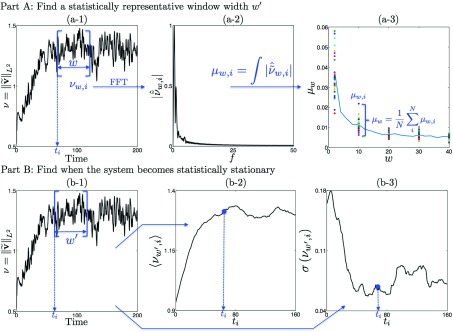
The presence of vesicles perturbs the velocity field of the default Couette flow. We define the perturbation as , where v is the velocity field of the vesicle suspension and v0 is the velocity field in the absence of vesicles. We monitor stationarity of the time series of . A stationary time series has statistical properties that do not change over time, i.e., its mean and variance over any statistically representative window are unchanging. Our statistical analysis involves, first, determining the statistically representative window size of the time series and, second, finding the time when the statistical equilibrium is first reached.
Given a time series, the window size is chosen so that any sample of this window size has the same mean and variance, independent of the location of the window. For example, suppose we are monitoring . Then, is chosen with the following numerical decision scheme:
-
•
We obtain a number of samples of a window width w from the time series starting at randomly chosen times where Th is the time horizon. We denote these samples with .
-
•
We compute the Fourier transform of the oscillations of the mean , where denotes the mean value . We then sum the Fourier coefficients to form which represents a property (in this case, the energy) of the particular window.
-
•
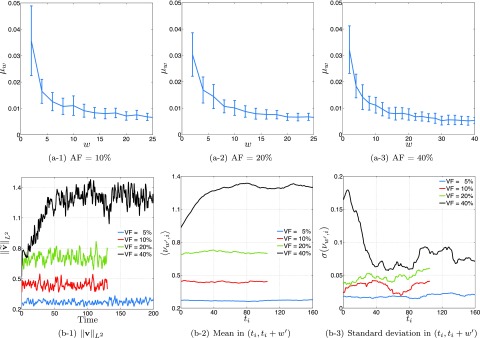
As the window size increases, the ensemble average converges to the mean of the entire time series, and the standard deviation, , decreases, where M is the number of samples. In Figure 5, we plot the mean and the standard deviation of the ensemble as a function of the window size w in the top row. The statistically representative window size W is the one which delivers a small standard deviation and a converged mean.
We plot the means of the samples as a function of window size w for the suspensions at AF = 10%, 20%, 40% in the top row of Figure 6. We choose the window size =25 time units for the suspensions at AF=10% and 20%, and =40 time units for those at AF=5% and 40%. Although we do not show the results for the vesicle suspensions with VC=5 and VC=8, we have repeated this analysis for them. Alternatively, a similar decision scheme is frequently used to find a statistically representative volume element of a random microstructure (see Ref. 46 for details). Here, the samples are ideally independent and identically distributed. However, we cannot choose such samples since the time series we have is too short. The samples are supposed to be independent and identically distributed. However, we cannot choose such samples since the time series we have is too short.
FIG. 5.
We outline the procedures to find the statistically representative window width w′ and to detect the statistical equilibrium for the vesicle suspension of AF = 40%, in the first and second rows, respectively.
FIG. 6.
We consider the L2 norm of the perturbations (see (b-1)) to examine the statistical properties of the vesicle suspensions. The dynamics become weakly stationary when the mean and the standard deviation of its statistical properties become time independent. Therefore, we compute the mean and the standard deviation of in the window (ti,ti + w′), for all i (see (b-2) and (b-3)). It is necessary that the width is statistically representative. Therefore, we look at the energy of randomly chosen samples from of various window widths w for each area fraction in the top row.
Once the representative window size w′ of the time series is chosen, we need to determine when the statistical equilibrium is first reached. To do so, we choose samples of size at every discrete time and compute their means and standard deviations . We determine the time when the statistical equilibrium is attained by examining when the mean and standard deviation plateau. In particular, we require that to be less than some tolerance. We summarize this procedure in the bottom row of Figure 5, and the results for the different area fractions are in the bottom row of Figure 6. The mean (Figure 6(b-2)) and the standard deviation (Figure 6(b-3)) converge after ti = 100 in AF = 5%, ti = 40 in AF = 10% and AF = 20%, and ti = 100 in AF = 40%.
B. Effects of area fraction
We simulate mixing in vesicle suspensions with the area fractions of 10%, 20%, and 40%, and with no viscosity contrast. We use the layer initial condition. We fix the Peclet number to Pe = 1e+4 for all the area fractions by adjusting the diffusivity based on the value of . We show the vesicle positions, the magnitude of the perturbation in the Couette flow due to the vesicles (see Sec. V A for its definition), and the concentration for the area fractions of 10% in Figure 7, 20% in Figure 8, and 40% in Figure 9. The results show that as the area fraction increases, the maximum value of increases from approximately 1.5 to 4 wherein the maximum of the magnitude of the velocity field is 10 (see the second columns in Figures 7 and 9). The corresponding concentration fields observably differ as the area fraction of the vesicles increases (see the third columns in Figures 7 and 9). In addition to the qualitative results in Figures 7–9, the first row in Figure 10 demonstrates the corresponding mixing efficiencies. We see that the presence of vesicles enhances mixing for this particular initial condition and increasing the area fraction increases the efficiency as high as when AF = 40%.
C. Effects of Peclet number and initial condition
We simulate mixing with the Peclet numbers 1e + 4, 5e + 3, 2.5e + 3, 5e + 2, and 5e + 1, and for all four initial conditions in Figure 2(b). We, then, demonstrate the mixing efficiency η with respect to time in Figures 10 and 11. The results in Figures 10 and 11 show that the mixing efficiency is close to one for Pe, but it deviates from one as the Peclet number increases. This is expected since the perturbations in the velocity field become more important in the sense of mixing as the transport becomes more advection-dominated.
While the first row in Figure 10 shows that the presence of vesicles enhances mixing (i.e., ) for the layer initial condition, the second row demonstrates that vesicles suppress mixing for the dye initial condition. Additionally, as the area fraction increases (from left to right in Figures 10 and 11), the maximum efficiency increases for the layer initial condition and the minimum efficiency decreases for the dye initial condition. The first row in Figure 11 illustrates that mixing is better in the absence of vesicles for the vesicle initial condition; however, the effects of the vesicles on mixing become less important as the area fraction increases. Furthermore, a Couette flow without vesicles provides the same quality of mixing as the one with vesicles for the random initial condition for any area fraction (see the second row in Figure 11).
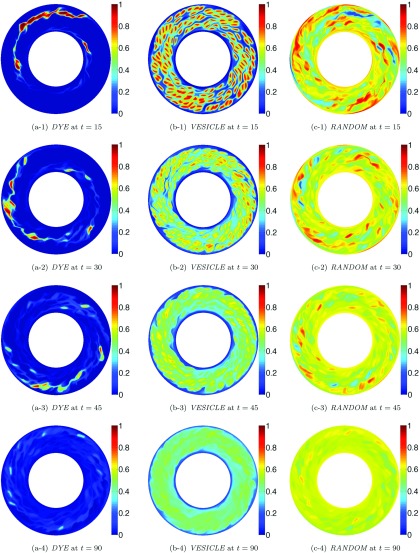
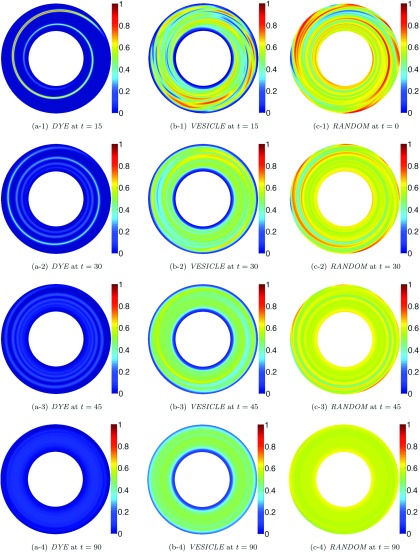
We have observed that in the presence of vesicles, mixing is promoted for the layer initial condition, while it is suppressed for the other three initial conditions. In Figures 12 and 13, we plot the concentration field ϕ with Pe = 1e+4 at a series of time steps when the dye, vesicle, and random initial conditions are used. The flow in Figure 12 includes vesicles with no viscosity contrast at an area fraction of 40% while the flow in Figure 13 is the default Couette flow without vesicles. In Figures 12 and 9, we see that the vesicle dynamics lead to a complex stirring pattern, but the vesicles create trapped regions of the concentration. However, in Figure 13, we also see a complex stirring pattern for the dye, vesicle, and random initial concentrations in the absence of vesicles, but without the trapped regions. Therefore, as observed in the bottom row of Figures 10 and 11, the mixing efficiency is less than 1. However, for the layer initial condition, in the absence of vesicles, the transport term vanishes since the gradient of the initial condition only has a radial component, while the default Couette flow does not have a radial component. Therefore, mixing can occur only due to diffusion. Since the Peclet number is large, little mixing occurs due to diffusion without the vesicles, and the mixing efficiency turns out to be greater than 1 as observed in the top row of Figure 10. In Sec. V E, we define a mixing measure M that can be used to predict the mixing efficiency of a given initial condition.
FIG. 12.
The evolution of the concentration field ϕ for various initial conditions in the presence of vesicles. We present the evolution of DYE (left), VESICLE (middle) with 40% area fraction, and RANDOM (right) initial concentrations at Pe = 1e+4. The velocity field is post-processed from the vesicle simulation with AF = 40% and VC = 1. The evolution of the same initial concentration fields in the absence of vesicles is in Figure 13.
FIG. 13.
The evolution of the concentration field ϕ for various initial concentrations in the absence of vesicles. We present the evolution of DYE (left), VESICLE (middle) with 40% area fraction, and RANDOM (right) initial concentrations at Pe = 1e+4. The evolution of the same initial concentration fields in the presence of vesicles is in Figure 12.
D. Effects of viscosity contrast
Vesicles manifest different dynamics under simple shear flow: either a tank-treading rotation or a tumbling motion. An increase in the viscosity contrast leads to a transition from a tank-treading to a tumbling motion.20 In order to identify the effects of the viscosity contrast on the degree of mixing, we study mixing in vesicle suspensions with the area fraction of 5% and the viscosity contrasts of 1, 5, and 8. We run the simulations for the layer initial condition and demonstrate the mixing efficiency η with respect to time in Figure 14.
Figures 14(a-1) show that an increase in the viscosity contrast results in additional mixing efficiency. However, for this initial condition, the viscosity contrast has less of an effect than the area fraction on the mixing efficiency.
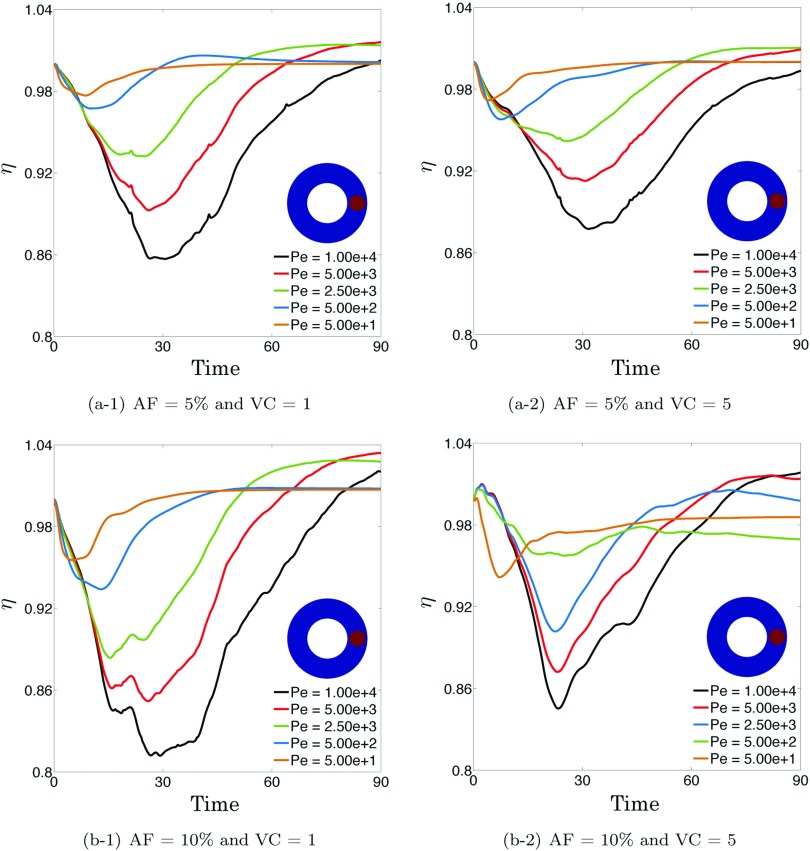
To further investigate the effect of the viscosity contrast, we run the simulations for the dye initial condition. We consider the area fractions of 5% and 10% and the viscosity contrasts of 1 and 5. As we observed Figure 11, mixing is suppressed in the presence of vesicles. The efficiency decreases further when the area fraction increases from 5% (Figure 15(a-1)) to 10% (Figure 15(b-1)) since more regions of the concentration will be trapped. Similar to what is observed for the layer initial condition, increase in viscosity contrast from 1 to 5 promotes mixing for both area fractions, especially around time 30.
FIG. 15.
The effects of the area fraction and the viscosity on mixing of the dye initial concentration. Here we use the area fractions 5% (top) and 10% (bottom) and the viscosity contrasts 1 (left) and 5 (right). Unlike the layer initial condition, the presence of vesicles suppresses mixing of the dye initial concentration by creating trapped regions, i.e., . Increase in area fraction from 5% to 10% decreases the mixing efficiency further. However, vesicles start to tumble for VC ≥ 5, which leads to more complex vesicle dynamics which promotes mixing. Therefore, the efficiency increases as viscosity contrast increases from 1 to 5, which is also observed for the layer initial condition in Figure 12.
E. Summary
In an attempt to predict the mixing efficiency based on the initial concentration (), we introduce a measure M of the ability of mixing for the default Couette flow,
| (5.1) |
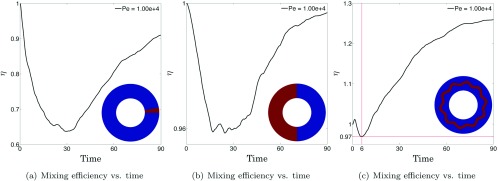
where and is the velocity field of the default Couette flow. Equation (5.1) is a normalized L1 norm of the advective term. We tabulate various initial conditions, the corresponding M values, and the minimum and the maximum efficiencies , in Table II. For all the initial concentrations that we consider except LAYER, M is initially non-zero meaning that mixing will occur due to advection in addition to diffusion. For these initial concentrations, the vesicle flow suppresses mixing by creating trapped regions. For the LAYER initial concentration, the advective term is initially zero and hence mixing occurs only due to diffusion. The vesicle flow provides better stirring and hence better mixing for this initial concentration than the default Couette flow. In order to verify this observation, we consider a slightly perturbed initial concentration in Figure 16(c), which has a concentration gradient such that the advective term is initially non-zero. The measure (5.1) for this initial concentration is M = 0.97. We simulate mixing of this initial concentration with the vesicle flow at and . The mixing efficiency is shown in Figure 16(c). For , the vesicle flow suppresses mixing and the minimum efficiency is attained at around t = 6, but for the vesicle flow promotes mixing. To explain this behavior we show frames from the mixing simulations with the vesicle flow and the default Couette flow in Figure 17. Before t = 6, mixing occurs due to advection in addition to diffusion in the default Couette flow; however, after t = 6, the concentration field approaches the LAYER initial condition whose gradient only has a radial component while the velocity field does not have radial component. Therefore, the advective term approaches zero, and mixing is dominated by diffusion in the default Couette flow. Consequently, the vesicle flow has trapped regions, which results in a poor quality of mixing. Therefore, as long as the default Couette flow mixes the solute with bothadvection and diffusion, it provides better mixing quality than the vesicle flow. However, in the cases where mixing occurs only due to diffusion in the default Couette flow (such as the layer initial condition), the vesicle flow provides better mixing quality than the default Couette flow since the solute is mixed with advection in addition to diffusion and the transport is advection dominated.
TABLE II.
We report the proposed measure (5.1) for various initial concentrations together with the minimum and maximum mixing efficiencies, and , that they deliver with the vesicle flow of area fraction and viscosity contrast at . Here, red is for and blue is for . The mixing efficiencies of two additional initial concentration fields are in Figure 16.
| M | M | ||||||
|---|---|---|---|---|---|---|---|
 |
0 | 1 | 1.34 |  |
0.98 | 0.96 | 1 |
 |
0.52 | 0.63 | 1 |  |
1.86 | 0.98 | 1 |
 |
0.69 | 0.64 | 1 |  |
2.29 | 0.998 | 1 |
FIG. 16.
We show the mixing efficiency η as a function of time delivered at by two initial concentrations (a) and (b) that we show in Table II. Here, the vesicle flow is the same for all initial concentrations and has an area fraction AF = 40% and viscosity contrast VC = 1. Additionally, we perturb the initial concentration Figure 10(a-3) and present the mixing efficiency in (c). We also show frames from the mixing simulation of (c) in Figure 17. The proposed measure (5.1) for this initial concentration is M = 0.97.
FIG. 17.
We present frames from the mixing simulation of the initial concentration shown in Figure 16(c). The frames at the first row are from the simulation with the vesicle flow of area fraction AF = 40% and viscosity contrast VC = 1. The ones at the second row are from the simulation with the Couette flow. Here, both simulations have the same Peclet number . The corresponding mixing efficiency is in Figure 16(c). In particular, the mixing efficiencies at the instances we show here are , and .
VI. CONCLUSION
Using an in-house integral equation solver and a pseudo-spectral advection diffusion solver, we have studied mixing in vesicle suspensions. To the best of our knowledge, this is the first study of the effect of vesicles on mixing. Mixing measures from the literature were investigated, and we focused on the negative index H−1 Sobolev norm which quantifies mixing due to both advection and diffusion. We compare mixing in the absence and the presence of vesicles and investigate the effects of the Peclet number, the area fraction, and the viscosity contrast. The main outcomes are as follows:
-
•
For the same average Peclet number, the presence of vesicles suppresses mixing in most of the cases, and increasing the area fraction suppresses it more. However, there are special initial conditions for the transported quantity for which there is no advective mixing in the absence of vesicles. The presence of vesicles provides advection in those cases and hence promotes mixing.
-
•
For the same average Peclet number and the same area fraction, increasing the viscosity contrast increases the mixing efficiency since the vesicles show more complicated dynamics at higher viscosity contrast, leading to a more complicated stirring of the solute.
-
•
In order to estimate whether the presence of vesicles promotes or suppresses mixing, we define a measure where is the initial concentration field and v is the default Couette velocity field. We found that when the measure M of a concentration for a passively transported quantity approaches zero, mixing is dominated by diffusion in the absence of vesicles. Since the vesicle flows are more chaotic, the presence of vesicles promotes mixing of the passively transported quantity.
Although here we consider only a two-dimensional cylindrical Couette flow, similar results should hold for a planar Couette flow and Poiseuille flow. Additionally, mixing might present different physics in three dimensions which we will investigate in a future study.
ACKNOWLEDGMENTS
This material is based upon the work supported by AFOSR Grant No. FA9550-12-10484, by NSF Grant No. CCF-1337393, by the U.S. Department of Energy, Office of Science, Office of Advanced Scientific Computing Research, Applied Mathematics program under Award Nos. DE-SC0010518 and DE-SC0009286, by NIH Grant No. 10042242, by DARPA Grant No. W911NF-115-2-0121, and by the Technische Universität München—Institute for Advanced Study, funded by the German Excellence Initiative (and the European Union Seventh Framework Programme under Grant Agreement No. 291763). Any opinions, findings, and conclusions or recommendations expressed herein are those of the authors and do not necessarily reflect the views of the AFOSR, DOE, NIH, DARPA, and NSF. Computing time in the Texas Advanced Computing Centers Stampede system was provided by an allocation from TACC and the NSF.
NOMENCLATURE
- Pe
Peclet number: ratio of the advective transport rate to the diffusive transport rate
- AF
Area fraction: ratio of the area occupied by vesicles to the area of the Couette apparatus
- VC
Viscosity contrast: ratio of the fluid viscosity inside a vesicle to the fluid viscosity in the bulk
- Nr
Number of collocation points in the radial direction r
Number of collocation points in the azimuthal direction
Concentration in the absence of vesicles
Concentration in the presence of vesicles
Mixing efficiency: ratio of to
- v0
Velocity field of a Couette flow without vesicles
- v
Velocity field of a vesicle suspension
REFERENCES
- 1.Adrover A., Giona M., Muzzio F., Cerbelli S., and Alvarez M., “Analytic expression for the short-time rate of growth of the intermaterial contact perimeter in two-dimensional chaotic flows and Hamiltonian systems,” Phys. Rev. E 58, 447–458 (1998). 10.1103/PhysRevE.58.447 [DOI] [Google Scholar]
- 2.Alvarez M., Muzzio F., Cerbelli S., Adrover A., and Giona M., “Self-similar spatiotemporal structure of intermaterial boundaries in chaotic flows,” Phys. Rev. Lett. 81, 3395–3398 (1998). 10.1103/PhysRevLett.81.3395 [DOI] [Google Scholar]
- 3.Annaswamy A. M. and Ghoniem A. F., “Active control in combustion systems,” IEEE Control Syst. Mag. 15, 49–63 (1995). 10.1109/37.476386 [DOI] [Google Scholar]
- 4.Aref H. and Balachandar S., “Chaotic advection in a Stokes flow,” Phys. Fluids 29, 3515–3521 (1986). 10.1063/1.865828 [DOI] [Google Scholar]
- 5.Ashwin P., Nicol M., and Kirkby N., “Acceleration of one-dimensional mixing by discontinuous mappings,” Physica A 130, 347–363 (2002). 10.1016/S0378-4371(02)00774-4 [DOI] [Google Scholar]
- 6.Bottausci F., Mezic I., Meinhart C. D., and Cardonne C., “Mixing in the shear superposition micromixer: Three-dimensional analysis,” Philos. Trans. R. Soc., A 362, 1001–1018 (2004). 10.1098/rsta.2003.1359 [DOI] [PubMed] [Google Scholar]
- 7.Boyd J. P., Chebyshev and Fourier Spectral Methods, 2nd ed. (Dover Publications, Mineola, NY, USA, 2013). [Google Scholar]
- 8.Christlieb A., Guo W., Morton M., and Qiu J.-M., “A high order time splitting method based on integral deferred correction for semi-Lagrangian Vlasov simulations,” J. Comput. Phys. 267, 7–27 (2014). 10.1016/j.jcp.2014.02.012 [DOI] [Google Scholar]
- 9.Crank J. and Nicolson P., “A practical method for numerical evaluation of solutions of partial differential equations of the heat-conduction type,” in Mathematical Proceedings of the Cambridge Philosophical Society (Cambridge University Press, 1947), Vol. 43, pp. 50–67. [Google Scholar]
- 10.D’Alessandro D., Dahleh M., and Mezic I., “Control of mixing in fluid flow: A maximum entropy approach,” IEEE Trans. Autom. Control 44, 1852–1863 (1999). 10.1109/9.793724 [DOI] [Google Scholar]
- 11.Doering C. and Thiffeault J., “Multiscale mixing efficiencies for steady sources,” Phys. Rev. E 74, 025301 (2006). 10.1103/physreve.74.025301 [DOI] [PubMed] [Google Scholar]
- 12.Falcone M. and Ferretti R., “Convergence analysis for a class of high-order semi-Lagrangian advection schemes,” SIAM J. Numer. Anal. 35, 909–940 (1998). 10.1137/S0036142994273513 [DOI] [Google Scholar]
- 13.Finn M., Cox S., and Byrne H., “Mixing measures for a two-dimensional chaotic Stokes flow,” J. Eng. Math. 48, 129–155 (2004). 10.1023/b:engi.0000011930.55539.69 [DOI] [Google Scholar]
- 14.Foures D. P. G., Caulfied C. P., and Schmid P., “Optimal mixing in two-dimensional plane Poiseuille flow at finite Peclet number,” J. Fluid Mech. 748, 241–277 (2014). 10.1017/jfm.2014.182 [DOI] [Google Scholar]
- 15.Ghigliotti G., Rahimian A., Biros G., and Misbah C., “Vesicle migration and spatial organization driven by flow line curvature,” Phys. Rev. Lett. 106, 028101 (2011). 10.1103/physrevlett.106.028101 [DOI] [PubMed] [Google Scholar]
- 16.Goldsmith H. and Skalak R., “Hemodynamics,” Annu. Rev. Fluid Mech. 7, 213–247 (1975). 10.1146/annurev.fl.07.010175.001241 [DOI] [Google Scholar]
- 17.Hessel V., Lowe H., and Schonfeld F., “Micromixers—A review on passive and active mixing principles,” Chem. Eng. Sci. 60, 2479–2501 (2005). 10.1016/j.ces.2004.11.033 [DOI] [Google Scholar]
- 18.Thiffeault J. L., “Using multiscale norms to quantify mixing and transport,” Nonlinearity 25, R1–R44 (2012). 10.1088/0951-7715/25/2/r1 [DOI] [Google Scholar]
- 19.Katija K. and Dabiri J. O., “A viscosity-enhanced mechanism for biogenic ocean mixing,” Nature 460, 624–626 (2009). 10.1038/nature08207 [DOI] [PubMed] [Google Scholar]
- 20.Keller S. and Skalak R., “Motion of a tank-treading ellipsoidal particle in a shear flow,” J. Fluid Mech. 120, 27–47 (1982). 10.1017/S0022112082002651 [DOI] [Google Scholar]
- 21.Khakhar D., Rising H., and Ottino J. M., “Analysis of chaotic mixing in two model systems,” J. Fluid Mech. 172, 419–451 (1986). 10.1017/S0022112086001805 [DOI] [Google Scholar]
- 22.Kim M. J. and Breuer K. S., “Enhanced diffusion due to motile bacteria,” Phys. Fluids 16(9), L78–L81 (2004). 10.1063/1.1787527 [DOI] [Google Scholar]
- 23.Kraus M., Wintz W., Seifert U., and Lipowsky R., “Fluid vesicles in shear flow,” Phys. Rev. Lett. 77(17), 3685–3688 (1996). 10.1103/PhysRevLett.77.3685 [DOI] [PubMed] [Google Scholar]
- 24.Leiken F., Coulliette C., Mariano A. J., Ryan E. H., Shay L., Haller G., and Marsden J., “Pollution release tied to invariant manifolds: A case study for the coast of Florida,” Physica D 210, 1–20 (2005). 10.1016/j.physd.2005.06.023 [DOI] [Google Scholar]
- 25.Leveque R. J., Finite Difference Methods for Ordinary and Partial Differential Equations (SIAM, Philadelphia, PA, USA, 2007). [Google Scholar]
- 26.Lin Z., Thiffeault J., and Doering C., “Optimal stirring strategies for passive scalar mixing,” J. Fluid Mech. 675, 465–476 (2011). 10.1017/S0022112011000292 [DOI] [Google Scholar]
- 27.Lin Z., Thiffeault J.-L., and Childress S., “Stirring by squirmers,” J. Fluid Mech. 669, 167–177 (2011). 10.1017/S002211201000563X [DOI] [Google Scholar]
- 28.Mathew G., Mezic I., Grivopoulos S., Vaidya U., and Petzold L., “Optimal control of mixing in Stokes fluid flows,” J. Fluid Mech. 580, 261–281 (2007). 10.1017/S0022112007005332 [DOI] [Google Scholar]
- 29.Mathew G., Mezic I., and Petzold L., “A multiscale measure for mixing,” Physica D 211, 23–46 (2005). 10.1016/j.physd.2005.07.017 [DOI] [Google Scholar]
- 30.Meleshko V. and Aref H., “A blinking rotlet model for chaotic advection,” Phys. Fluids 8, 3215–3217 (1996). 10.1063/1.869128 [DOI] [Google Scholar]
- 31.Misbah C., “Vacillating breathing and tumbling of vesicles under shear flow,” Phys. Rev. Lett. 96(2), 028104 (2006). 10.1103/PhysRevLett.96.028104 [DOI] [PubMed] [Google Scholar]
- 32.Muzzio F. and Swanson P., “The statistics of stretching and stirring in chaotic flows,” Phys. Fluids A 3, 822–834 (1991). 10.1063/1.858013 [DOI] [Google Scholar]
- 33.Nacev A., Beni C., Bruno O., and Shapiro B., “The behaviors of ferro-magnetic nano-particles in and around blood vessels under applied magnetic fields,” J. Magn. Magn. Mater. 323(6), 651–668 (2011). 10.1016/j.jmmm.2010.09.008 [DOI] [PMC free article] [PubMed] [Google Scholar]
- 34.Noguchi H. and Gompper D., “Shape transitions of fluid vesicles and red blood cells in capillary flows,” Proc. Natl. Acad. Sci. U. S. A. 102, 14159–14164 (2005). 10.1073/pnas.0504243102 [DOI] [PMC free article] [PubMed] [Google Scholar]
- 35.Ottino J. and Wiggins S., “Introduction: Mixing in microfluidics,” Philos. Trans. R. Soc., A 362, 923–935 (2004). 10.1098/rsta.2003.1355 [DOI] [PubMed] [Google Scholar]
- 36.Ottino J. M., “Mixing, chaotic advection, and turbulence,” Annu. Rev. Fluid Mech. 22, 207–253 (1990). 10.1146/annurev.fl.22.010190.001231 [DOI] [Google Scholar]
- 37.Popel A. S. and Johnson P. C., “Microcirculation and hemorheology,” Annu. Rev. Fluid Mech. 37, 43–69 (2005). 10.1146/annurev.fluid.37.042604.133933 [DOI] [PMC free article] [PubMed] [Google Scholar]
- 38.Pozrikidis C., Boundary Integral and Singularity Methods for Linearized Viscous Flow (Cambridge University Press, Cambridge, UK, 1992). [Google Scholar]
- 39.Quaife B. and Biros G., “High-volume fraction simulations of two-dimensional vesicle suspensions,” J. Comput. Phys. 274, 245–267 (2014). 10.1016/j.jcp.2014.06.013 [DOI] [Google Scholar]
- 40.Quaife B. and Biros G., “Adaptive time stepping for vesicle suspensions,” J. Comput. Phys. 306, 478–499 (2016). 10.1016/j.jcp.2015.11.050 [DOI] [Google Scholar]
- 41.Rahimian A., Veerapaneni S., and Biros G., “Dynamic simulation of locally inextensible vesicles suspended in an arbitrary two-dimensional domain, a boundary integral method,” J. Comput. Phys. 229, 6466–6484 (2010). 10.1016/j.jcp.2010.05.006 [DOI] [Google Scholar]
- 42.Robert A., “A stable numerical integration scheme for the primitive meteorological equations,” Atmos.-Ocean 19, 35–46, doi: 10.1080/07055900.1981.9649098 (1981). 10.1080/07055900.1981.9649098 [DOI] [Google Scholar]
- 43.Rothstein D., Henry E., and Gollub J., “Persistent patterns in transient chaotic fluid mixing,” Nature 401, 770–772 (1999). 10.1038/44529 [DOI] [Google Scholar]
- 44.Strang G., “On the construction and comparison of difference schemes,” SIAM J. Numer. Anal. 5(3), 506–517 (1968). 10.1137/0705041 [DOI] [Google Scholar]
- 45.Thiffeault J., Doering C. S., and Gibbon J. D., “A bound on mixing efficiency for the advection-diffusion equation,” J. Fluid Mech. 521, 105–114 (2004). 10.1017/S0022112004001739 [DOI] [Google Scholar]
- 46.Torquato S., Random Heterogeneous Materials: Microstructure and Macroscopic Properties (Springer, 2002). [Google Scholar]
- 47.Trefethen N. L., Spectral Methods in MATLAB (SIAM, Philadelphia, PA, USA, 2000). [Google Scholar]
- 48.Underhill P. T., Hernandez-Ortiz J. P., and Graham M. D., “Diffusion and spatial correlations in suspensions of swimming particles,” Phys. Rev. Lett. 100, 248101 (2008). 10.1103/PhysRevLett.100.248101 [DOI] [PubMed] [Google Scholar]
- 49.Veerapaneni S., Gueyffier D., Zorin D., and Biros G., “A boundary integral method for simulating the dynamics of inextensible vesicles suspended in a viscous fluid in 2d,” J. Comput. Phys. 228(7), 2334–2353 (2009). 10.1016/j.jcp.2008.11.036 [DOI] [Google Scholar]
- 50.Wade B. A., Khaliq A. Q. M., Yousuf M., Vigo-Aguiar J., and Deininger R., “On the smoothing of the Crank-Nicolson scheme and higher order schemes for pricing barrier options,” J. Comput. Appl. Math. 204, 144–158 (2007). 10.1016/j.cam.2006.04.034 [DOI] [Google Scholar]
- 51.Wang C. and Popel A. S., “Effect of red blood cell shape on oxygen transport in capillaries,” Math. Biosci. 116, 89–110 (1993). 10.1016/0025-5564(93)90062-f [DOI] [PMC free article] [PubMed] [Google Scholar]
- 52.Xiu D. and karniadakis G., “A semi-Lagrangian high-order method for the Navier-Stokes equations,” J. Comput. Phys. 172, 658–684 (2001). 10.1006/jcph.2001.6847 [DOI] [Google Scholar]
- 53.Zhao H., Isfahani A. H., Olson L. N., and Freund J. B., “A spectral boundary integral method for flowing blood cells,” J. Comput. Phys. 229, 3726–3744 (2010). 10.1016/j.jcp.2010.01.024 [DOI] [Google Scholar]
- 54.Zvan R., Vetzal K. R., and Forsyth P. A., “PDE methods for pricing barrier options,” J. Econ. Dyn. Control 24, 1563–1590 (2000). 10.1016/S0165-1889(00)00002-6 [DOI] [Google Scholar]


