The mammalian liver consists of hexagonal-shaped lobules, radially polarized by blood flow and morphogens1–4. Key liver genes have been shown to be differentially expressed along the lobule axis, a phenomenon termed zonation5,6, but a detailed genome-wide reconstruction of this spatial division of labor has not been achieved. Here we measure the entire transcriptome of thousands of mouse liver cells and infer their lobule coordinates based on a panel of zonated landmark genes, characterized with single molecule fluorescence in-situ hybridization7. Using this approach we obtain the zonation profiles of all liver genes with high spatial resolution. We find that more than 50% of liver genes are significantly zonated and uncover abundant non-monotonic profiles that peak at the mid-lobule layers. These include a spatial order of bile-acid biosynthesis enzymes that matches their position in the enzymatic cascade. Our approach can facilitate reconstruction of similar spatial genomic blueprints for other mammalian organs.
The liver is a heterogeneous tissue that consists of hepatocytes operating in repeating anatomical units termed lobules. The hexagonally shaped lobules are composed of about 15 concentric layers of hepatocytes1,4. Blood flowing from portal veins and hepatic arteries at the corners of the lobules towards draining central veins creates gradients of oxygen, nutrients and hormones. In addition, Wnt morphogens secreted from the central vein generate an inverse polarizing field2. In line with this graded microenvironment, different radial layers sub-specialize in distinct processes, a phenomenon termed ‘liver zonation’6,8. This spatial division of labor is thought to confer optimality for liver function. For example, the outer highly oxygenated periportal lobule layers express higher levels of enzymes involved in energy-demanding tasks such as gluconeogenesis and ureagenesis, whereas the inner pericentral layers specialize in glycolysis and xenobiotic metabolism.
Zonation patterns of different liver functions have been traditionally studied using RNA in-situ hybridization and immunohistochemistry5,8. These techniques are limited in their sensitivity and throughput. High-throughput methods identified genome-wide differences in expression between cells enriched for portal and central hepatocytes, however the spatial resolution of these studies was limited to two populations, isolated via either perfusion techniques9 or laser capture microdissection10.
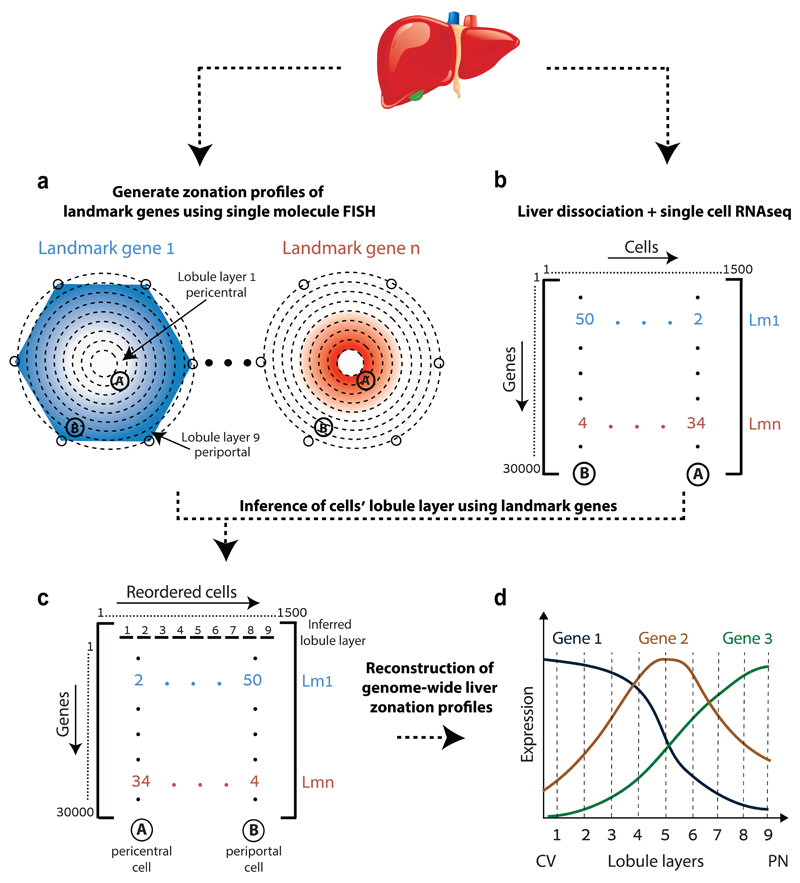
Whole-genome reconstruction of liver zonation requires a technique to measure the entire transcriptome and the lobule coordinates of many liver cells. Single cell RNA sequencing (scRNAseq) enables measuring the genome-wide expression patterns of thousands of cells11–14, however this technique requires tissue dissociation, thus losing the spatial context of each cell. Combining scRNAseq with in-situ expression measurements of landmark genes can enable inference of the original tissue coordinates. Such approach has recently been applied to dissect spatial gene expression signatures during embryogenesis15,16. Liver tissue is particularly challenging, as most liver genes exhibit spatially-graded rather than binary expression patterns. We have previously applied single molecule Fluorescence in-situ Hybridization (smFISH) to measure the mRNA content of hepatocytes in intact mouse liver7. This technique has the sensitivity and dynamic range to measure precise mRNA distributions at distinct lobule coordinates. We therefore combined smFISH with scRNAseq to achieve a genome-wide reconstruction of liver zonation (Fig. 1).
Fig. 1. Strategy for spatially resolved single-cell reconstruction of liver zonation.
(a) Spatial barcode of zonated landmark (Lm) genes measured with smFISH. (b) scRNAseq provides the transcriptome of thousands of mouse liver cells. (c) Spatial barcode is used to infer the porto-central coordinates of each cell. For example, cell B, containing 50 UMI of the blue Lm1, and 4 UMI of the red Lmn is inferred to have resided in the outer periportal layers. Cell A, with 2 UMI of Lm1 and 34 UMI of Lmn is inferred to have resided in the inner pericentral layers. (d) These coordinates are used to reconstruct the spatial zonation profiles of all liver genes.
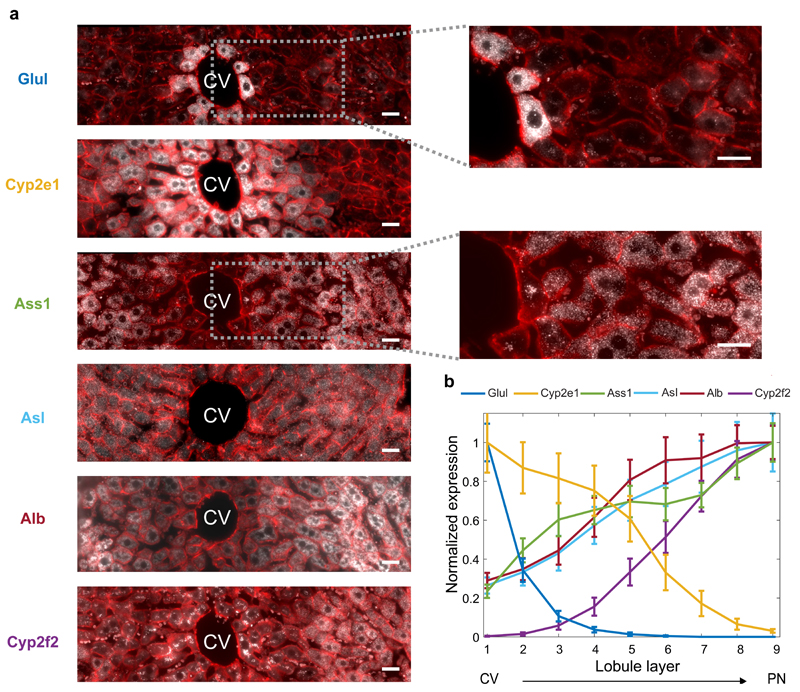
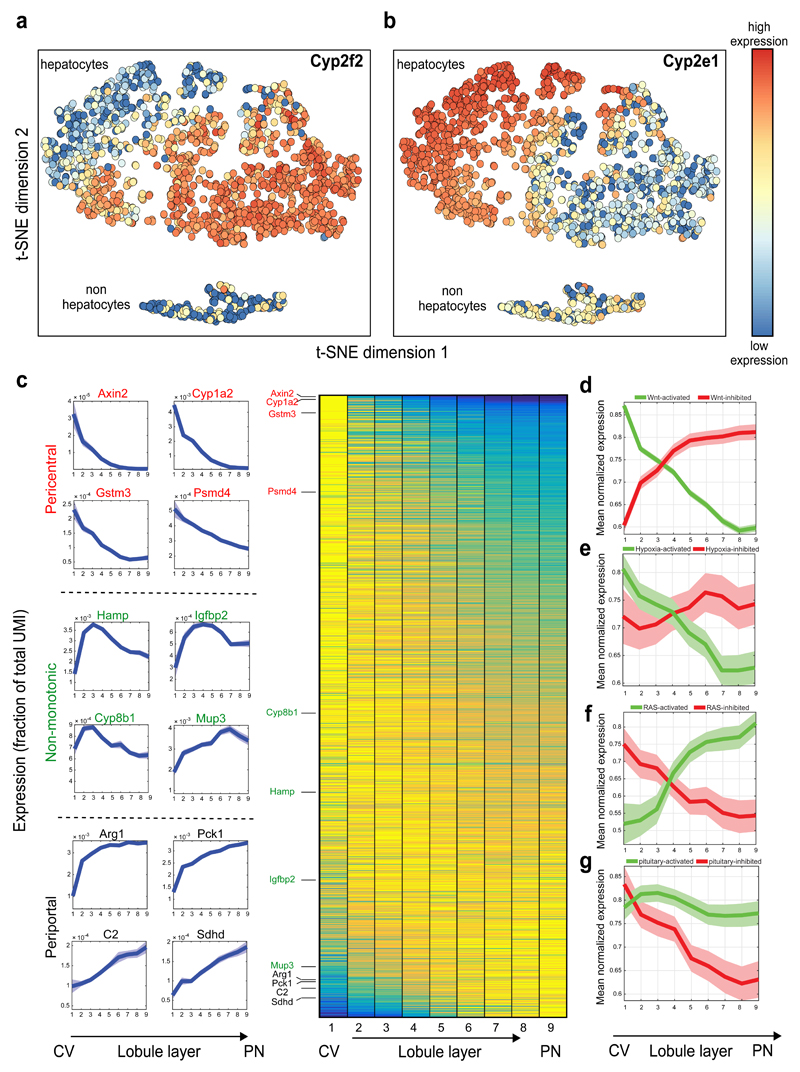
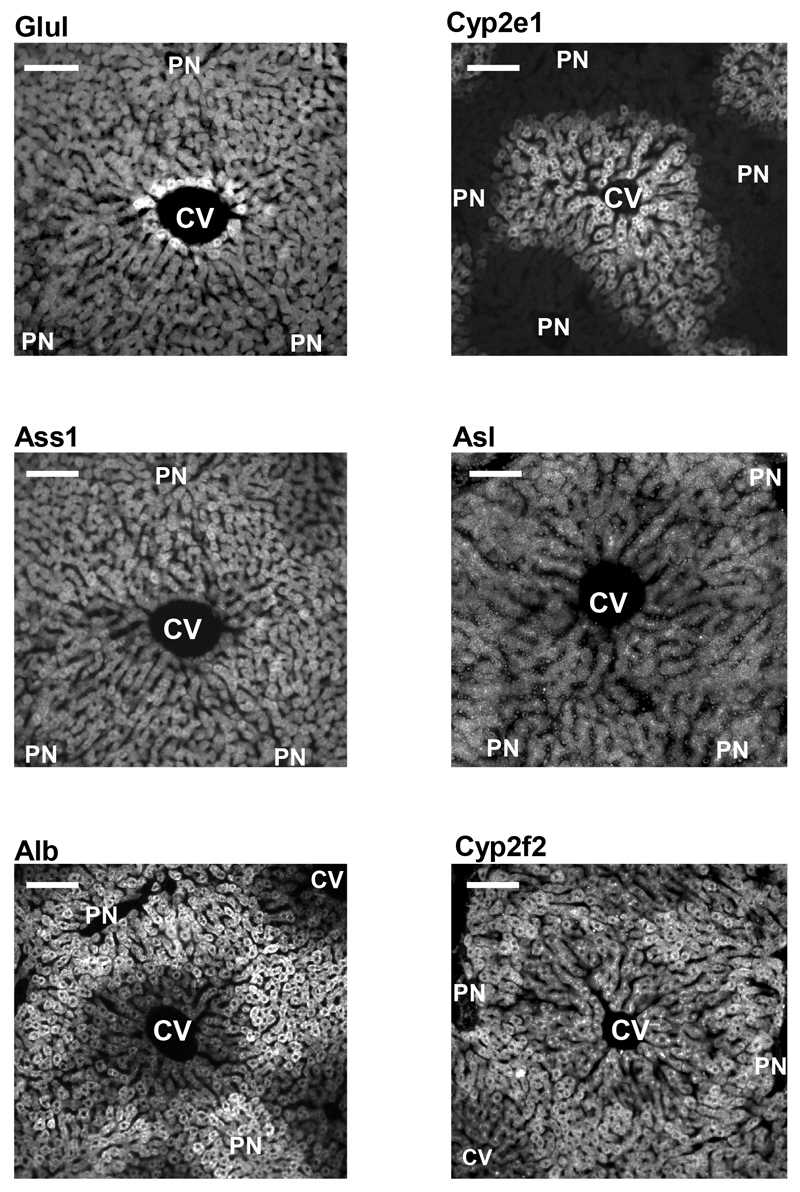
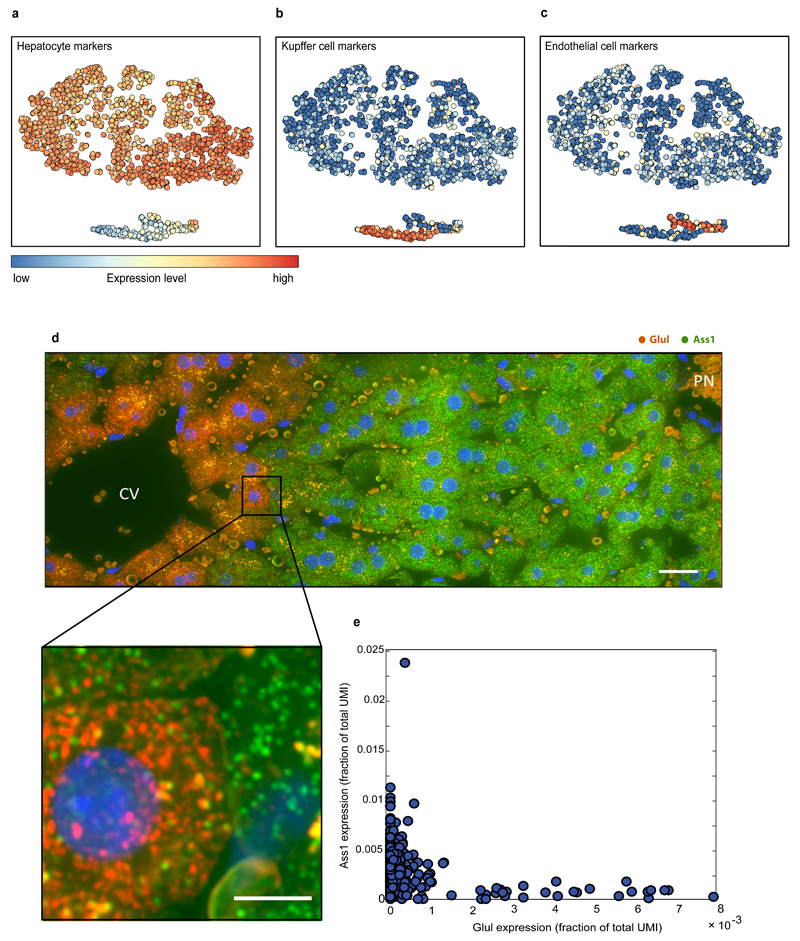
As a panel of landmark genes we chose six highly expressed liver genes with diverse zonation patterns – the pericentral genes Glul and Cyp2e19 and the periportal genes Ass110, Asl10, Alb8 and Cyp2f29, (Fig. 2a, Extended Data Fig. 1). We segmented thousands of liver cells spanning the porto-central lobule axis of fasted mice, and reconstructed the spatially-dependent probability of observing cells with distinct mRNA levels (Fig. 2b, Supplementary information). In parallel, we used massively parallel single cell RNA-seq (MARS-seq)17 to measure the entire transcriptome of more than 1,500 dissociated liver cells (Table S1). Our measurements revealed three distinct populations consisting of Kupffer cells, endothelial cells and hepatocytes (Extended Data Fig. 2a-c). Hepatocytes were highly heterogeneous in their expression patterns and exhibited clear gradients that matched our landmark gene profiles (Fig. 3a, b). The urea cycle gene Ass1 and the glutamine synthetase gene Glul were expressed in a mutually exclusive manner in the single-cell data, demonstrating the purity of the single cell isolation (Extended Data Fig. 2d-e).
Fig. 2. A spatial barcode of zonated landmark genes.
(a) smFISH micrographs of our landmark genes. Gray dots - single mRNA, Red - phalloidin-stained membranes. Insets show pericentral regions of the spatially-discordant genes Glul (top) and Ass1 (bottom), demonstrating the dynamic range of smFISH. Scale bar-20µm. CV-central vein. Micrographs are representative of at least 10 lobules and two mice per gene. (b) Zonation profiles of the landmark genes. X axis is the scaled distance from the CV, Y axis is the max-normalized expression level. All landmark genes are highly significantly zonated (Kruskal-Wallis p<10-98). Errorbars are s.e.m. based on at least 800 cells from 10 lobules and two mice.
Fig. 3. Genome-wide zonation patterns revealed by spatially-resolved single-cell RNAseq.
(a-b) t-SNE visualization of the scRNAseq data. Colors denote relative cellular expression of landmark genes Cyp2f2 (a) and Cyp2e1 (b). (c) Zonation profiles of the 3496 significantly zonated genes. Genes sorted by the profiles’ centers of mass. Left-examples of pericentral, periportal and non-monotonic profiles. (d-g) Signaling pathways affecting liver zonation. Shown are average zonation profiles, patches are s.e.m. (d) Green-Wnt-activated genes19 (n=810), red-Wnt-inhibited genes19 (n=193). (e) Green-hypoxia activated genes20 (n=95), red-hypoxia inhibited genes20 (n=45). (f) Green-Ras-activated genes22 (n=43) red-Ras-inhibited genes22 (n=50). (g) Green-genes reduced (n=81), red-genes increased (n=51) in expression in hypopituitary mice23.
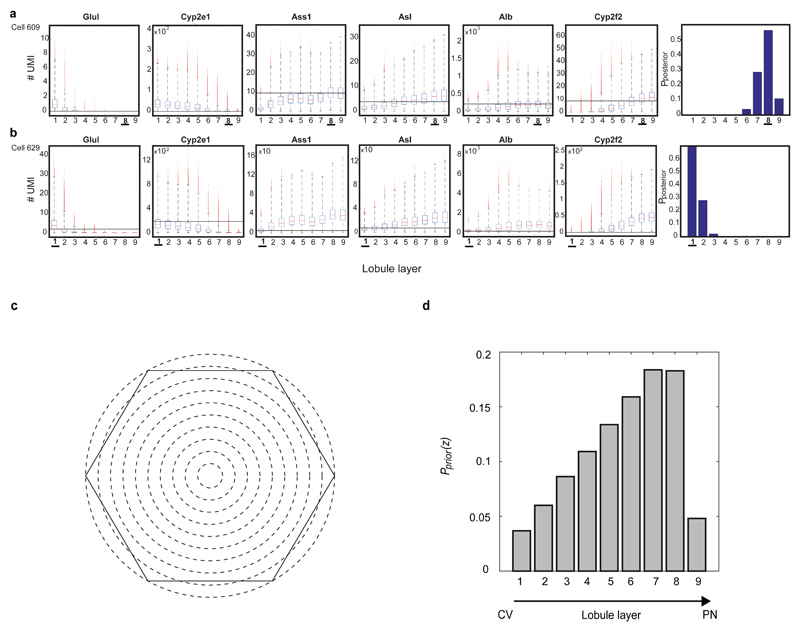
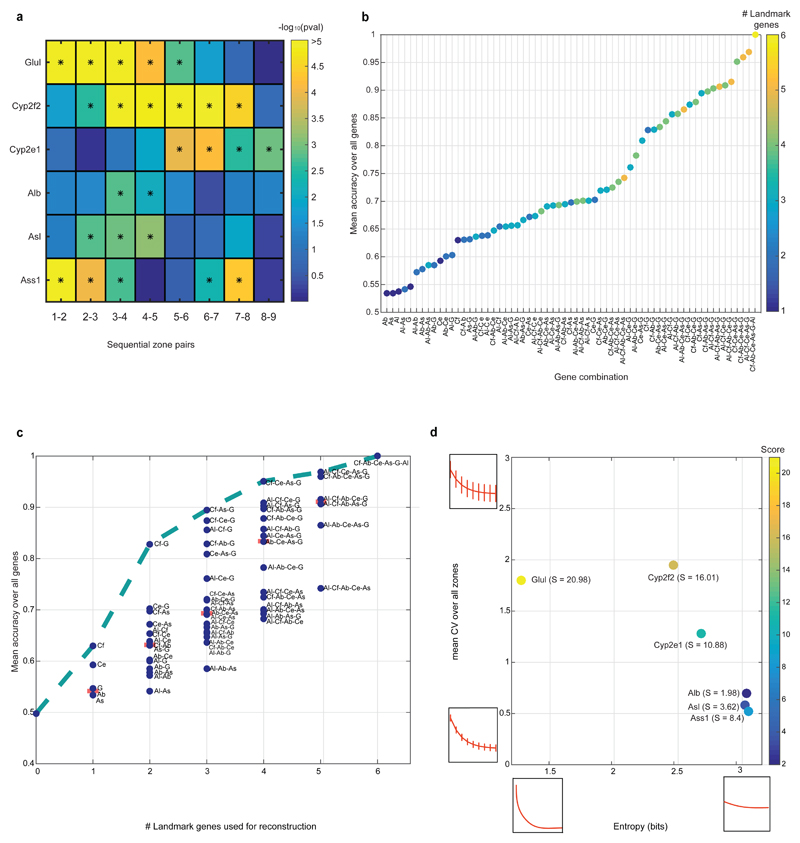
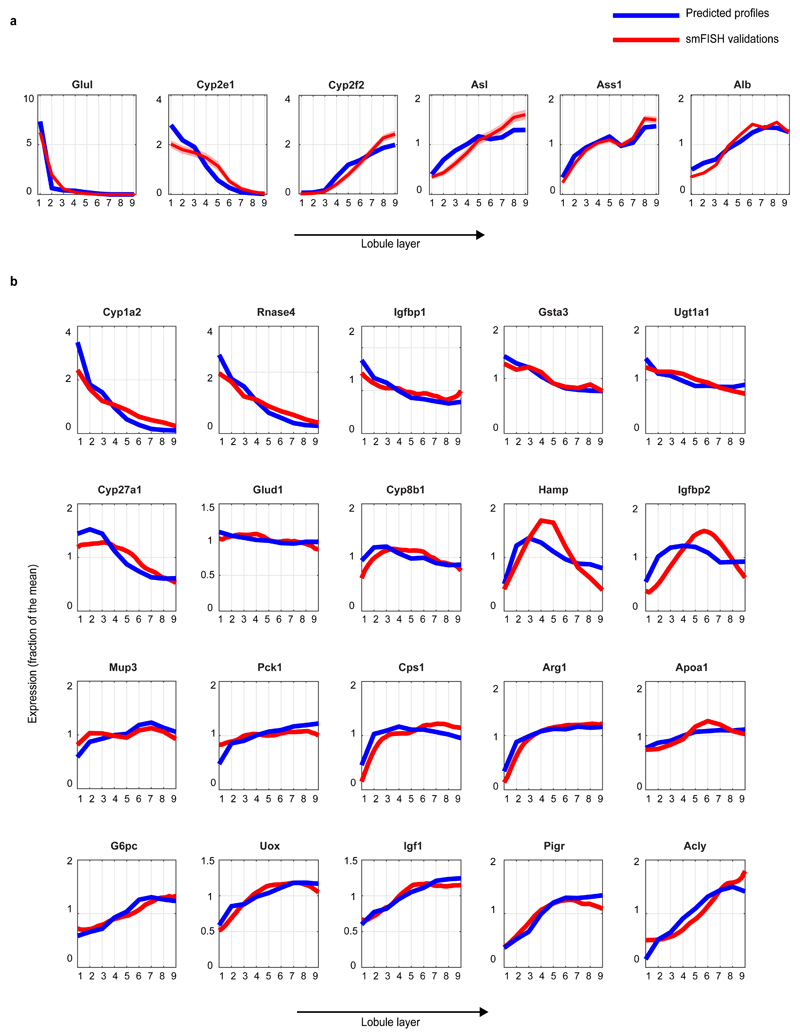
To combine the scRNAseq results with our smFISH-obtained zonation profiles we divided the porto-central lobule axis into nine layers and developed a probabilistic inference algorithm to compute the likelihood of each cell to belong to any of these layers, based on the expression of our panel of landmark genes (Extended Data Fig. 3, Supplementary information, Tables S2, S7). Our reconstruction accuracy approached saturation at 6 genes. It was strongly dependent on the extent of zonation of our landmark genes, and only weakly dependent on the intra-layer cell-to-cell variability (Extended Data Fig. 4). We validated the precision of our reconstructed zonation profiles using smFISH on 20 genes with diverse profiles and found an excellent overall correspondence between the predicted and measured profiles (Extended Data Fig. 5).
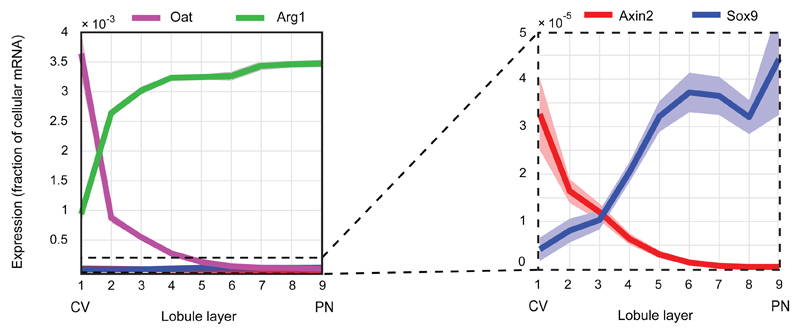
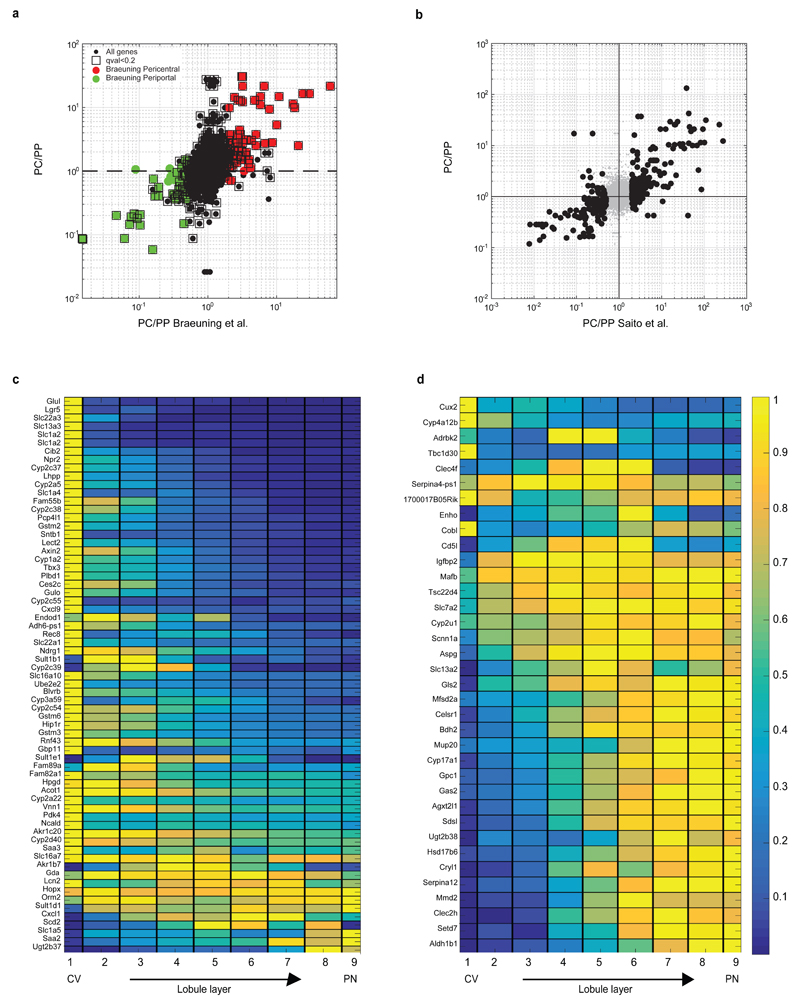
Our analysis revealed that around 50% of the expressed liver genes are non-randomly spatially zonated (Fig. 3c, Table S3, 3496 of 7277 genes with qval<0.2, Kruskal-Wallis test), an order of magnitude higher than previous estimates9. Our reconstructed profiles recapitulated the expression of genes over more than 4 orders of magnitude, including lowly expressed genes such as the pericentral Axin22 and the periportal Sox918 (Fig. 3c, Extended Data Fig. 6). The porto-central ratio of our reconstructed profiles correlated with previous datasets that compared the transcriptome of pericentral and periportal hepatocytes2,9,10 (Extended Data Fig. 7).
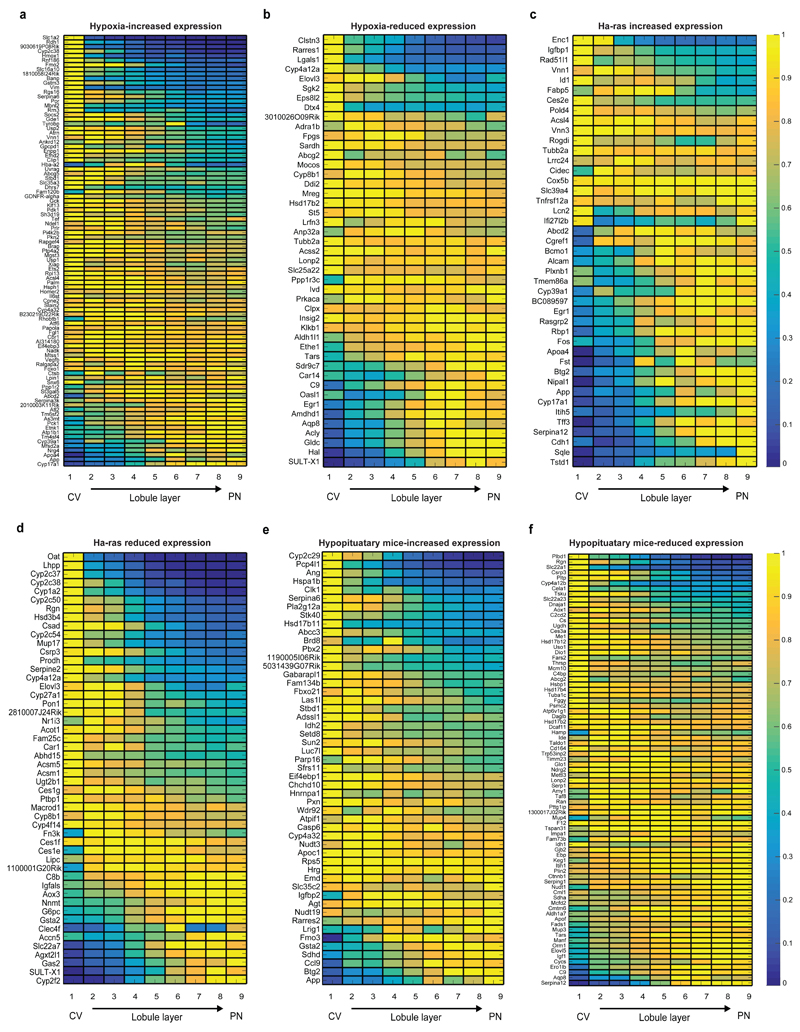
We next examined which signaling pathways shape the global liver zonation profiles our method revealed. Diffusible Wnt signals, originating at the pericentral endothelial cells, have been suggested to be of major importance in inducing pericentral zonation profiles2,3. We found that liver genes that increased in expression in Wnt-hyperactivating liver-specific APC-KO mice19 were predominantly pericentral (810 of our 3496 zonated genes, median peak expression at layer 1), whereas genes that decreased in APC-KO had a significantly stronger periportal bias (193 of our 3496 zonated genes, median peak expression at layer 6, Wilcoxon rank-sum p <10-31, Fig. 3d, Table S4). Similarly, 95 of the 3496 zonated genes that were shown to increase in expression upon chronic hypoxia20 were significantly biased towards the low-oxygenated pericentral layers, compared to 45 of the zonated genes that decreased in chronic hypoxia (Fig. 3e, Extended Data Fig. 8a,b, p=0.022). Thus Wnt signaling and oxygen are major factors inducing pericentral zonation profiles.
Ras signaling has been hypothesized to induce periportal zonation profiles21. We found that the zonation profiles of genes that increased in expression in Ha-ras hyperactivated tumors22 were significantly more periportal compared to genes that reduced in expression (p=0.0001, Fig. 3f, Extended Data Fig. 8c,d). We also found that pituitary hormones repress pericentral genes, as evident by the pericentral profile of genes that increase in hypopituitary dwarf mice23 (p=0.0054, Fig. 3g, Extended Data Fig. 8e,f). Importantly, about two thirds of the zonated genes (2314 out of 3496 genes) were not predicted targets of either Wnt, hypoxia, Ras signaling or pituitary hormones, suggesting that their zonation is affected by combinatorial regulation of these factors or by additional yet to be identified morphogens or blood born factors.
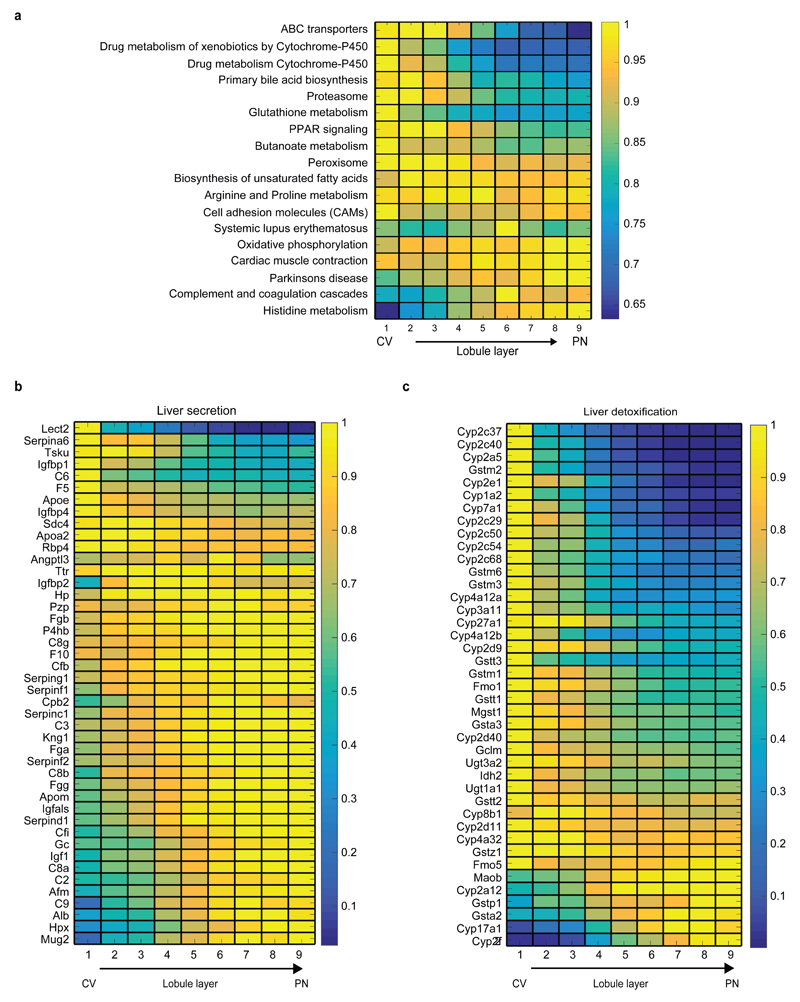
To explore the zonation patterns of specific biological pathways, we analyzed the KEGG database and found that 25 of the 186 KEGG pathways were enriched for zonated genes (hypergeometric test, q<0.1, Table S5, Extended Data Fig. 9a). The oxidative phosphorylation pathway exhibited higher expression in the periportal layers, where oxygen concentration is higher, as were the secreted proteins composing the complement and coagulation cascades pathway. More generally we identified a periportal bias in the mRNA of genes encoding liver secreted proteins (Extended Data Fig. 9b). Allocating the ATP-demanding task of plasma protein production to the well-oxygenated periportal layers may be energetically efficient, since an estimated 20% of liver oxygen consumption is dedicated to this task24. Pericentrally-biased pathways included detoxification pathways such as xenobiotic metabolism and glutathione metabolism (Extended Data Fig. 9c), as well as bile acid biosynthesis and proteasome components (Extended Data Fig. 9a).
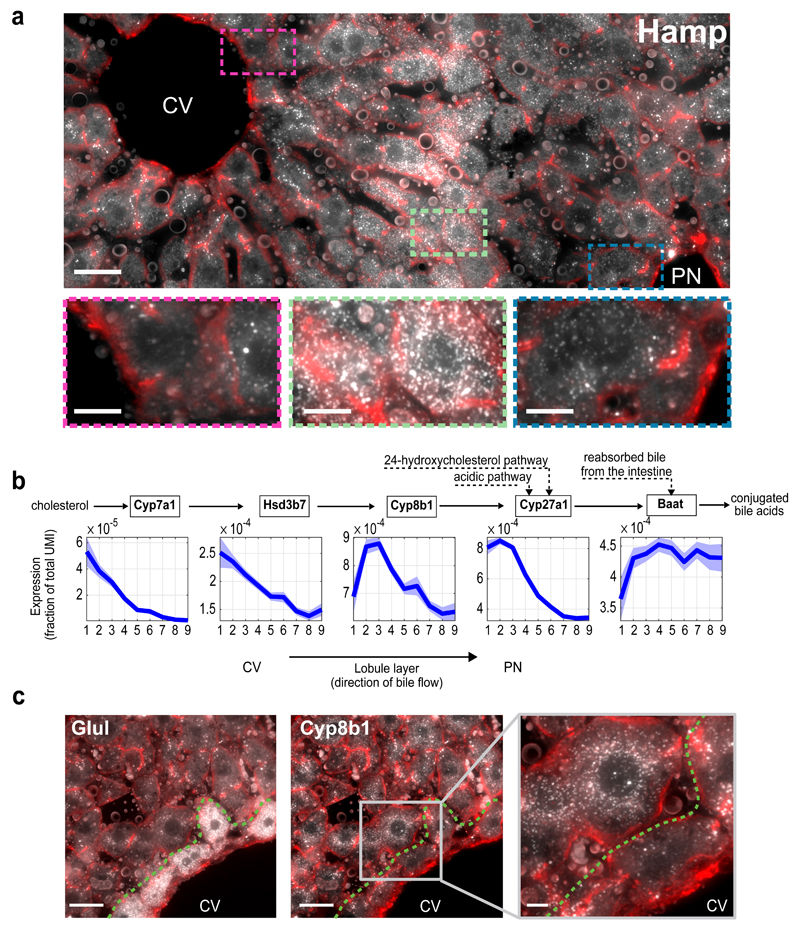
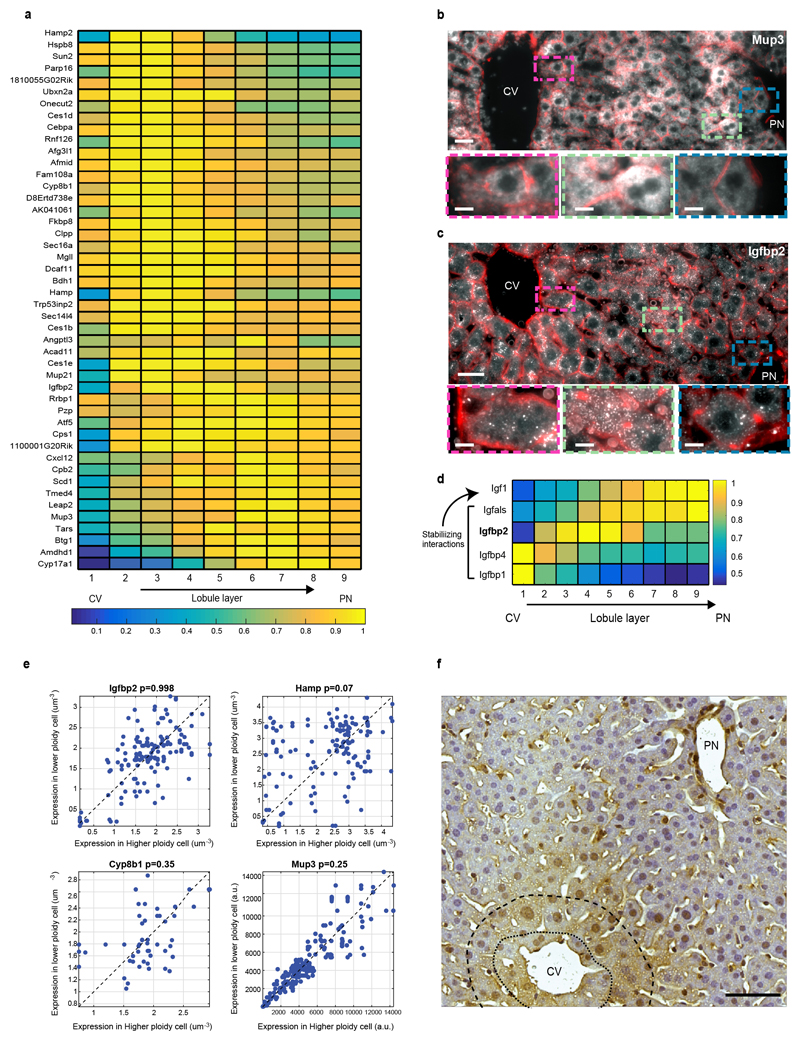
All liver zonation profiles previously described were monotonically increasing or decreasing porto-centrally. Our high spatial resolution enabled identification of a new class of non-monotonic zonation profiles that peak at intermediate lobule layers (Fig. 3c, Fig. 4a Extended Data Figs. 5,10). While there was no significant GO annotation associated with these genes, they included key liver genes such as Hamp and Hamp2 that encode hepcidin, a secreted liver hormone regulating systemic iron levels (Fig. 4a). Additional non-monotonic genes included Igfbp2, Mup3 and Cyp8b1 (Fig. 3c, Extended Data Figs. 5, 10). The non-monotonic expression of these genes could not be explained by the previously identified non-monotonic pattern of liver polyploidy25 (Extended Data Fig. 10e, Methods).
Fig. 4. Non-monotonic zonation and sequential order.
(a) Hamp, encoding the hormone hepcidin peaks in mid-lobule layers. Scale bar–20µm. CV–central vein, PN–portal node. Insets mark periportal (blue), mid-lobule (green) and pericentral (magenta) layers, inset scale bars–8µm. Micrograph representative of 12 lobules from three mice. (b) Spatial order of enzymes matches their position in the classic bile-acid biosynthesis cascade. Cyp7a1 and Hsd3b7 peak at layer 1, Cyp8b1 peaks at layers 2-3. Patches are s.e.m., based on 1,000 bootstrap iterations (Supplementary information). (c) Cyp8b1 peaks in layer 2. Dashed line-pericentral layer. Scale bars–20µm, inset scale bar-5µm. Micrographs are representative of 12 lobules and three mice.
Both Igfbp2 and Cyp8b1, peaking at the mid-lobule layers, participate in pathways that consist of sequential genes, which we found to be expressed in sequential lobule coordinates. Igf1 is an abundant circulating growth factor with multiple roles in regulating organismal physiology26. The secreted binding proteins Igfbp stabilize Igf1 and limit its binding to Igf receptors26. We found Igf1 to be highly expressed in the periportal layers and its binding proteins Igfbp2 and Igfbp1 expressed in the mid-lobule and pericentral layers respectively (Extended Data Figs. 5,10c,d). This spatial order may expose a feedback wherein Igfbp production matches the levels of upstream-secreted Igf, or could be related to other non-endocrine functions of Igfbp.
Liver bile acids are produced in pericentral hepatocytes from cholesterol, consequently flowing through bile canaliculi towards the draining bile duct5. The neutral pathway of bile acid biosynthesis27, consisting of the core sequence Cyp7a1->Hsd3b7->Cyp8b1->Cyp27a1, exhibited a spatial order that matched the position in the enzymatic cascade (Fig. 4b, c). While Cyp7a1 and Hsd3b7 were most abundant in the pericentral layer 1, the next enzyme – Cyp8b1 peaked in layers 2-3 (Fig. 4b,c, Extended Data Fig. 10f). Baat, the gene encoding bile acid-CoA:amino acid N-acyltransferase, the enzyme that conjugates bile acids prior to their secretion, was also depleted in layer 1 (Fig. 4b). The lower levels of Cyp8b1 in layer 1 compared to layer 2 may potentially indicate that intermediates are transferred between layers 1 and 2. Alternatively it could suggest that Cyp7a1 and Hsd3b7 harbor additional functions in layer 1 or that Cyp8b1 harbors additional functions in layer 2. Using the database of KEGG metabolic networks we identified additional zonated liver enzyme pairs that are significantly spatially discordant and either operate on the same substrate, produce the same product, or act sequentially such that the product of one enzyme is the substrate of the other (Table S6). This constitutes a resource for further exploration of liver division of labor.
Our study challenges the traditional binary classification of liver into periportal and pericentral hepatocytes and reveals multiple roles for the intermediate lobule coordinates. The broad spatial heterogeneity revealed here may represent an optimal balance between the diverse liver tasks28. Our work provides the resource to explore the design principles governing this global spatial division of labor. The detailed spatial information of liver gene expression presented here can serve as an important tier in efforts to achieve comprehensive tissue-level metabolic reconstructions29.
Liver gene expression is highly dynamic, with multiple genes showing circadian and metabolic variations30. While our study focused on zonation profiles of fasted mice, similar reconstructions will decipher the dynamics of liver zonation profiles along these temporal axes. Another natural extension is the analysis of liver pathologies. Reconstruction of liver zonation profiles in response to liver intoxication will expose the plasticity of zonation and the extent to which different layers compensate for the functional loss of other layers. Our approach for combining smFISH and scRNAseq can be readily applied to extract spatial blueprints of other structured mammalian organs in diverse physiological and pathological states.
Methods
Mice and tissues
All animal studies were approved by the Institutional Animal Care and Use Committee of WIS. C57bl6 male mice age 2 month were housed under reverse phase cycle, and fasted for 5 hours starting at 7AM. All mice were anesthetized with an intraperitoneal injection of a ketamine (100 mg/kg) and xylazine (10 mg/kg) mixture. For smFISH, liver tissues were harvested and fixed in 4% paraformaldehyde for 3 hours; incubated overnight with 30% sucrose in 4% paraformaldehyde and then embedded in OCT. 7 µm cryosections were used for hybridization. Mouse liver cells for RNAseq were extracted from four mice and each smFISH result was based on at least 2 mice. Our study did not include randomization or blinding.
Hybridization and imaging
Probe library constructions, hybridization procedures and imaging conditions were previously described7,31,32. All smFISH probe libraries (Table S8), with the exception of Glutamine Synthetase (Glul), were coupled to Cy5. To detect cell borders alexa fluor 488 conjugated phalloidin (Rhenium A12379) was added to the GLOX buffer wash32. Portal node was identified morphologically on DAPI images based on bile ductile, central vein was identified using smFISH for Glul in TMR, included in all hybridizations. For zonation profiles, images were taken as scans spanning the portal node to the central vein. To compute single cell mRNA concentration of our landmark genes we used imageM32 to detect dots, extracted the sum of all dot intensities of the smFISH signal for each segmented cell within the first 3μm of the Z-stack, and divided by the segmented cell volume to obtain the intensity concentration per cell. Since the landmark genes were highly abundant, dots often coalesced, leading to underestimates of the true cellular gene expression when counting dots, whereas the sum of dot intensities was found to better capture the full dynamic range33. The gene expression distributions of the landmark genes were based on at least 800 cells from at least 10 lobules and 2 mice per gene. To validate the predicted zonation we imaged 20 additional genes on at least 10 lobules and 2 mice per gene (Extended Data Fig. 5b). Profiles for Igfbp1, Cyp27a1, Glud1, Cyp8b1, Igfbp2, Pck1, Cps1, Arg1, G6pc, Uox, Igf1, Pigr and Acly were generated by counting dots and dividing the number of dots in radial layers spanning the porto-central axis by the layer volume. Profiles for Cyp1a2, Rnase4, Gsta3, Ugt1a1, Hamp, Mup3 and Apoa1 were generated by quantifying the average background-subtracted intensity of the smFISH images at sequential lobule layers.
Hepatocytes isolation
Mouse hepatocytes were isolated by a modification of the two-step collagenase perfusion method of Seglen34 from 5 hours fasted, 2 months old male C57bl6 mice. Single cells were isolated from four mice. Digestion step was performed with Liberase Blendzyme 3 recombinant collagenase (Roche Diagnostics) according to the manufacturer’s instruction. Isolated hepatocytes were taken directly to sorting.
Single-cell sorting
Cells were sorted with SORP-FACSAriaII machine using a 130 μm nozzle. Dead cells were excluded on the basis of 5 μg/ml propidium iodide (Invitrogen) incorporation. Cells adhering to each other (i.e., doublets) were eliminated on the basis of pulse width. We used a 25,000-250,000 FSC-A gate. For three of the mice a #1.5 ND filter and was used to enrich for hepatocytes, whereas for the fourth mouse a #1 ND filter was used to enrich for non-parenchymal cells. Hepatocytes were sorted into 384-well cell capture plates containing 2 μl of lysis solution and barcoded poly(T) reverse-transcription (RT) primers for single-cell RNA-seq17. Barcoded single cell capture plates were prepared with a Bravo automated liquid handling platform (Agilent) as described previously17. Four empty wells were kept in each 384-well plate as a no-cell control during data analysis. Immediately after sorting, each plate was spun down to ensure cell immersion into the lysis solution, snap frozen on dry ice and stored at -80°C until processed.
Massively Parallel Single Cell RNA-Seq (MARS-Seq) library preparation
Single cell libraries were prepared, as described in Jaitin et. al.17. Briefly, mRNA from cells sorted into MARS-seq capture plates were barcoded and converted into cDNA and pooled using an automated pipeline. The pooled sample was then linearly amplified by T7 in vitro transcription and the resulting RNA was fragmented and converted into sequencing ready library by tagging the samples with pool barcodes and Illumina sequences during ligation, reverse transcription and PCR. Each pool of cells was tested for library quality and concentration was assessed as described in Jaitin et. al.17. Mapping of single-cell reads to mouse reference genome (mm9) was done using HISAT version 0.1.635 and reads with multiple mapping positions were excluded. Reads were associated with genes if they were mapped to an exon defined by a reference set obtained from the UCSC genome browser. Exons of different genes that share genomic position on the same strand were considered as a single gene with concatenated gene symbol. Corrected read counts were evaluated based on unique molecular identifiers (UMI) as described in Jaitin et. al.17.
Immunohistochemistry
Formalin-fixed and paraffin-embedded livers were sectioned (5μm), deparaffinized, rehydrated and permeabilized in 0.3% hydrogen peroxide in PBS for 20min at RT. Antigen retrieval was carried out by boiling in citrate buffer (pH=6) for 10min in a pressure cooker. Sections were blocked with normal goat serum (normal goat serum Vector labs, S-100) and incubated for 1h at RT with anti-Cyp8b1 (Santa Cruz, sc-23515, diluted 1:50 in PBS). Detection was performed by incubation with a peroxidase-conjugated anti-rabbit antibody (Zytomed Systems, ZUC032) using DAB as chromogen.
Statistical analysis
P-values for comparison of porto-central bias of different groups (Wnt+ and Wnt-, Ras+ and Ras- and hypoxia-induced and repressed) were obtained by Wilcoxon rank-sum tests on the porto-central bias of all genes, defined as the difference between the zonation profile values in layers 1 and 9 divided by the mean over all layers. The concise set of non-monotonic genes (Extended Data Fig. 10a) were defined as genes with Kruaskal-Wallis q<0.01, and zonation peak between layers 3 and 7 which is 10% higher than the maximal expression value between layers 1 and 9. For GO annotation enrichment of the non-monotonically zonated genes we used GOrilla36.
To assess the effect of the number of landmark genes on the reconstruction error we ran our probabilistic algorithm to predict the zonation patterns using each possible subset of our landmark genes (a total of 26-1=63 combinations). We then calculated the reconstruction accuracy defined as one minus the mean of sum-squared differences between the profiles predicted using a specific subset and the profiles obtained when using the entire panel of landmark genes. In addition, we calculated in a similar manner, the accuracy of predicting uniform expression of all genes throughout the lobule (without any landmark gene, Extended Data Fig. 4). For every set of gene combinations of the same size, we plotted the median accuracy of the set.
To evaluate which features of landmark genes affect their contribution to the spatial reconstruction we computed the extent of zonation of each gene as the log2-based entropy of its smFISH-measured zonation profile. High entropy denotes genes that are uniformly expressed throughout the lobule axis and thus carry little spatial information. In addition, we measured the mean coefficient of variation (CV) of all cells belonging to each layer and averaged over all layers to obtain a measure of intra-layer cell-to-cell variability. We assigned a score for each landmark gene as the average of the ratios in reconstruction error among all pairs of combinations that did not include the gene and those that did. High scores indicate that the landmark gene strongly improves reconstruction when added to combinations of other landmark genes (Extended Data Fig. 4).
To identify potential ploidy-specific regulation of the non-monotonically zonated genes we segmented individual hepatocytes and classified them in-situ according to nuclear sizes and number of nuclei per cell following the method of Tanami et al.25. We next compared the expression of each 8n or 4n hepatocyte with an adjacent hepatocyte of lower ploidy, residing within 30µm of the cell’s center. We used Wilcoxon signed-rank test to obtain p-values for these comparisons (Extended Data Fig. 10e).
Liver secretome (Extended Data Fig. 9b) was based on Zhang et. al.37. To identify spatial division of labor within specific pathways we examined the 62 mouse metabolic pathway maps from KEGG database38. We extracted from each pathway map pairs of enzymes that have either a shared substrate, a shared product, or pairs in which a product of one enzyme is the substrate of the second enzyme. Upon obtaining all pairs we further selected those in which both enzymes are expressed in the liver (mean expression higher than 5*10-6 UMI/cell) and are significantly zonated (Kruskal-Wallis q<0.2). For each such pair we assigned a score that reflects the spatial discordance in the zonation profiles of the both enzymes:
Where Ei is the mean-normalized zonation profile of enzyme i and xi is the layer at which Ei peaks. Negative scores indicate that the two enzymes peak at different layers, and the quantity of the score reflects the expression differences between the two layers. An interaction between two enzymes that peak at the same layer has a score of zero. In addition, for every triplet of connected enzymes E1 → E2 → E3 we also included the indirect pair E1 → E3. To produce a concise set of significantly zonated spatially-discordant enzyme pairs we randomly drew 100,000 pairs of enzymes among all expressed liver enzymes (731 genes) and recomputed their scores. For our concise set we selected pairs with a score lower than the 10 percentile score among the randomized set of pairs (-0.14, Table S6). While the direction of flow of metabolites is hard to systematically determine for these pathways (pericentral direction via blood vs. periportal direction via bile ductiles), this database serves as a resource for future focused exploration of liver spatial division of labor of individual pathways.
Algorithm for spatial reconstruction of zonation profiles
The algorithm for spatial reconstruction of zonation profiles is described in detail in the Supplementary information. Matlab code used for the inference is available upon request.
Data availability
Data generated during this study have been deposited in Gene Expression Omnibus with the accession code: https://www.ncbi.nlm.nih.gov/geo/query/acc.cgi?acc=GSE84498. Data referenced in Figure 3d are available on request from the authors. Data referenced in Figure 3e and Extended Data Figure 8a-b are available in DOI: http://dx.doi.org/10.1152/physiolgenomics.00075.2009 (Table S1). Data referenced in Figure 3f and Extended Data Figures 8c-d are available in DOI: http://dx.doi.org/10.1002/ijc.28798 (Table S4b). Data referenced in Figure 3g and Extended Data Figures 8e-f are available in GEO with the accession code: https://www.ncbi.nlm.nih.gov/geo/query/acc.cgi?acc=GSE3129. Data referenced in Extended Data Figure 7a available on request from the authors. Data referenced in Extended Data Figure 7b are available in GEO with the accession code: http://www.ncbi.nlm.nih.gov/geo/query/acc.cgi?acc=GSE49707. Data referenced in Extended Data Figures 7c-d are available in GEO with the accession code: https://www.ncbi.nlm.nih.gov/geo/query/acc.cgi?acc=GSE68806. Data referenced in Extended Data Figure 9b are available in Table 6 in DOI: http://dx.doi.org/10.1021/pr901057k.
Extended Data
Extended Data Figure 1. Low magnification images of the six landmark genes.
smFISH examples of our 6 landmark genes - the pericentral genes Glul and Cyp2e1 and the periportal genes Ass1, Asl, Alb and Cyp2f2. Bright cells have high mRNA content. Scale bar-100μm. CV-central vein, PN-portal node. Micrographs are representative of at least 10 lobules and at least two mice per gene.
Extended Data Figure 2. Single cell RNAseq reveals three distinct liver cell populations.
(a-c) t-SNE plots. Each dot is a cell colored according to the aggregated expression of (a) the hepatocyte marker genes Apoa1, Glul, Acly, Asl, Cyp2e1, Cyp2f2, Ass1, Alb, Mup3, Pck1, G6pc, (b) the Kupffer cell marker genes Irf7, Spic, Clec4f and (c) the endothelial cell markers Ushbp1, Myf6, Oit3, Il1a, F8, Bmp2, C1qtnf1, Mmrn2, Pcdh12, Dpp4. (d) smFISH of a liver lobule demonstrating the antagonistic expression of Glul (red dots), and Ass1 (green dots). Scale bar-20μm. Inset of highlighted area demonstrates the minimal co-expression of these two genes. Scale bar-5μm. Blue is dapi-stained nuclei. CV – central vein, PN – portal node. Micrographs are representative of at least 10 lobules and at least two mice per gene. (e) Ass1 and Glul are mutually exclusive in the single cell RNAseq data. Each dot is a cell, X-axis is the expression of Glul in fraction of total cellular UMI, Y-axis is the expression of Ass1.
Extended Data Figure 3. Prior and posterior probability computation of the scRNAseq data.
(a-b) Zone-dependent probabilities of observing different expression levels for each of the six landmark genes. Horizontal lines denote the UMI observed for each gene for cell 609 (a) and cell 629 (b). The posterior probabilities for each layer suggest that cell 609 most probably originated from the periportal layer 8, whereas cell 629 originated from the pericentral layer 1. Note that the posterior probabilities incorporate the lower sampling of cell 609, which had a total of 3,358 UMI, compared to cell 629, which had 9,913 UMI. (c-d) Prior probability of observing a hepatocyte from each of the 9 layers. (c) Hexagonal lobule geometry and 9 concentric circles at constant radii increments spanning the central vein and portal node. (d) Area of each layer is the intersection with the hexagon.
Extended Data Figure 4. Sensitivity of reconstruction to number and features of landmark genes.
(a) Zonation properties of our landmark genes. –log10 of the Wilcoxon rank-sum p-values for the comparison of smFISH expression measurements in cells in sequential lobule layers for each of the 6 landmark genes. Stars denote layer pairs with significant changes in expression (p-value<0.05). (b) Mean reconstruction accuracy for different subsets of landmark genes (defined as 1 minus the mean of the sum-squared differences between the profiles predicted using each subset and the profiles obtained when using the entire panel of landmark genes). Dot color represents the number of landmark genes in each subset. (c) Reconstruction accuracy approaches saturation when using 6 landmark genes. G – Glul, Cf- Cyp2f2, Ce – Cyp2e1, As – Ass1, Al – Asl, Ab - Alb. Dotted line connects the most accurate partial subset of landmark genes for each panel size. (d) The contribution of each landmark gene to zonation reconstruction is strongly dependent on its spatial non-uniformity among different layers but less on its intra-layer variability. X-axis shows the entropy of the summed-normalized average profile of each landmark gene. Y-axis shows the average among all layers of the coefficient of variation of the intra-layer expression levels. The score for each gene is the average of the ratio in reconstruction error with and without the gene among all combinations that include the gene. High scores indicate that the landmark gene strongly improves reconstruction when added to combinations of other landmark genes.
Extended Data Figure 5. Validation of reconstructed zonation profiles using smFISH.
(a) Reconstructed zonation profiles based on the scRNAseq data (blue) and smFISH measurements (red) for our landmark genes. (b) Validation of reconstructed profiles for 20 genes not used for the inference algorithm. Profiles are normalized by the mean, patches show s.e.m. Note that Pck1 has a broader profile compared to other studies3, since our measurements were done on fasted mice, a metabolic state in which gluconeogenesis becomes substantial in pericentral layers.
Extended Data Figure 6. Reconstructed zonation profiles capture a wide dynamic range.
Reconstructed zonation profiles of the pericentral gene Oat (magenta) and the pericentral progenitor marker Axin2 (red), and the periportal urea cycle enzyme gene Arg1 (green) and the periportal progenitor marker Sox9 (blue). Dashed box highlights a blow-up of Axin2 and Sox9, genes with 100-fold lower expression than Oat and Arg1. Expression values are the estimated fraction of the total cellular mRNA molecules. Lobule layers are numbered from the central vein (CV, layer 1) to the portal node (PN, layer 9). The slightly broader zonation profile of Sox9 mRNA compared to the Sox9 signal observed in18 using Sox9-GFP or Sox9-CreERT;R26RtdTomato may stem from differences in the dynamic range of the detection methods or from differences in the mouse metabolic states (fasted vs. ad-libitum).
Extended Data Figure 7. Porto-central ratio of reconstructed zonation profiles correlates with previous studies.
(a) Correlation between the pericentral bias computed from our data and the one from Braeuning et al.9. Y axis is our pericentral bias (PC/PP), computed as the ratio between the median zonation profiles in layers 1-4 and the median in layers 6-9. X-axis is the ratio between expression in pericentrally and periportally enriched genes from9. 79 of the 88 genes considered pericentral according to Braeuning et al. (red circles) are also pericentrally biased in our dataset (hypergeometric p<4E-9). 70 of the 81 genes considered periportal according to Braeuning et al. (green circles) are also periportally biased in our dataset (hypergeomtric p<1E-16). Black squares mark genes that we found to be significantly zonated. (b) Pericentral bias computed by our method correlates with previous bulk RNAseq studies that compared pericentral and periportal populations isolated via laser capture microdissection10. RSpearman=0.74, p<E-80. Black dots represent genes considered significantly zonated Data in10. (a-b) include genes with average expression across cells which is higher than 5E-6 of the total UMI counts. (c) Reconstructed zonation profiles for the genes found in Wang et al.2 to have higher expression in Axin2+ pericentral hepatocytes (qval<0.2). (d) Reconstructed zonation profiles for the genes found in Wang et al. to have lower expression in pericentral Axin2+ hepatocytes (qval<0.2).
Extended Data Figure 8. Zonation profiles of genes that significantly increased or decreased when perturbing signaling pathways.
(a-b) Zonation profiles of liver genes previously shown to increase (a) or decrease (b) in liver of mice exposed to chronic hypoxia (PO2 =11.5kPa, compared to PO2 =18.0kPa.20). (c-d) Zonation profiles of genes shown to significantly increase (c), log-fold>2) or decrease (d), log fold<-2) in expression in liver tumors harboring an activating Ha-ras mutation22 (FDR-corrected p-value<0.05). (e-f) Zonation profiles of genes that have higher (e, fold>1) or lower (f, fold<1)expression in hypopituitary mice23 (FDR-corrected p-value<0.05).
Extended Data Figure 9. KEGG pathways enriched for zonated genes.
(a) Average max-normalized zonation profiles of KEGG pathways enriched for zonated genes. Panel displays all pathways with more than 10 genes and hypergeometric q-value<0.1 (Table S5 exhibits full results). Each profile was normalized by its maximum along all layers. (b) Periportal bias of liver secreted proteins. Genes are based on an annotated liver secretome37. (c) Pericentral bias for liver detoxification genes. Shown are genes for cytochrome P450, Uridine 5'-diphospho-glucuronosyltransferase and glutathione S transferase. Images in (b-c) include significantly zonated genes from each pathway (Kruskal-Wallis qval<0.01 and more than 5*10-5 of the total cellular UMIs on average in at least one of the 9 layers), each profile normalized to maximum of 1.
Extended Data Figure 10. Non-monotonic zonation profiles of liver genes.
(a) Max-normalized zonation profiles of the concise set of 46 non-monotonic genes (Methods). (b) Mup3 is highly variable but exhibits a peak at layer 7 and a decreased expression in both the pericentral layer 1 and periportal layer 9. (c) Igfbp2 exhibits a non-monotonic zonation profile, peaking at layers 3-6. Scale bar-20µm. CV – central vein. Enlarged rectangles in (b-c) mark the periportal layers (blue), mid-lobule layers (green) and pericentral layers (magenta). Scale bar-8µm. Micrographs are representative of at least 10 lobules and at least two mice per gene. (d) Igfbp2, Igfbp1 and Igfbp4 are downstream to Igf1, the secreted protein that they bind and stabilize. (e) Non-monotonic zonation profiles observed do not stem from ploidy-specific regulation. Each dot represents a pair of adjacent cells (within 30µm of each other), x-axis is the higher ploidy cell, y-axis is the lower ploidy cell. Pvalues are Wilcoxon sign-ranked tests. Gene expression for Igfbp2, Hamp, and Cyp8b1 was quantified as the number of smFISH dots divided by the segmented cell volumes; Mup3 expression was quantified as the average intensity, due to its higher abundance. Quantification for each gene based on at least 60 pairs. (f) Immunohistochemistry of Cyp8b1 demonstrates higher protein concentration in layers 2-3 (dashed curve) compared to layer 1 (dotted curve). Scale bar-50μm. Micrographs are representative of 7 lobules in 2 mice.
Supplementary Material
Supplementary Information is linked to the online version of the paper at www.nature.com/nature.
Acknowledgements
We thank Ron Milo and all members of our lab for valuable comments. We thank Michael Schwarz, Albert Braeuning and Sabine Colnot for sharing their data and Ayala Sharp, Eitan Ariel, Efrat Hagai and Zohar Gavish for help with experimental procedures. I.A. is supported by the European Research Council (309788), and the Israel Science Foundation, the Ernest and Bonnie Beutler Research Program of Excellence in Genomic Medicine and the Helen and Martin Kimmel award for innovative investigation. I.A. is the incumbent of the Alan and Laraine Fischer Career Development Chair. S.I. is supported by the Henry Chanoch Krenter Institute for Biomedical Imaging and Genomics, The Leir Charitable Foundations, Richard Jakubskind Laboratory of Systems Biology, Cymerman-Jakubskind Prize, The Lord Sieff of Brimpton Memorial Fund, the I-CORE program of the Planning and Budgeting Committee and the Israel Science Foundation (grants 1902/ 12 and 1796/12), the Israel Science Foundation grant No. 1486/16, the EMBO Young Investigator Program and the European Research Council under the European Union’s Seventh Framework Programme (FP7/2007-2013)/ERC grant agreement number 335122. S.I. is the incumbent of the Philip Harris and Gerald Ronson Career Development Chair.
Footnotes
Author Contribution
K.B.H., B.T., M.G., S.L., E.E.M., S.B., A.S.A. performed single molecule FISH experiments. K.B.H., B.T., and O.M. performed the single cell isolation and FACS sorting, O.M. performed the experimental single cell RNAseq procedures, A.G. and E.D. implemented the single cell RNAseq computational protocols, R.S. and S.I. developed and implemented the spatial inference algorithms, R.S., D.L. and S.I. performed data analysis, A.E.M. and A.B. performed the Cyp8b1 validation experiments, I.A. and S.I. supervised the study. S.I. wrote the paper. All authors discussed the results and commented on the manuscript. K.B.H. and R.S. contributed equally to the study.
The authors declare no competing interests.
Author Information
Reprints and permissions information is available at www.nature.com/reprints.
References
- 1.Hoehme S, et al. Prediction and validation of cell alignment along microvessels as order principle to restore tissue architecture in liver regeneration. Proc Natl Acad Sci. 2010 doi: 10.1073/pnas.0909374107. [DOI] [PMC free article] [PubMed] [Google Scholar]
- 2.Wang B, Zhao L, Fish M, Logan CY, Nusse R. Self-renewing diploid Axin2(+) cells fuel homeostatic renewal of the liver. Nature. 2015;524:180–185. doi: 10.1038/nature14863. [DOI] [PMC free article] [PubMed] [Google Scholar]
- 3.Benhamouche S, et al. Apc Tumor Suppressor Gene Is the ‘Zonation-Keeper’ of Mouse Liver. Dev Cell. 2006;10:759–770. doi: 10.1016/j.devcel.2006.03.015. [DOI] [PubMed] [Google Scholar]
- 4.Colnot S, Perret C. In: Molecular Pathology of Liver Diseases. Monga SPS, editor. Springer; US: 2011. pp. 7–16. [Google Scholar]
- 5.Gebhardt R. Metabolic zonation of the liver: regulation and implications for liver function. Pharmacol Ther. 1992;53:275–354. doi: 10.1016/0163-7258(92)90055-5. [DOI] [PubMed] [Google Scholar]
- 6.Jungermann K, Keitzmann T. Zonation of Parenchymal and Nonparenchymal Metabolism in Liver. Annu Rev Nutr. 1996;16:179–203. doi: 10.1146/annurev.nu.16.070196.001143. [DOI] [PubMed] [Google Scholar]
- 7.Bahar Halpern K, et al. Bursty gene expression in the intact Mammalian liver. Mol Cell. 2015;58:147–156. doi: 10.1016/j.molcel.2015.01.027. [DOI] [PMC free article] [PubMed] [Google Scholar]
- 8.Gebhardt R, Matz-Soja M. Liver zonation: Novel aspects of its regulation and its impact on homeostasis. World J Gastroenterol. 2014;20:8491–8504. doi: 10.3748/wjg.v20.i26.8491. [DOI] [PMC free article] [PubMed] [Google Scholar]
- 9.Braeuning A, et al. Differential gene expression in periportal and perivenous mouse hepatocytes. FEBS J. 2006;273:5051–5061. doi: 10.1111/j.1742-4658.2006.05503.x. [DOI] [PubMed] [Google Scholar]
- 10.Saito K, Negishi M, James Squires E. Sexual dimorphisms in zonal gene expression in mouse liver. Biochem Biophys Res Commun. 2013;436:730–735. doi: 10.1016/j.bbrc.2013.06.025. [DOI] [PubMed] [Google Scholar]
- 11.Hashimshony T, Wagner F, Sher N, Yanai I. CEL-Seq: Single-Cell RNA-Seq by Multiplexed Linear Amplification. Cell Rep. 2012;2:666–673. doi: 10.1016/j.celrep.2012.08.003. [DOI] [PubMed] [Google Scholar]
- 12.Wu AR, et al. Quantitative assessment of single-cell RNA-sequencing methods. Nat Methods. 2014;11:41–46. doi: 10.1038/nmeth.2694. [DOI] [PMC free article] [PubMed] [Google Scholar]
- 13.Zeisel A, et al. Cell types in the mouse cortex and hippocampus revealed by single-cell RNA-seq. Science. 2015;347:1138–1142. doi: 10.1126/science.aaa1934. [DOI] [PubMed] [Google Scholar]
- 14.Grün D, et al. Single-cell messenger RNA sequencing reveals rare intestinal cell types. Nature. 2015;525:251–255. doi: 10.1038/nature14966. [DOI] [PubMed] [Google Scholar]
- 15.Satija R, Farrell JA, Gennert D, Schier AF, Regev A. Spatial reconstruction of single-cell gene expression data. Nat Biotechnol. 2015;33:495–502. doi: 10.1038/nbt.3192. [DOI] [PMC free article] [PubMed] [Google Scholar]
- 16.Achim K, et al. High-throughput spatial mapping of single-cell RNA-seq data to tissue of origin. Nat Biotechnol. 2015;33:503–509. doi: 10.1038/nbt.3209. [DOI] [PubMed] [Google Scholar]
- 17.Jaitin DA, et al. Massively Parallel Single-Cell RNA-Seq for Marker-Free Decomposition of Tissues into Cell Types. Science. 2014;343:776–779. doi: 10.1126/science.1247651. [DOI] [PMC free article] [PubMed] [Google Scholar]
- 18.Font-Burgada J, et al. Hybrid Periportal Hepatocytes Regenerate the Injured Liver without Giving Rise to Cancer. Cell. 2015;162:766–779. doi: 10.1016/j.cell.2015.07.026. [DOI] [PMC free article] [PubMed] [Google Scholar]
- 19.Gougelet A, et al. T-cell factor 4 and β-catenin chromatin occupancies pattern zonal liver metabolism in mice. Hepatology. 2014;59:2344–2357. doi: 10.1002/hep.26924. [DOI] [PubMed] [Google Scholar]
- 20.Baze MM, Schlauch K, Hayes JP. Gene expression of the liver in response to chronic hypoxia. Physiol Genomics. 2010;41:275–288. doi: 10.1152/physiolgenomics.00075.2009. [DOI] [PMC free article] [PubMed] [Google Scholar]
- 21.Hailfinger S, Jaworski M, Braeuning A, Buchmann A, Schwarz M. Zonal gene expression in murine liver: Lessons from tumors. Hepatology. 2006;43:407–414. doi: 10.1002/hep.21082. [DOI] [PubMed] [Google Scholar]
- 22.Unterberger EB, et al. Ha-ras and β-catenin oncoproteins orchestrate metabolic programs in mouse liver tumors. Int J Cancer. 2014;135:1574–1585. doi: 10.1002/ijc.28798. [DOI] [PubMed] [Google Scholar]
- 23.Boylston WH, et al. Identification of longevity-associated genes in long-lived Snell and Ames dwarf mice. Age. 2006;28:125–144. doi: 10.1007/s11357-006-9008-6. [DOI] [PMC free article] [PubMed] [Google Scholar]
- 24.Rolfe DF, Brown GC. Cellular energy utilization and molecular origin of standard metabolic rate in mammals. Physiol Rev. 1997;77:731–758. doi: 10.1152/physrev.1997.77.3.731. [DOI] [PubMed] [Google Scholar]
- 25.Tanami S, et al. Dynamic zonation of liver polyploidy. Cell Tissue Res. 2016 doi: 10.1007/s00441-016-2427-5. [DOI] [PubMed] [Google Scholar]
- 26.Baxter RC. IGF binding proteins in cancer: mechanistic and clinical insights. Nat Rev Cancer. 2014;14:329–341. doi: 10.1038/nrc3720. [DOI] [PubMed] [Google Scholar]
- 27.de Aguiar Vallim TQ, Tarling EJ, Edwards PA. Pleiotropic roles of bile acids in metabolism. Cell Metab. 2013;17:657–669. doi: 10.1016/j.cmet.2013.03.013. [DOI] [PMC free article] [PubMed] [Google Scholar]
- 28.Nagrath D, et al. Integrated Energy and Flux Balance Based Multiobjective Framework for Large-Scale Metabolic Networks. Ann Biomed Eng. 2007;35:863–885. doi: 10.1007/s10439-007-9283-0. [DOI] [PubMed] [Google Scholar]
- 29.Gille C, et al. HepatoNet1: a comprehensive metabolic reconstruction of the human hepatocyte for the analysis of liver physiology. Mol Syst Biol. 2010;6:411. doi: 10.1038/msb.2010.62. [DOI] [PMC free article] [PubMed] [Google Scholar]
- 30.Atger F, et al. Circadian and feeding rhythms differentially affect rhythmic mRNA transcription and translation in mouse liver. Proc Natl Acad Sci U S A. 2015;112:E6579–6588. doi: 10.1073/pnas.1515308112. [DOI] [PMC free article] [PubMed] [Google Scholar]
- 31.Itzkovitz S, et al. Single molecule transcript counting of stem cell markers in the mouse intestine. Nat Cell Biol. 2011;14:106–114. doi: 10.1038/ncb2384. [DOI] [PMC free article] [PubMed] [Google Scholar]
- 32.Lyubimova A, et al. Single-molecule mRNA detection and counting in mammalian tissue. Nat Protoc. 2013;8:1743–1758. doi: 10.1038/nprot.2013.109. [DOI] [PubMed] [Google Scholar]
- 33.Bahar Halpern K, et al. Nuclear retention of mRNA in mammalian tissues. Cell Reports. 2015;13:2653–2662. doi: 10.1016/j.celrep.2015.11.036. [DOI] [PMC free article] [PubMed] [Google Scholar]
- 34.Seglen PO. Preparation of rat liver cells. 3. Enzymatic requirements for tissue dispersion. Exp Cell Res. 1973;82:391–398. doi: 10.1016/0014-4827(73)90357-1. [DOI] [PubMed] [Google Scholar]
- 35.Kim D, Langmead B, Salzberg SL. HISAT: a fast spliced aligner with low memory requirements. Nat Methods. 2015;12:357–360. doi: 10.1038/nmeth.3317. [DOI] [PMC free article] [PubMed] [Google Scholar]
- 36.Eden E, Navon R, Steinfeld I, Lipson D, Yakhini Z. GOrilla: a tool for discovery and visualization of enriched GO terms in ranked gene lists. BMC Bioinformatics. 2009;10:48. doi: 10.1186/1471-2105-10-48. [DOI] [PMC free article] [PubMed] [Google Scholar]
- 37.Zhang Y, et al. Strategy for studying the liver secretome on the organ level. J Proteome Res. 2010;9:1894–1901. doi: 10.1021/pr901057k. [DOI] [PubMed] [Google Scholar]
- 38.Kanehisa M, Goto S. KEGG: Kyoto Encyclopedia of Genes and Genomes. Nucleic Acids Res. 2000;28:27–30. doi: 10.1093/nar/28.1.27. [DOI] [PMC free article] [PubMed] [Google Scholar]
Associated Data
This section collects any data citations, data availability statements, or supplementary materials included in this article.
Supplementary Materials
Data Availability Statement
Data generated during this study have been deposited in Gene Expression Omnibus with the accession code: https://www.ncbi.nlm.nih.gov/geo/query/acc.cgi?acc=GSE84498. Data referenced in Figure 3d are available on request from the authors. Data referenced in Figure 3e and Extended Data Figure 8a-b are available in DOI: http://dx.doi.org/10.1152/physiolgenomics.00075.2009 (Table S1). Data referenced in Figure 3f and Extended Data Figures 8c-d are available in DOI: http://dx.doi.org/10.1002/ijc.28798 (Table S4b). Data referenced in Figure 3g and Extended Data Figures 8e-f are available in GEO with the accession code: https://www.ncbi.nlm.nih.gov/geo/query/acc.cgi?acc=GSE3129. Data referenced in Extended Data Figure 7a available on request from the authors. Data referenced in Extended Data Figure 7b are available in GEO with the accession code: http://www.ncbi.nlm.nih.gov/geo/query/acc.cgi?acc=GSE49707. Data referenced in Extended Data Figures 7c-d are available in GEO with the accession code: https://www.ncbi.nlm.nih.gov/geo/query/acc.cgi?acc=GSE68806. Data referenced in Extended Data Figure 9b are available in Table 6 in DOI: http://dx.doi.org/10.1021/pr901057k.


