Abstract
A method for mapping of temperature over a large volume of the brain using volumetric proton MR spectroscopic imaging has been implemented and applied to 150 normal subjects. Magnetic susceptibility-induced frequency shifts in gray- and white-matter regions were measured and included as a correction in the temperature mapping calculation. Additional sources of magnetic susceptibility variations of the individual metabolite resonance frequencies were also observed that reflect the cellular-level organization of the brain metabolites, with the most notable differences being attributed to changes of the N-Acetylaspartate resonance frequency that reflect the intra-axonal distribution and orientation of the white-matter tracts with respect to the applied magnetic field. These metabolite-specific susceptibility effects are also shown to change with age. Results indicate no change of apparent brain temperature with age from 18 to 84 years old, with a trend for increased brain temperature throughout the cerebrum in females relative for males on the order of 0.1°C; slightly increased temperatures in the left hemisphere relative to the right; and a lower temperature of 0.3°C in the cerebellum relative to that of cerebral white-matter. This study presents a novel acquisition method for noninvasive measurement of brain temperature that is of potential value for diagnostic purposes and treatment monitoring, while also demonstrating limitations of the measurement due to the confounding effects of tissue susceptibility variations.
Keywords: Brain temperature, Tissue susceptibility, MR spectroscopic imaging, Aging, Gender
Graphical abstract
Introduction
The temperature of the brain reflects cerebral metabolism and physiology and its non-invasive measurement may be of value as a marker of disease and for monitoring of hyperthermia or hypothermia treatments. However, little is known about normal brain temperature distributions and changes with disease due to the difficulties of performing in vivo brain temperature measurements in human subjects. Several studies have reported on the use of proton MR spectroscopy for temperature measurement, which is based on the temperature dependence of the water resonance frequency of approximately 0.01 ppm/°C. It has also been shown that for studies of the brain the signal from N-acetylaspartate (NAA) provides a convenient frequency reference (Cady et al., 1995; Corbett et al., 1995) and additionally that combining this with frequency measurements from the creatine (Cre) and choline (Cho) resonances may provide greater reproducibility (Cady et al., 2010).
Previous MRS measurements of brain temperature in human subjects have used single-voxel or volume-selected two-dimensional spectroscopic imaging (SI) acquisitions (Cady et al., 2010; Childs et al., 2007; Corbett et al., 1997; Covaciu et al., 2010; Karaszewski et al., 2006), with the result that only a small fraction of the brain volume, which does not include cortical surface regions, has been sampled. In this report a volumetric “whole-brain” SI sequence has been used that samples a much larger brain volume. An additional limitation of previous MRS temperature measurement studies is that the effect of tissue-specific differences in the water resonance frequency were not taken into account. These are known to be caused by differences in magnetic susceptibility, with additional contributions from proton exchange, and result in differences of the water resonance frequency in gray-matter (GM) and white-matter (WM) tissues (Duyn et al., 2007; He and Yablonskiy, 2009). He and Yablonskiy have demonstrated that susceptibility-induced shifts of the water resonance depend on cellular and subcellular organization and it has been proposed by Chadzynski et al. (Chadzynski et al., 2011) that shifts of metabolite resonance frequencies occur that similarly depend on the subcellular compartmentalization of each metabolite. With a reported difference in the water-NAA resonance frequency separation of 14 ppb (Chadzynski et al., 2011) this could result in an error in the temperature measurement of up to 1.4°C. Correction for this tissue composition effect becomes more important when mapping temperature over a larger brain volume; therefore, an additional aim of this study has been to confirm the previous measurements of metabolite-specific frequency shifts between GM and WM and to include this effect in the temperature calculation.
The water 1H resonance frequency is linearly dependent on temperature; however, the calibration of the slope and intercept of this temperature dependence has proven to be problematic. Several reports have published calibration values based on measurements in phantoms (Cady et al., 1995; Corbett et al., 1995; Covaciu et al., 2010), rat brain (Zhu et al., 2008) and piglet brain (Cady et al., 1995; Cady et al., 2010), however, with little agreement on the calibration values. It has been demonstrated that calibrations in solutions depend on protein and ionic content (Vescovo et al., 2013) and that the spectral fitting (Zhu et al., 2008) and data acquisition (Childs et al., 2007; Prakash et al., 2014) methods can affect the results. The in vivo calibration measurements will additionally be affected by the magnetic susceptibility of the sampled tissue region, which has previously not been taken into account. A related difficulty is validation of the measurements since the true temperature cannot be measured non-invasively in the brain of normal human subjects by any other method. Direct temperature measurements that have been done in the human brain during surgery indicate that temperature increases with depth and that the center is on average approximately 0.5°C above that of the rectal temperature (Hirashima et al., 1998; Mariak, 2002), and similar findings have been observed in animal studies (Wang et al., 2014; Zhu et al., 2006). However, more detailed information on the distribution of temperature within the brain and possible associations with factors such as age, gender and body weight remain unknown.
This study presents an analysis of volumetric 1H MRSI data obtained from normal adult subjects. By taking advantage of signal averaging following spatial normalization of multiple data sets, improved measurements of the average brain temperature in a group of subjects can be obtained. In addition, the effect of tissue-specific frequency shifts was evaluated and incorporated into an image-based temperature calculation. The spatial variation of brain temperature and associations with subject age, gender, and weight were then examined.
Methods
Subject Selection
MRI and MRSI studies of the brain in healthy subjects were obtained from an existing database of 150 studies, aged 18 to 84, with 90 female subjects. These studies were carried out under five research protocols, each of which was approved by the institutional human subjects research review committee and with informed consent obtained from all participants. Results using these normal control data have been previously published (Govind et al., 2010; Govind et al., 2012; Maudsley et al., 2009; Maudsley et al., 2010a; Sabati et al., 2015). Subjects were screened to exclude any history of brain disease or injury, substance abuse, or psychiatric condition. Eight elderly subjects were screened using neuropsychological test procedures and verified to be cognitively normal, whereas self-reporting procedures were used for all other subjects.
Data Acquisition Methods
Volumetric MRSI data were acquired at 3 Tesla (Siemens Trio) using a spin-echo acquisition with echo-planar readout, frequency-selective water suppression, lipid inversion nulling, and TE/TR/TI = 70/1710/198 ms. Details of the sequence have been previously provided (Ebel et al., 2001; Sabati et al., 2015). Data was sampled with 50×50×18 points over a field of view of 280×280×180 mm, for a nominal voxel volume of 0.313 cc, and with selection of a slab of 135 mm covering the cerebrum. Spectral sampling used 1000 sample points with 2500 Hz spectral width that was reduced to 500 points and 1250 Hz following resampling and combination of the odd and even echoes (Metzger and Hu, 1997). The MRSI acquisition included a second interleaved dataset that was obtained without water suppression and using 20° excitation and gradient-echo observation, and which provided a water reference signal with identical spatial and spectral parameters to the metabolite MRSI. Each study also included a T1-weighted MRI (MPRAGE, Magnetization Prepared Rapid Gradient Echo) at 1-mm isotropic resolution (TR/TE/TI=2150/4.4/1100 ms, flip angle 8°).
Data Processing
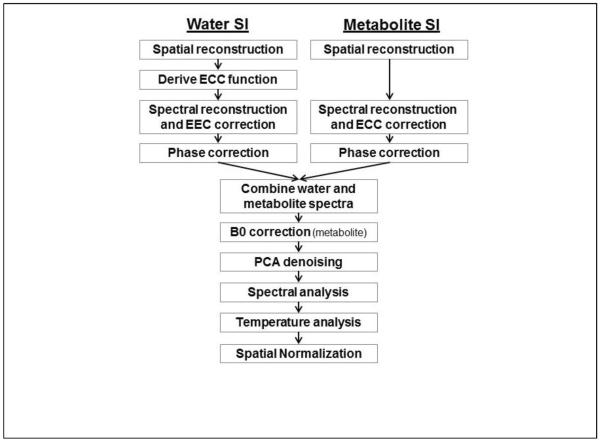
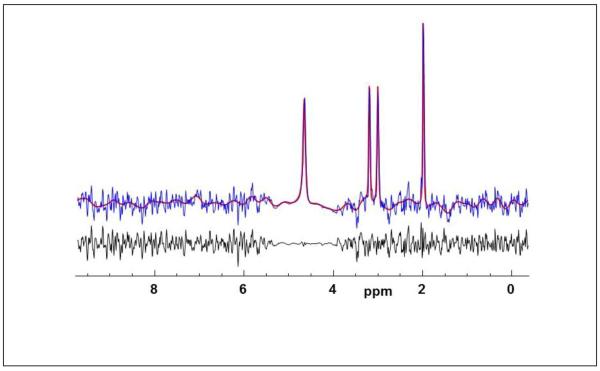
The metabolite and water-reference MRSI datasets were reconstructed using the MIDAS package (Maudsley et al., 2009; Sabati et al., 2015). The major steps of the processing pipeline that are relevant for mapping of resonance frequencies are illustrated in Figure 1. Spatial reconstruction included the same smoothing and interpolation to 64×64×32 points applied to both the metabolite SI (SIMet) and the water SI (SIH2O) datasets, resulting in a final spatial resolution of approximately 1 cc. Zerofilling to 1024 points was applied in the spectral domain prior to Fourier transformation, with no apodization applied. To enable analysis of both the water and metabolite frequencies while also accounting for spatially variant B0 inhomogeneity, the SIMet and SIH2O spectra were combined and a single spectral analysis carried out that included the water and metabolite signals. The two spectra were combined by splicing and scaling a region of 100 data points (122 Hz) centered at the water resonance into the corresponding location in the metabolite spectrum. The water resonance was scaled to be comparable in amplitude to the metabolite resonances, as shown in Figure 2. Because the spectral model used in the analysis program uses a common zero-order phase correction for all peaks it was necessary that both the metabolite and water spectra were accurately phased before combination. Although the correction for time-dependent phase variations (ECC) should result in correctly phased spectra for SIH2O, small phase differences were nevertheless observed that appeared to be associated with small line-shape distortions, particularly at voxels near the edge of the brain, and phase variations are always present in the SIMet spectrum; therefore, a zero-order phase correction was applied to both datasets before the spectral combination step.
Figure. 1.
Summary of the main processing steps for the calculation of the temperature maps. ECC = Eddy Current Correction, PCA = Principal Component Analysis.
Figure. 2.
Example of the combined water and metabolite spectrum (blue) with the results of spectral fitting (red) and the residual of the fit (black).
Prior to spectral analysis a denoising procedure using principal component analysis (PCA) was applied that results in improved spectral quality with minimal impact on spectral linewidth (Abdoli et al., 2016). To improve effectiveness of this procedure a B0 correction was first applied using the frequency offset values derived from spectral fitting of the metabolite resonance portion of the combined spectrum. Parametric spectral analysis was then applied to obtain the frequencies and amplitudes of the singlet resonances for water, NAA, the Cre methyl resonance, and Cho. This analysis used a time-domain model of the spectrum with a baseline modeling in the frequency domain (Soher et al., 1998). The spectral model used a common Gaussian linewidth for all resonances plus a fixed Lorentzian component for each compound. The fixed T2 values for the metabolite resonances were derived from the literature (Choi et al., 2011; Prescot et al., 2014), and set to 250 ms, 160 ms and 230 ms for NAA, Cre, and Cho respectively. The T2 of water is known to be shorter and this Lorentzian component was set empirically to 55 ms based on a preliminary analysis of the performance for fitting of the water resonance. The spectral fitting showed excellent agreement between the fit result and all resonances, as shown in Fig. 2. To save time in the processing the spectral fitting was only applied to voxels for which the SIH2O linewidth was ≤15 Hz. Following spectral analysis, maps of the frequency differences in ppm were calculated between water and NAA, ΔH2O-NAA, water and Cho, ΔH2O-Cho, and water and Cre, ΔH2O-Cre.
Information on the relative tissue contribution to each MRSI voxel was derived from a segmentation of the T1-weighted MRI using FSL/FAST (Zhang et al., 2001) that was resampled using the spatial response function of the MRSI data, to obtain maps of the relative volume contribution of GM, fGM, and WM, fWM. Additional processing included non-linear spatial registration to a standard spatial reference, or MNI space (Collins et al., 1998), at 2-mm isotropic resolution. This was applied to the individual metabolite and temperature maps, the fitted spectral linewidth, and the maps of the relative tissue content.
GM-WM Magnetic Susceptibility Differences
Prior to applying the temperature measurement calculation, the water-metabolite frequency differences due to local susceptibility effects in GM and WM were measured using a subset of 27 subjects (age 20 to 59, 14 male), which is referred to as Group A to distinguish this set of tests from the analyses done for the larger group. This was carried out using two analysis methods. The first generated spectra corresponding to 100% contribution of each tissue type, using the procedure described by Mandl et al. (Mandl et al., 2012), and applied the spectral analysis to these decomposed spectra. This procedure takes multiple spectra within a ROI and applies a decomposition using knowledge of the fractional tissue content at each voxel to derive the mean GM and WM model spectra, based on the assumption that each tissue type has a characteristic spectral pattern. The data is described as a linear model D=WS; where, D is a matrix of the n voxel spectra selected from the ROI with m points each, W is the fractional WM and GM content for each of the selected voxels, and S contains the characteristic spectra corresponding to 100% WM and GM. This equation was then solved for S by estimating the inverse of W (Goryawala et al., 2016). The procedure was applied to voxels selected from multiple regions of interest (ROIs). Because the temperature of the brain has been reported to vary with depth, voxels were selected from peripheral brain regions so as to minimize the possible contribution of temperature variations. This region selection was achieved by modifying a brain atlas that defined the frontal, temporal, parietal and occipital lobes, to exclude central brain regions. This modified atlas was then spatially transformed to each individual subject MRSI coordinates to define the ROIs for voxel selection. A region of approximately 2.6 cm depth from the cortical surface and which extended from the level of the ventricles for 4 cm towards the top of the head was defined. Voxels were then selected within peripheral regions within each brain lobe, that met the selection criteria for CSF fraction <20% and linewidth ≤8Hz. Spectral analysis was then applied to the resultant GM and WM spectra to obtain the water and metabolite frequencies in each tissue, for 8 ROIs within the cerebrum.
The second method for analysis of GM and WM differences used a tissue regression analysis for the mean value frequency difference images in standard space. Maps of the mean values of ΔH2O-NAA, ΔH2O-Cho, ΔH2O-Cre, and the corresponding mean SI-resolution GM and WM distributions, were initially generated using all subjects in Group A. These maps were generated using voxel selection criteria for linewidth ≤8 Hz and CSF fraction <20%, and the mean value result was retained only if >20 (74%) studies returned a valid result at that voxel. Multiple voxels were then selected from the mean value maps in the periphery of the brain, running to approximately 2 cm depth, and for axial slices running from the level of the ventricles to the top of the brain. In consideration of the image interpolation included in the spatial normalization the data was subsampled by a factor of 2 in all dimensions. A regression analysis was then applied for the mean frequency difference against the relative GM fraction calculated as fGM/(fGM+fWM). The frequency difference corresponding to extrapolation to 100% GM and WM was then calculated.
Temperature Analysis
Temperature maps were generated using ΔH2O-NAA, ΔH2O-Cho, and ΔH2O-Cre, as well as using the weighted combination (Cady et al., 2010), while also taking into account the correction for frequency differences caused by susceptibility variations in gray- and white matter tissue, which were derived in the previously described step. Initial evaluation indicated that the calibration factors of Zhu et al. (Zhu et al., 2008) and Prakash et al. (Prakash et al., 2014) produced results that were closest to a target value, for which a mean WM temperature of 37.5°C was assumed (Hirashima et al., 1998); however, since there remains little agreement in the published values for the temperature calibration, small adjustments in the intercept values were applied in order to make the mean temperatures, averaged over WM in the frontal, temporal and parietal lobes, for a subset of 18 studies that were of similar age (aged 21 to 28, median 25, 5 male), to be the same for all three metabolites and equal to 37.5 °C. The resultant calibration factors used were:
| [1] |
These use the slope values from Prakash et al. (Prakash et al., 2014) but with slightly increased intercept values.
Following spatial normalization of all temperature maps the lobar brain atlas was then used to select voxels within each of the left and right frontal, temporal, occipital, and parietal lobes, and the cerebellum, with selection criteria of <20% CSF and a linewidth of ≤8 Hz. Outlying values for each parameter map were also removed if the value exceeded three times the standard deviation from the mean value, based upon all voxels within the selected region. A regression analysis was then carried out to examine the association of temperature in each brain region with age and weight, for each of the temperature calculation methods. Significance was set for p<0.002 to include a correction for multiple comparisons using the Bonferroni method (9 regions and 3 temperature calculation methods). Differences between gender were also evaluated using a two-sample t-test. Mean value temperature maps were also generated in standard space by averaging the coregistered maps from all subjects. For this calculation, the same linewidth and outlier removal tests were applied, but the CSF fraction was increased to 30% or 40% in order to generate a result that covered a greater extent of the brain volume to improve the visual appearance.
Accuracy Estimation
Three investigations were carried out to estimate the accuracy of the temperature measurement. A Monte Carlo simulation was first implemented that started with high signal-to-noise ratio (SNR) metabolite spectra obtained from the spectral decomposition analysis and then performed repeated frequency estimations with added noise and varying differences between the water and metabolite portions of the spectra. This study was based on 10 metabolite spectra that had SNR>100:1 (defined as peak NAA to RMS noise) and 10 water spectra obtained from different locations in one set of SIH2O data. The frequency of the water spectrum was then modified, using 10 steps from 0 to 0.05 ppm (6.4 Hz), and then combined with the metabolite resonance which had noise added to give a SNR ~20:1, similar to that of the in vivo single voxel spectra. The spectral analysis was then applied to the combined spectrum and the difference in the frequency separation factors, ΔH2O-NAA, ΔH2O-Cre and ΔH2O-Cho from the same value from a fit of the high SNR spectrum were calculated. Results were analyzed to obtain the mean and maximum error due to the spectral fitting procedure.
The second error estimation analysis examined the variation of the temperature calculated using a study of a spherical water phantom that contained all three metabolites at physiological concentrations. The phantom was at room temperature and the temperature was assumed to be constant throughout the object.
The third analysis examined the standard deviation of the temperature measurements from a repeat study in two human subjects, who were each studied 5 times, for which results for metabolite measurements have been published previously (Maudsley et al., 2010b). The analysis examined the standard deviations for measurements at individual SI voxels within a central WM region, and for mean values obtained from the atlas-defined lobar WM measurements calculated over all studies.
Results
An example of the combined water and metabolite spectrum from a single voxel in central white matter is shown in Figure 2, together with the spectral fitting result. This demonstrates good quality spectra, with a fitted metabolite linewidth of 4.4 Hz, and accurate fitting of both the metabolite resonances as well as the broader water peak that can be seen to have a stronger Lorentzian component. A quality evaluation indicated that on average 53% of the total brain volume was sampled (range 27% to 68%). The primary criterion used for this evaluation was a fitted spectral linewidth of less than 10 Hz, with additional criteria being a Cramer-Rao lower bound (CRLB) for the Cre area of <15% and exclusion of voxels that had spectra with outlying values, as defined by three times the standard deviation of all spectra in the dataset, in the range of 1.7 to 3.6 ppm. An additional linewidth threshold of 8 Hz was applied for voxel selections in all temperature analyses performed in this study. These criteria are more stringent than has previously been applied for metabolite concentration mapping (Maudsley et al., 2009) in light of the sensitivity of the temperature measurement to the spectral linewidth (Childs et al., 2007). The typical mean CRLB values were under 5% for the NAA, Cre, and H2O relative concentrations, under 7% for the Cho relative concentration, and under 1% for all resonance frequencies.
GM-WM Magnetic Susceptibility Differences
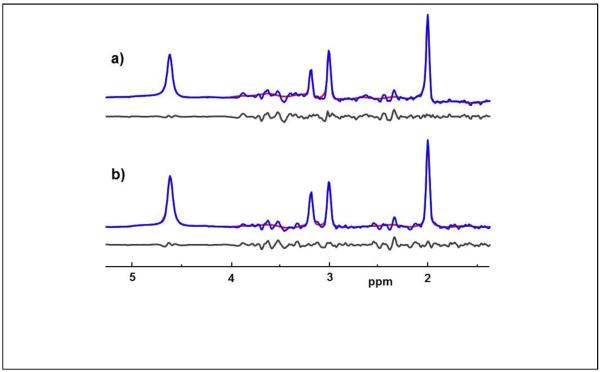
In Fig. 3 are shown examples of decomposed GM and WM spectra from the left frontal lobe, which were derived from a total of 292 (interpolated) voxels, or 31.2 cc, and have SNRs of 77:1 and 100:1 respectively. The spectral analysis results show excellent fitting of all four resonances (note that the NAA and glutamate multiplets at ~2.3 to 2.6 ppm were not included in the model) and returned linewidths of 4.3 and 4.9 Hz. In this example the resonance frequency values returned from the spectral fitting reported differences between GM and WM of 4 ppb for ΔH2O-NAA, 3.2 ppb for ΔH2O-Cho, and −0.8 ppb for ΔH2O-Cre. For NAA, this corresponds to a frequency difference of 0.5 Hz, which, with an x2 interpolated sampling resolution of 1.22 Hz/point, is not directly visible in the spectra. Using the decomposed spectral analysis for subjects in Group A, the mean value frequency differences between GM and WM were found to be ΔH2O-NAA=3.1±3.7 ppb, ΔH2O-Cre=2.8±3.3 ppb, and ΔH2O-Cho=4.5±4.0 ppb. With standard deviations comparable to the mean values it is apparent that despite the excellent quality of the spectra, the magnitude of the tissue-specific differences is comparable to the accuracy of the measurement. This finding suggests that magnetic susceptibility differences across the selected ROI have resulted in reduced accuracy of the spectral decomposition procedure.
Figure. 3.
Example spectra corresponding to (a) 100% gray-matter and (b) 100% white-matter obtained using the spectral decomposition procedure in the left frontal lobe, together with the spectral fit result (shown in red) and the residual of the fit (black).
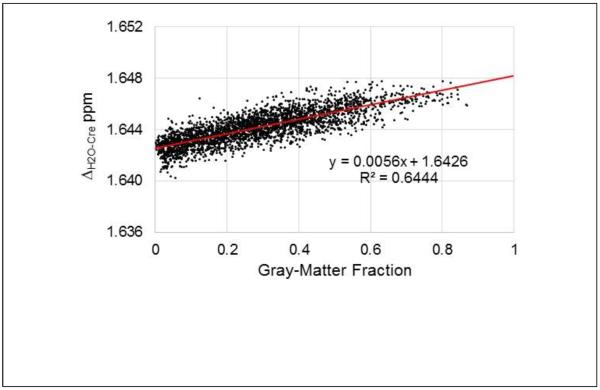
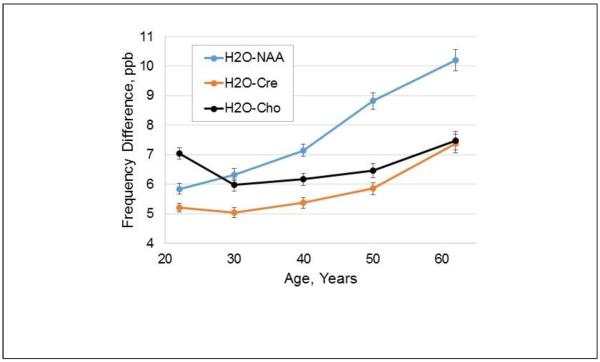
In Fig. 4 is shown a scatter plot of the mean ΔH2O-Cre value against the corresponding mean GM fraction at each voxel, obtained from the analysis of all subjects in Group A. This demonstrates that the resonance frequency difference has a linear dependence with the GM tissue fraction, with increased frequency separation between water and Cre in GM of 5.6±0.75 ppb. Results for ΔH2O-NAA and ΔH2O-Cho showed a similar distribution of data points with frequency difference increases in GM of 6.88±1.03 ppb and 6.61±0.89 ppb respectively. Comparison of the coefficients of the regressions using a Student's t-test (Andrade and Estevez-Perez, 2014) (Minitab 17 statistical software) indicated that the slopes of the tissue regressions were significantly different between the ΔH2O-NAA and ΔH2O-Cre results, and the ΔH2O-Cre and ΔH2O-Cho results (p<0.0001), and almost reached significance (p=0.053) for the ΔH2O-NAA and ΔH2O-Cho results. This finding indicates that there are metabolite-specific resonance frequency differences between GM and WM, that are in addition to that of the water resonance. A second analysis was then performed using data from all subjects to examine whether these metabolite frequency differences vary with age. Data was divided into 5 groups, of 18 to 25, 26 to 35, 36 to 45, 46 to 55, and 56 to 85 years old, which had 39, 34, 28, 28, and 22 subjects respectively, and the regression analyses carried out using the mean frequency value and relative GM maps for each age group. This analysis indicated that age-dependent changes occur with the strongest change occurring for NAA, as shown in Fig. 5. The mean values over all age groups were 7.7 ppb for NAA, 5.8 ppb for Cre, and 6.6 ppb for Cho.
Figure. 4.
Scatterplot of the mean ΔH2O-Cre against the corresponding mean gray-matter fraction at each corresponding voxel, for 27 subjects (Group A). Data was selected for a peripheral brain region encompassing cortical structures, for slices superior to the ventricles. The result of the regression is also shown in red.
Figure. 5.
Variation of the difference in the water-metabolite frequency separation between gray- and white-matter, in ppb. Results are shown for the three metabolites as a function of the average value of the age group used for each analysis.
Temperature Analyses
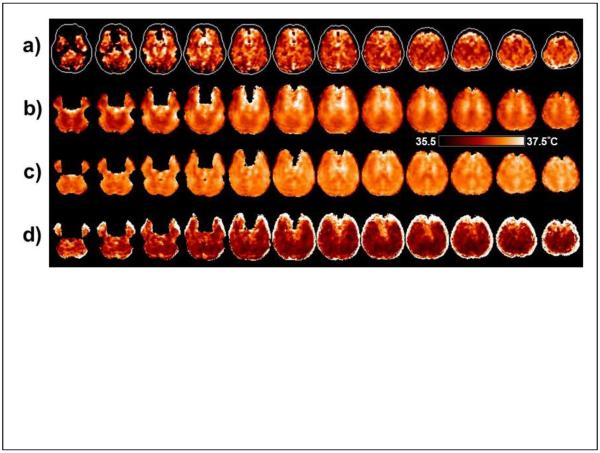
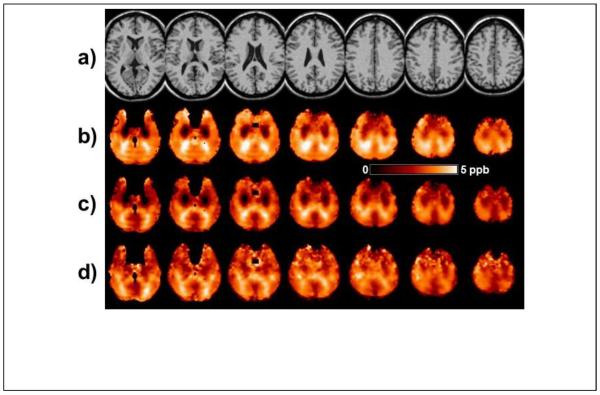
In Fig. 6a is shown a temperature map based on ΔH2O-NAA obtained in a single subject. The maps based on ΔH2O-Cre, ΔH2O-Cho, or the weighted sum were very similar. The contour in each slice of Fig. 6a shows the outline of the brain and the dark regions within this contour represent areas for which the spectra did not meet the image quality criteria. Some brighter regions can also be seen that typically indicate areas of lower spectral quality or may contain lipid contamination, but which were not excluded by the initial quality criteria. Also shown in Fig. 6 are the average temperature maps calculated for all subjects in Group A, and which included voxels that had a linewidth of ≤8 Hz, without (Fig. 6b) and with (Fig. 6c) the GM-WM susceptibility correction factors obtained in the previous measurement from the same group of subjects. The apparent temperature variations seen in Fig 6b that are associated with the GM and WM distribution are reduced after inclusion of the tissue susceptibility correction; however, structure remains, indicating that the susceptibility variations cannot be fully described by fixed values for each tissue type. The panel in Fig. 6d shows the standard deviation of the mean temperature map, indicating that the greatest variability is at the edges of the brain, where effects of increased line-broadening, lipid contamination, and errors in spatial normalization have the largest effect.
Figure. 6.
Example temperature maps generated using ΔH2O-NAA. (a) Temperature map for an individual subject, displayed for a range of 36.5 to 38.5°C. Slices are displayed at the reconstructed spatial resolution, with 5.6 mm slice interval. (b) The mean value temperature map in MNI space, generated from all subjects in Group A and displayed for a range of 35.5 to 37.5°C. Images are displayed at 6 mm spacing. (c) The corresponding mean value temperature map after including the correction for the susceptibility differences between gray- and white-matter. (d) The standard deviation of the temperature for all subjects in Group A. Within the darker areas of these maps the coefficient of variance ranged from 6% to 12%.
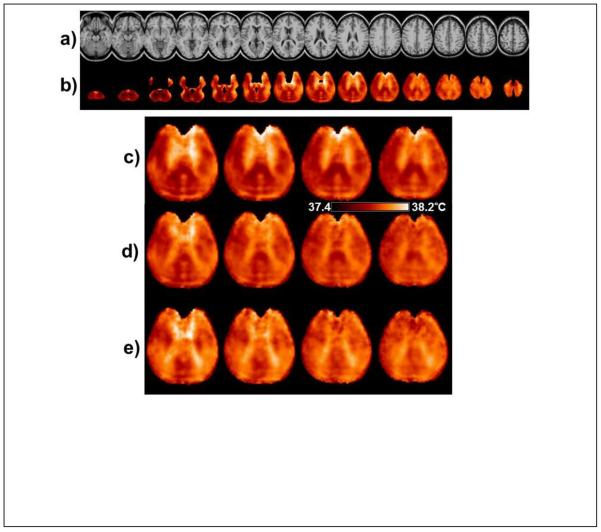
In Fig. 7 are shown results of the mean temperature calculation obtained using all subjects. In Fig. 7b is shown the mean temperature map calculated from ΔH2O-NAA, with voxel selection criteria of linewidth ≤8Hz, CSF content <40%, and a minimum of 50 subjects at each voxel. The maps are displayed at the same spatial resolution as the MRI used for the atlas registration (Fig 7a). It can be seen that some cortical surface and temporo-frontal regions remain unsampled due to the voxel exclusion criteria used. In Fig. 7b structure can be seen within the brain that would not be anticipated from localized temperature variations, and furthermore, these variations were observed to be different for the temperature maps generated from each metabolite. This finding is shown in more detail for four central slices in Figs. 7c to 7e, using a color scale with a range of 0.8°C. Of these features, the banding appearance running approximately horizontally in the posterior region of Fig. 7c is likely associated with ringing of subcutaneous lipids that can occur in these regions and most strongly affects the fitting of NAA.
Figure. 7.
(a) The reference MRI used for the spatial normalization. (b) The mean temperature map calculated from ΔH2O-NAA using all subjects. Every third slice (6 mm spacing) is shown from the spatially-normalized image result with a temperature scale range of 1.0°C. In (c), (d) and (e) are shown the central slices at 4 mm spacing using the same color scale of 0.8°C, generated using ΔH2O-NAA, ΔH2O-Cre, and ΔH2O-Cho respectively.
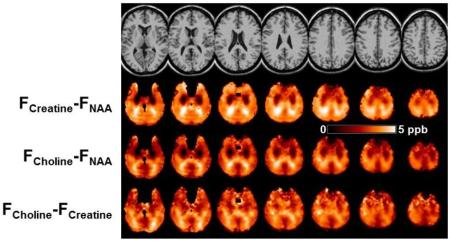
To further investigate the image features seen in Fig. 7, maps of the differences between each metabolite frequency were generated, i.e. ΔCre-NAA, ΔCho-NAA, and ΔCho-Cre, which are shown in Fig. 8. For maps generated from ΔCre-NAA, Fig. 8b, and ΔCho-NAA, Fig. 8c, bilateral areas of decreased values can be seen in frontal regions. Since these are most prominently seen in both of the difference maps involving NAA it can be inferred that these are due to downfield shifts of the NAA resonance, relative to the Cre and Cho resonance frequencies. Comparison of these maps with a coregistered white-matter atlas (Oishi et al., 2009) indicates that these image features correspond to the corona radiata, which are relatively large white-matter tracts that run in the caudal-cranial direction, i.e. in the direction of the B0 field. Bright image features can be seen in in posterior regions of all frequency difference maps, but which are most pronounced in Figs. 8b and 8c, that suggest upfield shifts of the NAA resonance in the posterior thalamic radiations and splenium, which are tracts that run perpendicular to the B0 field. These findings therefore strongly indicate differences in resonance frequency due to cellular-level variations of the magnetic susceptibility and the different compartmentalization of the individual metabolites. With a range of ~5 ppb, these correspond to modification of the apparent temperature measurement of up to 0.5°C.
Figure. 8.
(a) The reference MRI and maps of (b) ΔCre-NAA, and (c) ΔCho-NAA, (d) ΔCho-Cre, obtained using mean frequency values from all subjects.
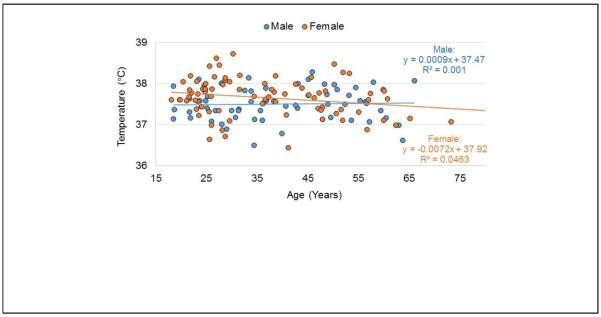
Analysis of mean temperature in WM regions of each brain lobe across the complete group of subjects indicated no significant changes with age or weight, when accounting for multiple comparisons (p<0.002). While nine of the evaluations resulted in a p-value of slightly under 0.05, there were no consistent findings across all three of the temperature reference methods in any region. In Fig. 9 is shown an example of the temperature measurement across all subjects in the left temporal lobe, separated by male and female subjects. The standard deviation over all subjects for this region was 0.44°C and the values for all other regions were very similar. On average, temperatures were slightly higher in the left hemisphere relative to the right, by 0.034°C, reaching significance in the frontal lobe (0.046°C, p=0.002) and a strong trend in the temporal and parietal lobes (0.039°C, p=0.012 and 0.029°C, p=0.021 respectively). The temperature of the cerebellum was slightly lower, at 37.2°C, relative to a mean cerebral temperature of 37.5°C (p<0.0001).
Figure. 9.
Example of the distribution of the mean temperature calculated in central white-matter for all subjects. Data are shown for the left temporal lobe for male and female subjects, along with a regression line for each subject group. No significant change with age was noted in any brain region.
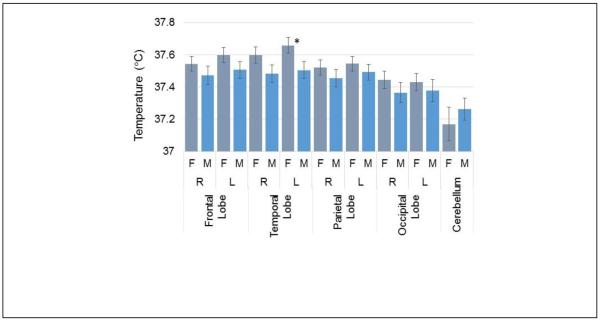
In Fig. 10 are shown the mean WM temperature in all brain regions for male and female subjects. This result shows a trend for increased brain temperature throughout the cerebrum in females, relative to males, on the order of 0.1°C. The left temporal lobe exhibited the largest difference of 0.15°C with a p-value of 0.03.
Figure. 10.
Mean temperature in white matter for each brain region separated by male and female subjects. The asterisk indicates a p-value of <0.05 for the difference between male and female subjects in that brain region.
Accuracy Estimation
For the simulation study a standard deviation of the frequency measurement of 0.0018 ppm (±0.2°C) was obtained, with a maximum error of 0.006 ppm (0.6°C). There was no dependency of the error of the frequency determination with the frequency shift of the water resonance, and the mean standard deviation of the error for ΔH2O-Cho was 60% greater than that of ΔH2O-Cre and ΔH2O-NAA. Since this simulation did not include effects such as varying line width and phase this can be considered as a minimum error estimation. For the phantom study, the standard deviation over all voxels within a region of 4.0×4.0 cm in a central slice was 0.7°C, and over a whole slice, for a linewidth <8 Hz, was 1.6°C. This performance was the same for all temperature measurement methods.
For the repeat study evaluation in two human subjects, the standard deviation for measurements at 32 individual voxels within a ROI located in a single central slice was 2.1°C. The standard deviation of regional mean values, averaged over all voxels with >80% white-matter in each lobar region and with a linewidth threshold of 8 Hz, ranged from 0.06°C (NAA measurement in the left frontal lobe) to 0.4°C (Cho measurement in the left occipital lobe). The average standard deviation, taken over all regions for the measurement using ΔH2O-NAA, was 0.2°C. From these results the accuracy of the temperature measurement is estimated to be on the order of ±2°C for single voxel measurements to ±0.2°C for regional averages.
Discussion
This study represents the most comprehensive evaluation of 1H-MRS temperature measurements in the human brain to date, with measurements from 150 subjects and from a larger fraction of the brain volume than has previously been evaluated. By combining volumetric MRSI data from multiple subjects, new observations of the apparent temperature distribution within the brain have been obtained. A major finding of this study is that magnetic susceptibility induced frequency shifts, which cannot be resolved from temperature-induced changes, can have a significant impact on the accuracy of the temperature measurement. To account for these differences in gray- and white-matter, this study has for the first time included information on the relative tissue content and the GM/WM resonance frequency differences in the temperature calculation. Using two different measurement approaches, this study found different values for the frequency difference between the water and metabolite resonances in gray and white matter. It should be noted that this measurement is relative to the water resonance frequency and excludes shifts due to macroscopic susceptibility-induced field variations from anatomical structures, which affect all resonances. This result supports the findings of Chadzynski et al. (Chadzynski et al., 2011); although with smaller values being found for the age of the subjects used in that study (27.5 years) as well as the finding of minimal differences between the shift values for each metabolite at that age (Fig. 5). The magnitude of the shift is smaller than the value of 15.7 ppb reported for the shift of the water resonance by Duyn et al. (Duyn et al., 2007); however, it should again be noted that the MRS measurement represents the difference of the metabolite frequency from that of the water, and therefore reflects their different molecular environments. An additional new finding of this study is that this tissue-dependent susceptibility induced frequency shift is age dependent (Fig. 5). It has been reported that the susceptibility variations in brain tissue are primarily due to myelin (He and Yablonskiy, 2009; Langkammer et al., 2012) and age-dependent changes of the magnetic susceptibility effect on the water resonance have been reported (Li et al., 2014) as well as increases of radial diffusivity that is interpreted to reflect age related demyelination and increase in extracellular water (Bennett et al., 2010).
In addition to the GM and WM tissue-dependent frequency shifts, this study has demonstrated that additional susceptibility-induced frequency shifts are present that differ for each metabolite resonance and which reflect the cellular structure and organization, as proposed by He and Yablonskiy (He and Yablonskiy, 2009). The strongest findings were found for NAA, which in WM is localized within the axons, with downfield resonance shifts found in WM tracts aligned with the B0 and upfield shifts in axons aligned perpendicular to B0. It is considered likely that this change reflects both the intra-axonal compartmentalization of NAA and the anisotropic susceptibility of the myelin (Lee et al., 2010). These tissue and cellular orientation variations can impact temperature measurement by up to 0.8°C, which is comparable to the variations in regional brain temperature measurements seen across a group of healthy subjects (Fig. 9) and greater than the estimated intra-subject reproducibility for ROI-based temperature measurements. While the orientation dependence of magnetic susceptibility on the water resonance has been described and this mechanism is known to affect metabolite resonances in muscle tissue (Boesch and Kreis, 2001; MacMillan et al., 2016), to our knowledge this is the first report of these metabolite-specific effects in the brain.
While this study has demonstrated spatial variations of estimated temperatures within the brain using voxel-based averaging methods, these cannot be distinguished from the confounding effects of the magnetic susceptibility induced frequency shifts. It is therefore proposed that the term “apparent temperature” be used for MRS measurements in the brain. However, the apparent temperature maps generated do nevertheless provide some indication of temperature variations within the brain, including slightly decreased temperatures at the edges of the brain relative to periventricular regions, on the order of 0.4°C, as for example seen in the map derived from ΔH2O-Cre in Fig. 7d. These variations are consistent with measurements made in vivo in monkeys (Hayward and Baker, 1969; Wang et al., 2014), but much less than the ~1°C variation measured in patients undergoing neurosurgical procedures (Hirashima et al., 1998; Mellergard, 1995). Additional regional variations detected in this study were small lateralization differences and a slightly lower temperature in the cerebellum. The only temperature differences found that were dependent on any of the subject variables that were tested was that the average cerebral brain temperature in females showed a trend to being 0.1°C warmer than for males; however, it should again be noted that the possible effect of susceptibility differences cannot be excluded. No significant changes of apparent brain temperature were detected with age or body weight. These findings are consistent with measures of body temperature, which has been reported to be different for males and females but with no variation with age and body-mass index (Lu and Dai, 2009).
The accuracy of in vivo MRS-based temperature mapping remains challenging due to the small temperature dependence of the water resonance frequency over the range of temperatures seen in vivo relative to the spectral linewidth. Some features of this study implementation are noted that benefit the frequency measurement. Firstly, the MRSI data were acquired at a higher spatial resolution than would be warranted from SNR considerations; however, this smaller voxel volume results in a narrower linewidth that improves the accuracy of the temperature measurement. The processing also maintains the linewidth in the final MRSI data by applying a B0 correction before spatial smoothing is done (Ebel and Maudsley, 2003). In addition, a spectral denoising procedure has been applied that provides an improvement in SNR with minimal impact on the linewidth (Abdoli et al., 2016). Nevertheless, with whole-brain detection, areas of significant B0 inhomogeneity are inevitably present and a strict maximum linewidth threshold was imposed to maintain quality in the voxels selected for the temperature measurement. Despite these efforts, some indication of an apparent increase in temperature in regions of the brain that have greater B0 inhomogeneity remained in the temperature maps (e.g. Fig. 7c).
An additional feature of the acquisition method used is that the metabolite and water SI datasets are obtained in an interleaved manner, therefore longer-term frequency drifts that may come from subject motion or instrumentation factors (Ebel and Maudsley, 2005) will impact both datasets equally. The data processing also included measurement of the gradient-induced frequency drifts from the water SI, which was then corrected in both datasets. It is, however, noted that the temperature calibration obtained by Prakash et al (Prakash et al., 2014) found a difference in the intercept value from that of a single-voxel measurement. It is speculated that this could be due to short-term heating of the gradient coils over the time of each EPI readout of the metabolite signal, resulting in a small frequency shift at the time of the water SI EPI readout. This effect is likely to be instrument-dependent, and represents a potential disadvantage of the Echo-Planar acquisition method, along with the potential for increased eddy-current induced lineshape distortions relative to spectral sampling in the absence of any applied gradient. It is possible that increased accuracy of the frequency measurement may be obtained by increasing the readout duration beyond 800 ms.; however, inspection of time-domain data generated from high SNR regionally-integrated spectra indicate that the FID magnitude is decreased by more than a factor of 100 at the end of the sampling period and it is considered unlikely that extending the total sampling period would provide any improvement for measurements at 3T.
Although the method for measuring GM- and WM-specific resonance frequencies using the spectral decomposition method produced results were comparable to the individual voxel regressions (2.8 to 4.5 ppb difference), this analysis method proved to be relatively insensitive, despite the excellent quality of the decomposed GM and WM spectra. A likely reason for this finding is that the susceptibility differences between GM and WM are not homogeneous, and that the combination of spectra from WM regions that contain multiple orientations of the axonal fibers with slightly different resonance frequencies due to the anisotropic susceptibility of the myelin (Lee et al., 2010) resulted in loss of information. Additional reasons for this finding could include the difficulty of detecting frequency shifts that are smaller than the typical in vivo metabolite resonance linewidth. In contrast to the report of Chadzynski et al. (Chadzynski et al., 2011) the tissue-specific frequency shifts could not be visually detected. It is believed that the primary limitation is the sensitivity of the frequency measurement in the spectral analysis, as indicated by the simulation study, which found a standard deviation of the measurement (~2 ppb) that is comparable to the GM-WM frequency differences (5 to 10 ppb).
The reproducibility of the temperature measurement in this study was estimated at ±2°C for single voxel measurements, which precludes detailed temperature mapping in single subjects, but this could be substantially improved to ±0.2°C using regional averages. Childs et al. (Childs et al., 2007) have reported an accuracy of 0.8°C in a phantom study at 3 T, which is similar to that found in this study, and shown using a simulation study that linewidths >8 Hz greatly increase the error of the measurement. Cady et al. (Cady et al., 2010) have reported a reproducibility at 2.4 T of 0.65°C for the NAA measurement and 0.45 for the weighted combination calculation, and studies at 1.5 T have reported a standard deviation on the order of 1°C (Corbett et al., 1997; Karaszewski et al., 2006). This study found similar performance for temperature calculations using all three of the metabolite resonance reference methods, with no benefit obtained using the weighted sum (Cady et al., 2010). A small improvement was obtained from the ΔH2O-NAA measurement; however, this may be offset by the greater sensitivity of this measurement to the orientation of the neuronal fibers, which can account for a difference of up to 0.5°C. Overall, the calculation using ΔH2O-Cre is recommended as this appears to be less sensitive to susceptibility effects and was equally reliable to the ΔH2O-NAA measurement. For all frequency reference methods, however, it is recommended that correction for the relative tissue content and the associated susceptibility-induced frequency variations should be included and that ROIs be chosen for the temperature measurements that have minimal additional susceptibility-induced frequency shifts (i.e. based on the maps shown in Figs. 7 and 8), for example the superior parietal region. Further improvement may be possible by incorporating spatial variations for each metabolite resonance frequency and subject age in this correction and potentially incorporating correction factors based on measures of the axonal organization.
Limitations of this retrospective study include that information on body temperature, or of possible factors that could impact brain temperature such as medication use, circadian rhythm, handedness, or menstrual cycle (Kelly, 2006) were not available. In common with all MRS studies of brain temperature in human subjects the accuracy of the measurement remains unverified, as it is dependent upon the calibration factors used for which there is considerable variation in published values and a known dependence on acquisition and analysis methods. Of the published calibrations, similar values for the temperature dependence of ΔH2O-NAA have been reported in four studies (Kuroda et al., 2003; Prakash et al., 2014; Vescovo et al., 2013; Zhu et al., 2008) and therefore this study has used these values while modifying the intercept values to obtain the same assumed mean WM temperature from all three reference measurements.
Highlights.
Brain temperature can be mapped over a large volume using volumetric MR spectroscopic imaging.
The accuracy of the temperature measurement is impacted by local tissue susceptibility variations.
Spatial variations of the relative metabolite resonance frequencies occur due to susceptibility differences associated with the molecular subcellular localization.
Measurements using mean values in a group of normal subjects reveal no temperature difference with age, but with small changes with gender and spatial location.
Acknowledgements
This work was supported by National Institutes of Health awards R01EB016064 and R01CA172210. The data used in this study was obtained under previous awards R01EB000822, R01NS041946, R01NS055107, R01NS060847, and from the Miami Center for AIDS Research (CFAR) at the University of Miami Miller School of Medicine under National Institutes of Health Grant P30AI073961, and the contribution of Dr. Varan Govind to these data acquisitions is gratefully acknowledged. The MIDAS software was developed under R01EB000822 and continues to be made available under R01EB016064. Additional support for the spectral integration program module was provided from R21CA170284 under the direction of Dr. Harish Poptani. The assistance of Dr. Brian Soher with ongoing support of the spectral analysis program and previous contributors to the development of the MIDAS software is also gratefully acknowledged.
Footnotes
Publisher's Disclaimer: This is a PDF file of an unedited manuscript that has been accepted for publication. As a service to our customers we are providing this early version of the manuscript. The manuscript will undergo copyediting, typesetting, and review of the resulting proof before it is published in its final citable form. Please note that during the production process errors may be discovered which could affect the content, and all legal disclaimers that apply to the journal pertain.
References
- Abdoli A, Stoyanova R, Maudsley AA. Denoising of MR spectroscopic imaging data using statistical selection of principal components. Magn. Reson. Mater. Phy. 2016 doi: 10.1007/s10334-016-0566-z. In Press. 10.1007/s10334-016-0566-z. [DOI] [PMC free article] [PubMed] [Google Scholar]
- Andrade JM, Estevez-Perez MG. Statistical comparison of the slopes of two regression lines: A tutorial. Anal. Chim. Acta. 2014;838:1–12. doi: 10.1016/j.aca.2014.04.057. 10.1016/j.aca.2014.04.057. [DOI] [PubMed] [Google Scholar]
- Bennett IJ, Madden DJ, Vaidya CJ, et al. Age-related differences in multiple measures of white matter integrity: A diffusion tensor imaging study of healthy aging. Hum Brain Mapp. 2010;31:378–390. doi: 10.1002/hbm.20872. 10.1002/hbm.20872. [DOI] [PMC free article] [PubMed] [Google Scholar]
- Boesch C, Kreis R. Dipolar coupling and ordering effects observed in magnetic resonance spectra of skeletal muscle. NMR Biomed. 2001;14:140–148. doi: 10.1002/nbm.684. [DOI] [PubMed] [Google Scholar]
- Cady EB, D'Souza PC, Penrice J, et al. The estimation of local brain temperature by in vivo 1H magnetic resonance spectroscopy. Magn. Reson. Med. 1995;33:862–867. doi: 10.1002/mrm.1910330620. [DOI] [PubMed] [Google Scholar]
- Cady EB, Penrice J, Robertson NJ. Improved reproducibility of MRS regional brain thermometry by `amplitude-weighted combination'. NMR Biomed. 2010;24:865–872. doi: 10.1002/nbm.1634. [DOI] [PubMed] [Google Scholar]
- Chadzynski GL, Bender B, Groeger A, et al. Tissue specific resonance frequencies of water and metabolites within the human brain. J. Magn. Reson. 2011;212:55–63. doi: 10.1016/j.jmr.2011.06.009. 10.1016/j.jmr.2011.06.009. [DOI] [PubMed] [Google Scholar]
- Childs C, Hiltunen Y, Vidyasagar R, et al. Determination of regional brain temperature using proton magnetic resonance spectroscopy to assess brain-body temperature differences in healthy human subjects. Magn. Reson. Med. 2007;57:59–66. doi: 10.1002/mrm.21100. 10.1002/mrm.21100. [DOI] [PubMed] [Google Scholar]
- Choi C, Ganji SK, DeBerardinis RJ, et al. Measurement of glycine in the human brain in vivo by 1H-MRS at 3 T: application in brain tumors. Magn. Reson. Med. 2011;66:609–618. doi: 10.1002/mrm.22857. 10.1002/mrm.22857. [DOI] [PMC free article] [PubMed] [Google Scholar]
- Collins DL, Zijdenbos AP, Kollokian V, et al. Design and construction of a realistic digital brain phantom. IEEE Trans. Med. Imag. 1998;17:463–468. doi: 10.1109/42.712135. [DOI] [PubMed] [Google Scholar]
- Corbett R, Laptook A, Weatherall P. Noninvasive measurements of human brain temperature using volume-localized proton magnetic resonance spectroscopy. J. Cereb. Blood Flow Metab. 1997;17:363–369. doi: 10.1097/00004647-199704000-00001. 10.1097/00004647-199704000-00001. [DOI] [PubMed] [Google Scholar]
- Corbett RJ, Laptook AR, Tollefsbol G, et al. Validation of a noninvasive method to measure brain temperature in vivo using 1H NMR spectroscopy. J. Neurochem. 1995;64:1224–1230. doi: 10.1046/j.1471-4159.1995.64031224.x. [DOI] [PubMed] [Google Scholar]
- Covaciu L, Rubertsson S, Ortiz-Nieto F, et al. Human brain MR spectroscopy thermometry using metabolite aqueous-solution calibrations. J. Magn. Reson. Imaging. 2010;31:807–814. doi: 10.1002/jmri.22107. 10.1002/jmri.22107. [DOI] [PubMed] [Google Scholar]
- Duyn JH, van Gelderen P, Li TQ, et al. High-field MRI of brain cortical substructure based on signal phase. Proc. Natl. Acad. Sci. USA. 2007;104:11796–11801. doi: 10.1073/pnas.0610821104. 10.1073/pnas.0610821104. [DOI] [PMC free article] [PubMed] [Google Scholar]
- Ebel A, Maudsley AA. Improved spectral quality for 3D MR spectroscopic imaging using a high spatial resolution acquisition strategy. Magn. Reson. Imaging. 2003;21:113–120. doi: 10.1016/s0730-725x(02)00645-8. [DOI] [PubMed] [Google Scholar]
- Ebel A, Maudsley AA. Detection and correction of frequency instabilities for volumetric 1H echo-planar spectroscopic imaging. Magn. Reson. Med. 2005;53:465–469. doi: 10.1002/mrm.20367. [DOI] [PubMed] [Google Scholar]
- Ebel A, Soher BJ, Maudsley AA. Assessment of 3D 1H NMR echo-planar spectroscopic imaging using automated spectral analysis. Magn. Reson. Med. 2001;46:1072–1078. doi: 10.1002/mrm.1301. [DOI] [PubMed] [Google Scholar]
- Goryawala MZ, Sheriff S, Maudsley AA. Large volume spectral estimation of gray & white matter. ISMRM Workshop on MR Spectroscopy, Lake Constance. 2016 [Google Scholar]
- Govind V, Gold S, Kaliannan K, et al. Whole-brain proton MR spectroscopic imaging of mild-to-moderate traumatic brain injury and correlation with neuropsychological deficits. J. Neurotrauma. 2010;27:483–496. doi: 10.1089/neu.2009.1159. [DOI] [PMC free article] [PubMed] [Google Scholar]
- Govind V, Sharma KR, Maudsley AA, et al. Comprehensive Evaluation of Corticospinal Tract Metabolites in Amyotrophic Lateral Sclerosis Using Whole-Brain (1)H MR Spectroscopy. PLoS One. 2012;7:e35607. doi: 10.1371/journal.pone.0035607. 10.1371/journal.pone.0035607. [DOI] [PMC free article] [PubMed] [Google Scholar]
- Hayward JN, Baker MA. A Comparative Study of Role of Cerebral Arterial Blood in Regulation of Brain Temperature in 5 Mammals. Brain Res. 1969;16:417. doi: 10.1016/0006-8993(69)90236-4. Doi 10.1016/0006-8993(69)90236-4. [DOI] [PubMed] [Google Scholar]
- He X, Yablonskiy DA. Biophysical mechanisms of phase contrast in gradient echo MRI. Proc. Natl. Acad. Sci. USA. 2009;106:13558–13563. doi: 10.1073/pnas.0904899106. 10.1073/pnas.0904899106. [DOI] [PMC free article] [PubMed] [Google Scholar]
- Hirashima Y, Takaba M, Endo S, et al. Intracerebral temperature in patients with hydrocephalus of varying aetiology. J. Neurol. Neurosurg. Psychiatry. 1998;64:792–794. doi: 10.1136/jnnp.64.6.792. [DOI] [PMC free article] [PubMed] [Google Scholar]
- Karaszewski B, Wardlaw JM, Marshall I, et al. Measurement of brain temperature with magnetic resonance spectroscopy in acute ischemic stroke. Ann. Neurol. 2006;60:438–446. doi: 10.1002/ana.20957. [DOI] [PubMed] [Google Scholar]
- Kelly G. Body temperature variability (Part 1): a review of the history of body temperature and its variability due to site selection, biological rhythms, fitness, and aging. Altern. Med. Rev. 2006;11:278–293. [PubMed] [Google Scholar]
- Kuroda K, Takei N, Mulkern RV, et al. Feasibility of internally referenced brain temperature imaging with a metabolite signal. Magn. Reson. Med. Sci. 2003;2:17–22. doi: 10.2463/mrms.2.17. [DOI] [PubMed] [Google Scholar]
- Langkammer C, Krebs N, Goessler W, et al. Susceptibility induced gray-white matter MRI contrast in the human brain. Neuroimage. 2012;59:1413–1419. doi: 10.1016/j.neuroimage.2011.08.045. 10.1016/j.neuroimage.2011.08.045. [DOI] [PMC free article] [PubMed] [Google Scholar]
- Lee J, Shmueli K, Fukunaga M, et al. Sensitivity of MRI resonance frequency to the orientation of brain tissue microstructure. Proc. Natl. Acad. Sci. USA. 2010;107:5130–5135. doi: 10.1073/pnas.0910222107. 10.1073/pnas.0910222107. [DOI] [PMC free article] [PubMed] [Google Scholar]
- Li W, Wu B, Batrachenko A, et al. Differential developmental trajectories of magnetic susceptibility in human brain gray and white matter over the lifespan. Hum. Brain Mapp. 2014;35:2698–2713. doi: 10.1002/hbm.22360. 10.1002/hbm.22360. [DOI] [PMC free article] [PubMed] [Google Scholar]
- Lu SH, Dai YT. Normal body temperature and the effects of age, sex, ambient temperature and body mass index on normal oral temperature: A prospective, comparative study. Int. J. Nurs. Stud. 2009;46:661–668. doi: 10.1016/j.ijnurstu.2008.11.006. 10.1016/j.ijnurstu.2008.11.006. [DOI] [PubMed] [Google Scholar]
- MacMillan EL, Bolliger CS, Boesch C, et al. Influence of muscle fiber orientation on water and metabolite relaxation times, magnetization transfer, and visibility in human skeletal muscle. Magn. Reson. Med. 2016;75:1764–1770. doi: 10.1002/mrm.25778. 10.1002/mrm.25778. [DOI] [PubMed] [Google Scholar]
- Mandl RC, van den Heuvel MP, Klomp DW, et al. Tract-based magnetic resonance spectroscopy of the cingulum bundles at 7 T. Hum. Brain Mapp. 2012;33:1503–1511. doi: 10.1002/hbm.21302. 10.1002/hbm.21302. [DOI] [PMC free article] [PubMed] [Google Scholar]
- Mariak Z. Intracranial temperature recordings in human subjects. The contribution of the neurosurgeon to thermal physiology. J. Thermal Biol. 2002;27:219–228. [Google Scholar]
- Maudsley AA, Domenig C, Govind V, et al. Mapping of brain metabolite distributions by volumetric proton MR spectroscopic imaging (MRSI) Magn. Reson. Med. 2009;61:548–559. doi: 10.1002/mrm.21875. [DOI] [PMC free article] [PubMed] [Google Scholar]
- Maudsley AA, Domenig C, Ramsay RE, et al. Application of volumetric MR spectroscopic imaging for localization of neocortical epilepsy. Epilepsy Res. 2010a;88:127–138. doi: 10.1016/j.eplepsyres.2009.10.009. 10.1016/j.eplepsyres.2009.10.009. [DOI] [PMC free article] [PubMed] [Google Scholar]
- Maudsley AA, Domenig C, Sheriff S. Reproducibility of serial whole-brain MR spectroscopic imaging. NMR Biomed. 2010b;23:251–256. doi: 10.1002/nbm.1445. [DOI] [PMC free article] [PubMed] [Google Scholar]
- Mellergard P. Intracerebral Temperature in Neurosurgical Patients - Intracerebral Temperature-Gradients and Relationships to Consciousness Level. Surg. Neurol. 1995;43:91–95. doi: 10.1016/0090-3019(95)80049-m. Doi 10.1016/0090-3019(95)80049-M. [DOI] [PubMed] [Google Scholar]
- Metzger G, Hu X. Application of interlaced Fourier transform to echo-planar spectroscopic imaging. J. Magn. Reson. 1997;125:166–170. doi: 10.1006/jmre.1997.1114. [DOI] [PubMed] [Google Scholar]
- Oishi K, Faria A, Jiang H, et al. Atlas-based whole brain white matter analysis using large deformation diffeomorphic metric mapping: application to normal elderly and Alzheimer's disease participants. Neuroimage. 2009;46:486–499. doi: 10.1016/j.neuroimage.2009.01.002. [DOI] [PMC free article] [PubMed] [Google Scholar]
- Prakash KN, Verma SK, Marchenko Y, et al. Echo planar spectroscopic imaging based temperature calibration at 7T and 3T for whole brain temperature measurement in rodents and humans. International Society of Magnetic Resonance in Medicine, Milan. 2014 [Google Scholar]
- Prescot AP, Shi X, Choi C, et al. In vivo T(2) relaxation time measurement with echo-time averaging. NMR Biomed. 2014;27:863–869. doi: 10.1002/nbm.3115. 10.1002/nbm.3115. [DOI] [PMC free article] [PubMed] [Google Scholar]
- Sabati M, Sheriff S, Gu M, et al. Multivendor implementation and comparison of volumetric whole-brain echo-planar MR spectroscopic imaging. Magn. Reson. Med. 2015;74:1209–1220. doi: 10.1002/mrm.25510. 10.1002/mrm.25510. [DOI] [PMC free article] [PubMed] [Google Scholar]
- Soher BJ, Young K, Govindaraju V, et al. Automated spectral analysis III: Application to in vivo proton MR spectroscopy and spectroscopic imaging. Magn. Reson. Med. 1998;40:822–831. doi: 10.1002/mrm.1910400607. [DOI] [PubMed] [Google Scholar]
- Vescovo E, Levick A, Childs C, et al. High-precision calibration of MRS thermometry using validated temperature standards: effects of ionic strength and protein content on the calibration. NMR Biomed. 2013;26:213–223. doi: 10.1002/nbm.2840. 10.1002/nbm.2840. [DOI] [PubMed] [Google Scholar]
- H. Wang B, Normoyle KP, et al. Brain temperature and its fundamental properties: a review for clinical neuroscientists. Front. Neurosci. 2014;8 doi: 10.3389/fnins.2014.00307. 10.3389/fnins.2014.00307. [DOI] [PMC free article] [PubMed] [Google Scholar]
- Zhang Y, Brady M, Smith S. Segmentation of brain MR images through a hidden Markov random field model and the expectation-maximization algorithm. IEEE Trans. Med. Imag. 2001;20:45–57. doi: 10.1109/42.906424. [DOI] [PubMed] [Google Scholar]
- Zhu M, Ackerman JJ, Sukstanskii AL, et al. How the body controls brain temperature: the temperature shielding effect of cerebral blood flow. J Appl Physiol (1985) 2006;101:1481–1488. doi: 10.1152/japplphysiol.00319.2006. 10.1152/japplphysiol.00319.2006. [DOI] [PMC free article] [PubMed] [Google Scholar]
- Zhu M, Bashir A, Ackerman JJ, et al. Improved calibration technique for in vivo proton MRS thermometry for brain temperature measurement. Magn. Reson. Med. 2008;60:536–541. doi: 10.1002/mrm.21699. [DOI] [PMC free article] [PubMed] [Google Scholar]


