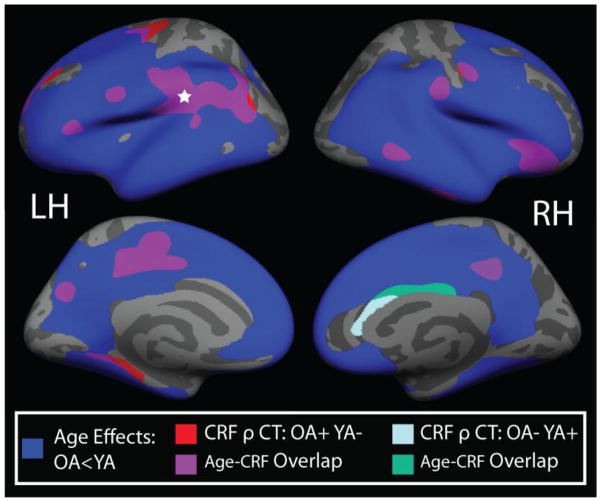
Figure 2.
Conjunction map demonstrating the spatial overlap between 1) age-group by peak VO2 interaction AND 2) age differences in cortical thickness (OA < YA). The blue label represents areas where cortical thickness was significantly lower in OA compared to YA. Red labels indicate regions where a significant interaction effect was noted such that CRF was positively associated with cortical thickness in OA, but negatively associated with thickness in YA. The light blue label represents regions where CRF was negatively associated with cortical thickness in OA, but positively associated with thickness in YA. Purple and green labels indicate regions of spatial overlap between the interaction effect and the age effects. All analyses controlled for sex and years of education, with a vertex-wise threshold of p<0.05. All age effects (blue labels) remained significant following cluster-based multiple comparison correction. For the CRF by age-group interaction analysis, the left supramarginal region (indicated by white star) remained significant following multiple comparison correction. LH=left hemisphere; RH=right hemisphere.

