

Abstract
Environmental contaminants pose a substantial health risk in many areas of the world. One of these risks is contamination of water with toxic organic species, such as herbicides and insecticides. Here we describe the discovery and properties of a set of fluorescent chemosensors that respond to micromolar concentrations of a broad range of common organic pesticides. The chemosensors are short DNA-like oligomers with fluorophores replacing DNA bases that are assembled via DNA synthesizer. We screened a library of 1296 tetrameric compounds on polystyrene microbeads, and identified a set of chemosensor sequences that respond strongly to a set of structurally varied pesticide analytes. We show that ten chemosensors on beads can be used to detect and identify 14 different common pesticides at 100 µM, using the pattern of fluorescence intensity and wavelength changes. Limits of detection for two analytes were as low as 2 µM. The chemosensors are shown to function successfully in a practical setting, correctly identifying unknown pesticide contaminants in water from Felt Lake, California. The results establish a simple, low cost strategy for sensing environmental spills of toxic organics.
Graphical abstract
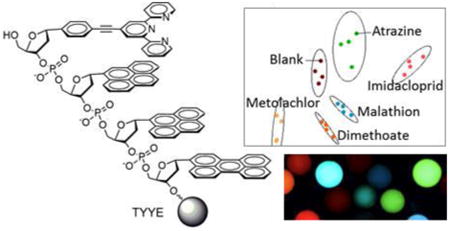
Fluorescent chemosensors built on a DNA backbone were able to differentiate micromolar levels of 14 different common pesticides in water.
Introduction
Over a million tonnes of pesticides are used in global agriculture each year. Indeed, an estimated 400 million kilograms were used in the United States alone in 2007, with projected increases of usage in the future.1 While many of these pesticides and herbicides have contributed positively to agricultural productivity, exposure to some of them from leaks and improper disposal also may pose risks to the environment, to agricultural workers and possibly to the general public. One serious example was a 1991 spill of 19,000 gallons of a pesticide concentrate into the Sacramento River,2 and more recently, contamination of multiple drinking water sources in the Mekong Delta have been documented.3 Thus, environmental analysis near sites of manufacture, transport, storage and use of pesticides can serve as a first line of defense against unwanted environmental damage and health effects from inappropriate use of pesticides.4 Analysis of these compounds in water and soil near such sites can provide helpful information about appropriate use, and can aid in remediation of accidental spills. Because some pesticides are often used together in cocktail form5 and the long-term health effects of prolonged exposure is unknown for many,6 not only is detection needed, but analytical methods that can differentiate among many different pesticides are also important.
The current established methods of analysis of such aqueous insecticides and herbicides include high performance liquid chromatography/mass spectrometry (LC-MS) and gas chromatography.7-10 The methods are sensitive, but relatively time-consuming, and the samples need to be transported to a centralized laboratory where trained technicians can perform the analyses. Thus there would be merit to developing rapid, effective sensing methods for such compounds that have the potential to be used directly in the field. This may be useful for detecting leaks in the field and at pesticide storage sites and places of use, rapidly identifying any accidental spills or misguided use, and guiding remediation of contaminated sites.
As an alternative approach to conventional analysis of environmental contaminants, optical methods show promise, as they can be rapid, sensitive, and potentially portable and automatable.11-16 However, to date, the literature shows only a handful of examples of pesticide detection using optical chemosensing approaches. In one example, Kamel recently reported the detection of Phosdrin by its quenching of luminescence of lanthanide - coumarin complexes.11 In a second study, the same group distinguished three pesticides with a Eu(III) luminescent complex in solution by time-resolved fluorescence.12 A third recent study by Xu and coworkers used a molybdate/vanadate/luminol assay to detect orthophosphate decomposition products of organophosphate pesticides.13 In general, studies to date have been limited to detection of a small number of compounds, in part because (in most cases) only a certain class of functional group is recognized, and for luminescence detection, responses have been limited to a quenching signal at a single wavelength. Challenges in this field include the development of strategies that can be effective with a wide range of chemical species, and that generate broader optical responses than simple quenching. In general, the chemical recognition of organic compounds in aqueous media is challenging, as water strongly competes for polar and electrostatic interactions between analytes and chemosensors.17
Here we describe the use of oligomeric fluorophores assembled on a DNA backbone as diverse optical chemosensors of pesticides. These DNA-like oligomers, termed oligodeoxyfluorosides (ODFs), are assembled rapidly via DNA synthesizer in thousands of sequences.18,19 Replacement of conventional DNA bases with fluorophores results in closely packed emissive assemblies that exhibit complex energy transfer phenomena between the chromophores, rendering them highly sensitive to their environment.20-23 This complexity results in fluorescence emission across the visible spectrum, and optical responses including not only quenching, but also lighting up and color changes. We show that a set of only ten such chemosensors can be used to distinguish 14 different structurally varied insecticides and herbicides as micromolar-level contaminants in water.
Results
Analytes and chemosensors
Pesticides used in this study were selected because they are partially or readily water-soluble, include a variety of functional groups as a set, and are based on their popularity of use and potential acute and long-term health effects (Table 1).1 Structures of the compounds vary widely, although there are a few chemical similarities. For example, there are five organophosphate/phosphonate compounds, two 1,3,5-triazine derivatives, and multiple chlorinated aryl species. Four of the pesticides include anionic functional groups such as phosphates and carboxylic acids. Notably, this set of compounds varies considerably more widely in structure than prior chemosensing studies aimed at pesticide detection.11-16 Differentiation of more than a handful of pesticides using optical methods is unprecedented.
Table 1.
Pesticide analytes in this study. Names, abbreviations, and estimated solubilities are shown.
| Name and abbreviation | Structure | Solubility in water (μ M, approximate) |
|---|---|---|
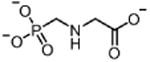
| Glyphosate GLY (herbicide) |
|
60 000 |
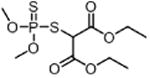
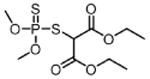
| Dimethoate DIM (insecticide) |
|
110 000 |
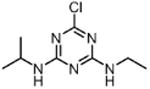
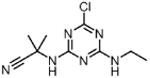
| Atrazine ATR (herbicide) |
|
320 |
| Cyanazine CYA (herbicide) |
|
830 |
| DCMU (Diuron) (herbicide) |
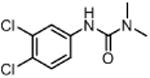
|
180 |
| Imidacloprid Ml (insecticide) |
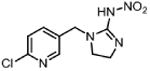
|
1990 |
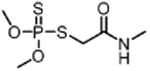
| Malathion MAL (insecticide) |
|
440 |
| Imazethapyr IMA (herbicide) |
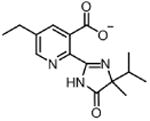
|
480 000 |
| Mecoprop-p MEC (herbicide) |
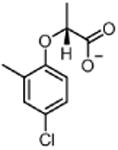
|
4 200 |
| 2,4-D 24D (herbicide) |
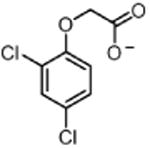
|
4100 |
| Trifluralin TRI (herbicide) |
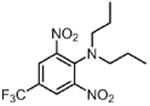
|
100 |
| Paraquat PAR (herbicide) |
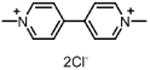
|
High |
| Metolachlor MET (herbicide) |
|
1900 |
| Carbaryl CAR (insecticide) |
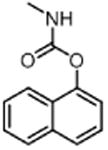
|
50 |
| Acephate ACE (insecticide) |
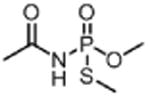
|
4 300 000 |
The maximum solubilities in water (values taken from product labels and Material Safety Data Sheets) fall generally in the millimolar or micromolar ranges. While the concentration of these pesticides used during application may vary, many of them would be applied at low millimolar to high micromolar ranges, judging by recommendations from the product labels and directions of use for common pesticides such as glyphosate, paraquat, and dimethoate. Therefore we chose 100 µM for initial testing of these fifteen pesticides to emulate actual concentrations used in application.
As potential chemosensors for these compounds in water, we selected with a class of ODF compounds previously shown to function in water for fluorescence-based sensing of inorganic anions.24 These compounds were chosen because the analytes contain many charged and polar residues; although ODFs have been employed previously for sensing of inorganic cations and anions in water, they have not been tested previously for chemosensing of organic species in solution. Notably, only four of the current analytes are anionic. The potential chemosensor molecules contain combinations of five fluorescent chromophores, including two known fluorescent metal-binding ligands (Fig. 1). By addition of ZnII and YIII to these oligomers, it was hypothesized that metals might enhance affinity for some of these polar compounds, particular in the case of anionic analytes.24 In addition, we hypothesized that hydrophobic aromatic structure of some ODF components might also provide favourable noncovalent interactions with some of the analytes. In general, interactions of the analytes with the fluorescent oligomers were expected to perturb the electronic interactions in some of the sequences, thus reporting on their presence in solution. To identify especially strongly-responding compounds, we synthesized a library of 1296 tetramers containing all possible combinations of the six components. The library was prepared by standard split-and-mix methods (see Supporting Information (SI)), resulting in a single ODF sequence on each bead. We tested this library alone, and also after pre-incubation with ZnII and YIII, shown previously to enhance fluorescence and provide useful responses to inorganic anions.24
Figure 1.
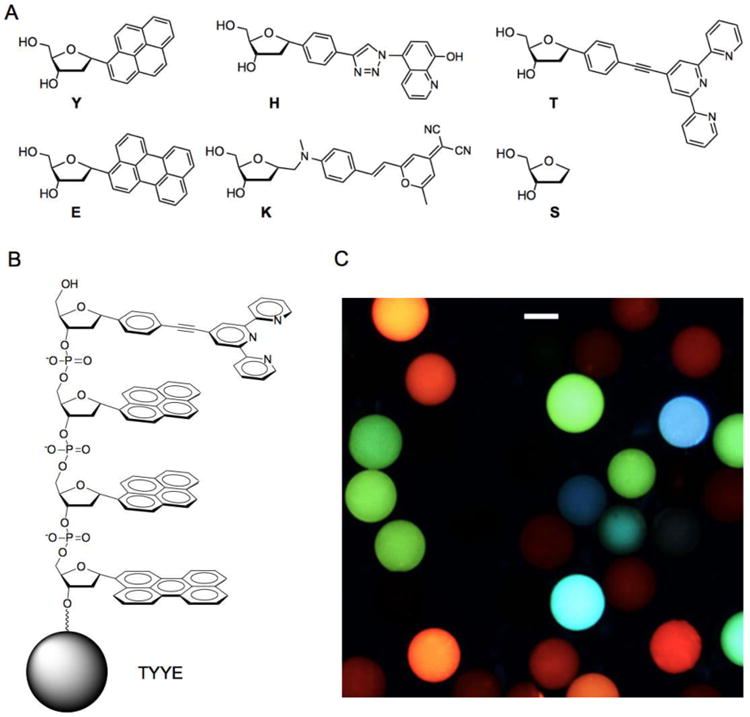
Oligodeoxyfluoroside (ODF) components and oligomers in this study. (A) Monomer deoxyribosides with one-letter abbreviations. (B) Example ODF tetramer sequence (TYYE) on PEG-polystyrene bead. (C) Image of ODF chemosensor beads from current library imaged by epifluorescence microscopy (λex 340-380 nm; emission >420nm). (Scale bar: 100 µm; beads are 130 µm in size).
Screening the ODF library for chemosensor candidates
We screened the library to identify strong responders to pesticides, separately exposing library beads to single analyte compounds (100 µM in Tris buffer pH 8, 30 min). Epifluorescence microscopy images were taken before and after pesticide introduction (see Supporting Information for detailed methods), and the color/intensity value changes of the beads over 15-pixel square boxes centered on each bead image were examined in rapid fashion by automatically extracting RGB values with digital imaging software. Beads with relatively large changes in intensity and unusual/pronounced color shifts (ΔRGB) were prioritized and selected. ODF sequences on these beads were individually identified by electron-capture gas chromatography as described (SI).25 By this approach, 28 candidate chemosensor ODFs were identified for the fifteen pesticides in aqueous solution.
To repeat, reconfirm and quantify these preliminary responses, the twenty-eight candidate ODFs were then individually synthesized on preparative scales on a DNA synthesizer (Table S2; Fig. S3). Small portions released from solid support were characterized in solution by MALDI-TOF mass spectrometry as well as by their absorption and emission spectra (SI Table S2, Figs. S1, S2). Fluorescence emission wavelengths range from 370 to 600 nm. The majority of each sample was retained on PEG-PS beads for further chemosensing studies. Examination of microbeads containing these 28 ODFs showed a wide span of emission brightness and wavelength (Fig. S3), with strong variations in color from blue through red at the single long-wavelength UV excitation (Fig. 1C).
Cross-screening of ODF chemosensors and the target pesticides
The original 28 chemosensor candidates were chosen based on responses of each to a single analyte. Since our goal was the use of pattern-based sensing using a smaller set of sensor compounds, it was necessary to test all ODF chemosensors with all analytes to determine which ODFs show the most effective differentiation between analytes. Thus all twenty-eight chemosensors on beads were cross-tested with the fifteen pesticides (100 µM), using at least four beads of each sequence (i.e. four measurements) to confirm differences within error limits. The numerical data (ΔRGB values) are given as plots in the Supporting Information (Fig. S4). Examination of the color changes reveals examples of quenching, light-up,and color changes. For example, glyphosate causes strong quenching of the chemosensor TYYE in all three color channels, while carbaryl produces a light-up response in the same chemosensor. On the other hand, paraquat causes a color change in the chemosensor ESKY, selectively quenching the red band while leaving the blue/green emission unchanged.
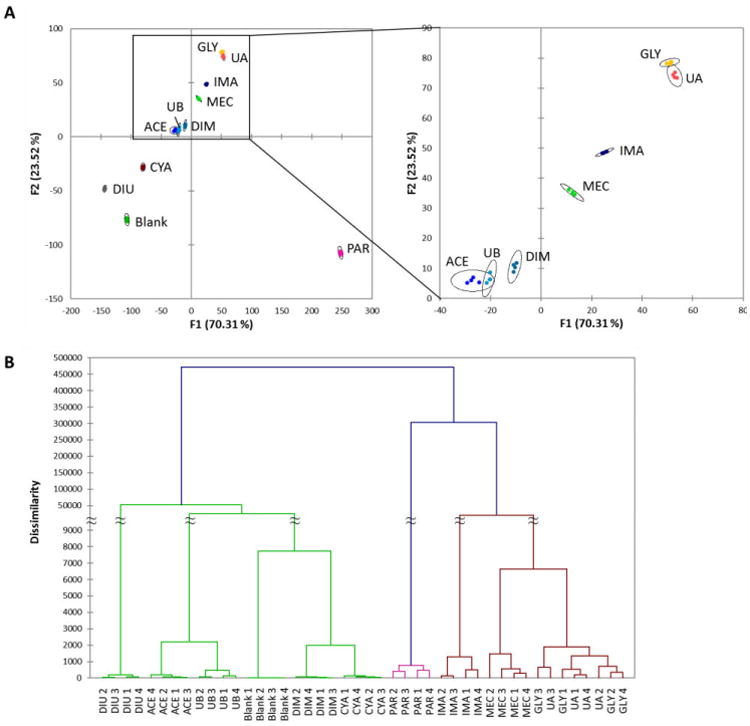
Discriminant analysis (DA) of the entire data set was carried out to measure the discriminating power of the ODFs with these analytes. A multi-dimensional DA scatter plot displayed complete differentiation of all the pesticides from each other at 100 µM and to the blank buffer (see the two main axes plotted in Fig. 2). The data show high reproducibility, with each of four repetitions overlapping on the plot. Agglomerative Hierarchical Clustering analysis (AHC), which correlates responses in families of similarity, showed analagous results based on groups of dissimilarity, separating all measurements completely except for 2,4-D and atrazine, which showed overlap on one response out of four. The quantitative response profiles for these two pesticides (see Fig. S4) were similar but with noticeable differences such as significantly stronger quenching responses from TSSS-ZnII, TSSS-YIII, and TYSY to 2,4-D compared to atrazine.
Figure 2.
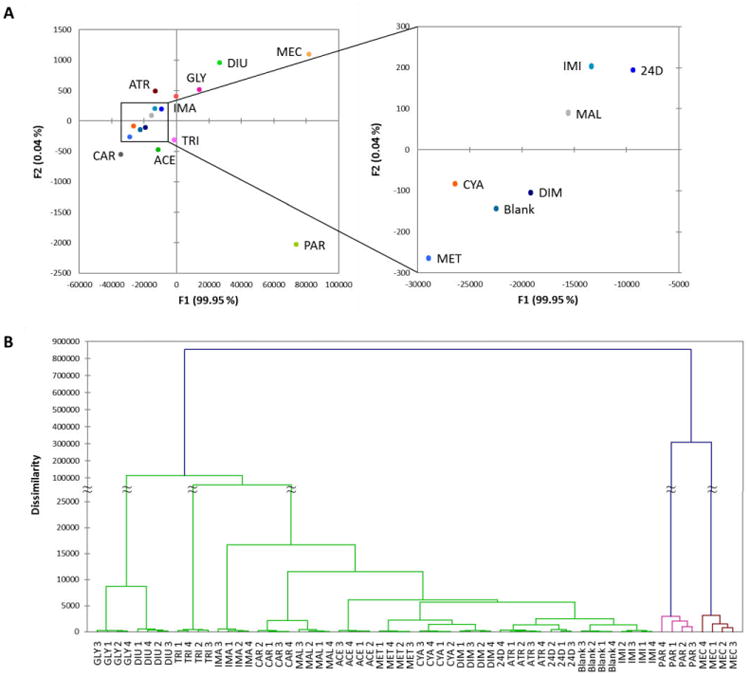
Performance of 28 candidate ODF chemosensors. (A) Discriminant analysis (DA) of the 28 screened ODFs on beads versus fifteen pesticides at 100 µM in buffered water. Data are ΔRGB values before and after exposure. Left: Paraquat and mecoprop-P were well separated from the rest due to their large quenching effects. Right: Scale adjusted to focus on the cluster of pesticides. All fifteen pesticides were fully discriminated. Four individual replicate data points and 95% confidence ellipsoids are too small to be distinguished on this scale. (B) Agglomerative hierarchical clustering (AHC) of the same data. All replicates were grouped together correctly in all four replicates except for atrazine and 2,4-D, which were less well distinguished by this set (one overlapping measurement).
Paraquat and mecoprop-P induced relatively large (but differential) quenching effects for most of the chemosensors tested, leading to large separation from the rest of the pesticides in DA and the greatest dissimilarities in AHC. It was interesting to note that the quenching profiles of these two divergent structures (Table 1) were significantly different (Fig. S4). For example, the ODF sensor TSSS-ZnII was quenched in the presence of mecoprop-P but not paraquat, while SSSY, SYYE-ZnII, and YSYY were quenched strongly in the presence of paraquat but only weakly in the presence of mecoprop-P. Paraquat is a well-known fluorescence quencher,26 but mecoprop-P was apparently not previously known for that property. The data suggest that electronic matching of analytes with chemosensors is important, underscoring the utility of full cross-screening and the use of a diverse library approach to finding effective chemosensors.
During the library screening, beads with interesting emission properties were selected, decoded and subsequently resynthesized to study their photophysical properties in more detail. The synthesis was done on 3′-phosphate CPG to yield ODFs with an additional phosphate group at the 3′ end to enhance water solubility. As with DNA, ODF sequences are named by using one-letter abbreviations (5′ to 3′ convention, Fig. 1).
Comparisons of similar chemosensors
To gain some insight into the molecular behaviour of the chemosensors, we examined a number of the sensors having similarities in sequence or composition in more detail. Two sets of ODFs chosen in our blind screen had isomeric structures (they are sequence anagrams), presumably because they share the ability to respond strongly to an analyte. For example, the two chemical isomers EHHS and SHEH, which contain the same chromophores in different order, showed remarkably similar response patterns (Fig. S5), suggesting that the sequence of the monomers for this composition does not play a large role in dictating the overall sensing behaviour. However, for the three isomers HSYY-YIII, SYYH-YIII, and YHSY-YIII there were some small but significant differences (Fig. S5); some of these chemosensors were quenched and others showed lighting-up responses when exposed to glyphosate and carbaryl, suggesting the importance of cooperative behaviour of neighboring chromophores for differentiating some analytes.
Next, we compared responses of three pairs of chemosensors with the same sequence but with different metals (or no metals) (HSYY-ZnII and HSYY-YIII; SYYH and SYYH-YIII; and TSSS-ZnII and TSSS-YIII). HSYY-ZnII and HSYY-YIII showed similar response profiles except for reversed quenching effects with paraquat and trifluralin (Fig. S6). Thus, the inclusion of metal proved useful for differentiation of these two pesticides. For the other two pairs of chemosensors, the general response profiles were markedly different. This was likely due to the significantly different initial fluorescence colors after metal incorporation (Fig. S3) as well as the presence of the metal influencing the response behaviour.
Reduction to a minimal 10-chemosensor set
Although the 28-chemosensor set was able to discriminate all analytes effectively, it would be useful in future applications if fewer chemosensors could be used, since it would require a considerable reduction in labor and cost in use. To simplify this endeavour, we removed one analyte (2,4-D) from the analyte list because of its close responses to those of atrazine. With the remaining fourteen analytes, we then proceeded to eliminate redundancy and less effective discriminators from the chemosensor set by removing sequences that had close similarities in the AHC plot with others. We were able to cut the chemosensor set to a final list of ten ODFs that still retained full differentiation of the fourteen analytes in the DA and AHC analysis (Fig. 3). No other ten-sensor sets or smaller sets tested in our studies were able to achieve this analytical separation.
Figure 3.
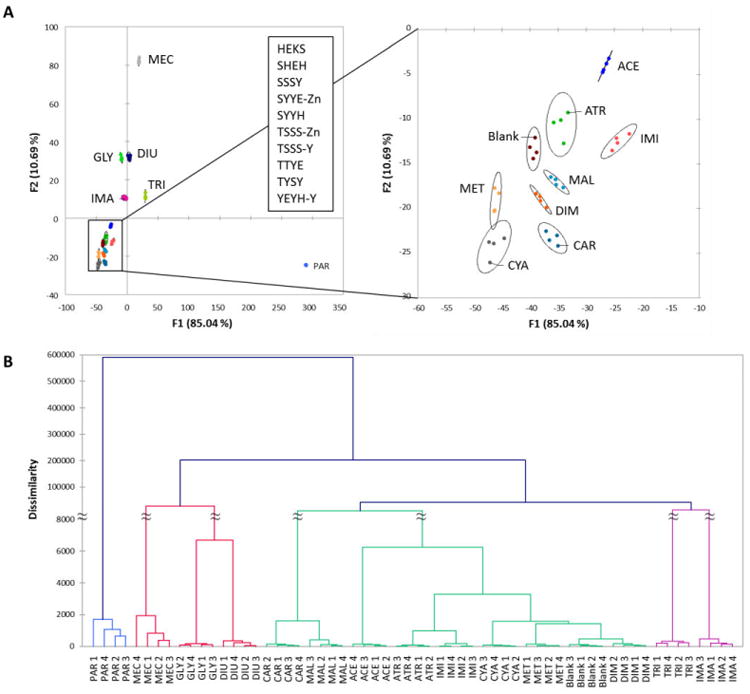
Performance of minimized ten-ODF chemosensor set in discriminating 14 pesticides. (A) DA plots of the reduced ten-sensor set (see inset for list) showing differentiation of the fourteen pesticides by measuring ΔRGB (100 µM in buffered water). Inset on right uses enlarged scales to show the cluster of pesticides (right). Ellipses represent 95 % confidence levels around the centroids of four replicate points. (B) AHC analysis showing correct categorization of the four replicates of all fifteen pesticides. See Table 1 for abbreviations. Note that the DA plot shows a minor overlap in the 95 % confidence ellipses of metolachlor and cyanazine, but these are resolved when plotting against the third DA axis (not shown; only the two strongest-contributing dimensions are plotted here).
Analyte quantification tests using reduced chemosensor sets
The ten-ODF set on beads was tested for its limit of detection to representative pesticides as well as its ability to quantify unknown concentrations using standard concentrations. First, the strong quencher paraquat was tested using standard concentrations ranging from 0 to 100 µM and three unknown concentrations within the range of the standards. The numerical data are presented in the Supporting Information (Fig. S7). Plotting smooth curves though the calibration centroid points (not shown) yielded a good deal of scatter and poor correlation of unknowns with the calibration points, because the data combine responses from a broad set of sensors that vary in different dimensions with change in analyte concentration. This complex multidemensional behaviour makes calibrations of concentration difficult.24
Following a strategy used earlier,24 we simplified the responses of the chemosensor calibration standards by using a smaller set of chemosensors that displayed a monotonic change of ΔRGB versus concentration (Fig. 4A). Using only these two chemosensors, the calibration curve was smoother, and the unknowns fell close to the curve. The concentration calls of the unknowns UA, UB, and UC were 1.1, 18, and 2.4 µM, respectively, and the actual concentrations were 1.0, 15, and 2.0 µM respectively. Based on these measurements, the limit of detection was determined to be 2 µM or below, since the numerical data for this experiment showed significant differential from blank response.
Figure 4.
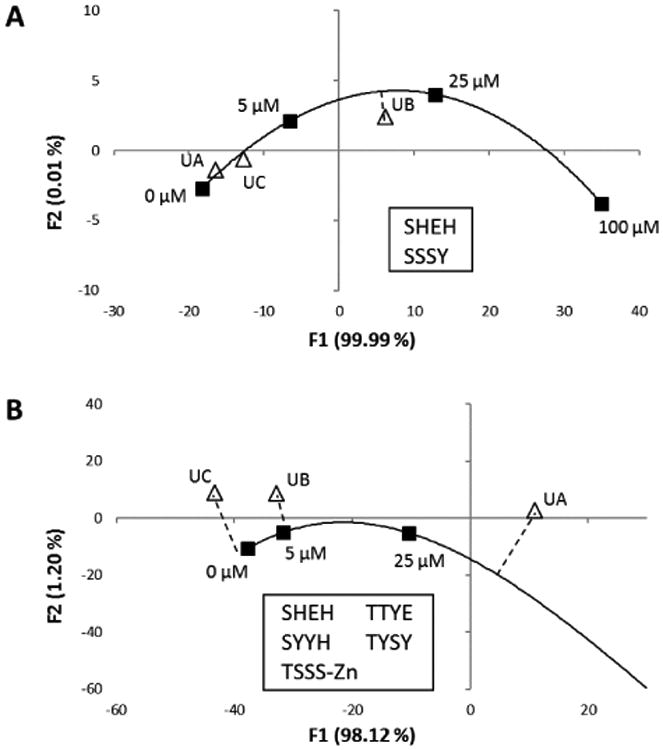
DA analysis of unknown concentration samples for paraquat and glyphosate using calibration plots generated by concentration standards noted on the figure. (A) Optimized two-sensor set for determining concentrations of paraquat. Known/measured concentrations are: UA(1.0/1.1 µM); UB (15/18 µM); UC (2.0/2.4 µM). (B) Optimized five-sensor set for determining concentrations of glyphosate. Known/measured concentrations are: UA(40/30 µM); UB (10/5 µM); UC (3.0/0 µM). Centroids of four trials performed were plotted (black squares), and calibration curves were plotted using a best-fit smooth curve. Unknown concentrations (white triangles representing centroid of four trials) were compared with interpolation using shortest orthogonal line to the curves.
A similar testing of samples with unknown concentrations of glyphosate was performed (Fig. S8). Using a reduced set of five sensors that showed linear changes of response in ΔRGB (Fig. 4B), the concentration calls of the unknowns UA, UB, and UC were 30, 5, and 0 µM, respectively, and the actual concentrations were 40, 10, and 3.0 µM respectively. Thus, the detection limit for glyphosate appears to be 10 µM or below.
Discrimination and identification of unknown pesticides in Felt Lake water
The above studies were performed in purified water with carefully controlled buffer, raising the question of whether the discriminating power of the ODF chemosensors would be retained in measurements of real-world water contamination. Lakes and streams can contain substantial backgrounds of dissolved minerals and organics that could potentially interfere with chemosensor responses. As an initial test of this question, we examined the performance of the ten-chemosensor set in discriminating a selected set of eight of the above pesticide analytes in the water of Felt Lake, a local semi-rural body of water with runoff from cattle grazing. Numerical data are given in Fig. S9.
Testing the eight analytes at 100 µM showed clear discrimination as seen in the DA map (Fig. 5A), with large separation of the 95% confidence ellipses from one another for all analytes over the four tests of each. While there were some pattern similarities with the sensing in purified buffer (compare Figs. 5A, 3A), there were some differences; for example, diuron (DIU) showed large separation from the blank water specimen in the buffered water, whereas in the lake water specimen it fell relatively closer. Notably, the most important difference in this lake water sample was improved analyte discrimination. The average separation between 95% confidence ellipsoids was several-fold greater in the lake water (compare Figs. 3a, 5a). Although the reason for the better discrimination is unclear at present, it may come from improved reproducibility (allowing closer grouping of repeat data), and/or from more strongly varied fluorescence responses.
Figure 5.
Sensing pesticides in the water of Felt Lake. (A) DA plot of responses of 10 ODFs to 8 known pesticides, along with 2 unknown samples, at 100 µM. See overlap of 95% confidence ellipsoids for unknown A with glyphosate and unknown B with acephate. Numerical data are plotted in the Supporting Information (Fig. S9). (B) HCA classification of families of responses by dissimilarity, showing that unknowns (UA, UB) are classified most closely with the correct known standards. Numbers 1-4 refer to data from each of four beads.
Given the effective discrimination of these eight analytes with a map of optical responses, we then proceeded to use this as a calibration/training set for unknowns in this real-world water setting. We tested the ten-chemosensor set with two unknown analytes at 100 µM, and plotted them with the above set of knowns in the discriminant analysis (DA) map. The data from four beads each are plotted in Fig. 5. Unknown A maps very closely with glyphosate in the response DA map, with overlapping 95% confidence ellipses, allowing us to assign this unknown as glyphosate, a correct call. The co-classification of the unknown in the HCA plot (Fig. 5B) also confirms this. Similarly, unknown B overlaps in its responses with those of acephate, leading to its correct identification as well. Thus the data show that in these initial tests of unknowns, the reproducibility and differentiation power of the ODF chemosensors were sufficient to identify unknown contaminants.
Discussion
Our data show that chemosensors built from assembled fluorophores can be effective in detecting and discriminating a broad structural range of organic pesticides in aqueous solution. The close chromophore assembly on the DNA backbone renders such compounds sensitive to the environment, and they can respond to analytes with significant and reproducible changes in fluorescence intensity and wavelength. Using this approach, we have shown that a set of 10 oligodeoxyfluoroside chemosensors on polystyrene microbeads can distinguish 14 different pesticides and herbicides at 100 micromolar concentrations. The reproducibility of the measurements is sufficient to allow relatively large separation of analytes. We have further shown that the chemosensors can function effectively in an authentic lake water sample, enabling the identification of unknown pesticide analytes, and that concentrations can be measured quantitatively down to low micromolar levels. These initial data suggest that there is potential promise in the use of such compounds in practical environmental monitoring.
Previous studies on optical sensing of pesticides were carried out with relatively small numbers of analytes having limited structural variation. Kamel has studied Eu(III)-coumarin complex for chemosensing two organophosphates and one polychlorinated compound;12 a more recent study showed that a Tb(III)-coumarin complex yielded quenching responses for an organophosphate compound, but did not show responses for five other compounds that were tested.11 A different approach by Galban used optical measurements of horseradish peroxidase heme chromophore during pesticide degradation by peroxide;14 in that study four pesticides (three organophosphorus and one sulfamate) were tested. Using such an approach, discrimination between species would be difficult as the optical response (absorption bands of heme) is the same. Another recent approach by Xu detected organophosphate compounds by prior oxidative degradation to orthophosphate, which was detected with molybdate/vanadate and luminol.13 This method is limited to organophosphates only, and would be difficult to apply to more than a small number of different species since the same chemiluminescence signal is measured. Designed molecular approaches have been explored; for example, Delattre reported a tripodal cyclodextrin that yielded fluorescence quenching in the presence of four pesticides in acetonitrile,27 while Huggins and Wallace described a dipyrrinone oximate that reacts specifically with organophosphate pesticides in very strong base/DMSO solution to produce a colorimetric response.28 Such nonaqueous conditions may have limited utility in evaluating water contamination. To our knowledge, the only prior use of chemosensor arrays was described by Bonizzoni, who used commercial dyes in PAMAM dendrimers to distinguish one pesticide from methyl phosphate and inorganic phosphate in water.29
In general, prior pesticide chemosensing methods have been limited to a single optical response; by contrast, the current approach offers measurements at multiple wavelengths and presents both increases and decreases in intensity as well as color changes. The mechanisms by which analytes affect the fluorescence of the ODFs are likely complex because the chemosensors themselves have complex photophysical behaviour. Regardless of the mechanisms, we suggest that this diversity of responses makes the determination of a wider variety of chemical analytes much more feasible, demonstrated here by discrimination of 14 species. In addition, previous approaches have in most cases required a one-at-a-time trial-and-error approach to identifying compounds that are sensitive to pesticides, whereas the current combinatorial screening approach rapidly identifies effective chemosensors from a relatively large library of fluorophores.
The current strategy, using ODF chemosensors on microbeads, offers a number of additional advantages over other molecular sensing methods for detection of pesticides. A feature of pattern-based sensing over individual fluorescent sensors is that it enables the discrimination of a greater number of analytes than actual chemosensor compounds, thus providing economy of preparation and application. Moreover, the use of the repeating oligonucleotide backbone allows us to assemble all ten of the current chemosensors from only five synthetic monomers using an automated synthesizer. A standard one-micromole scale synthesis on a DNA synthesizer produces approximately 30,000 beads containing a given ODF. This is sufficient for over 5000 experiments; thus the cost of this chemosensing approach is very low (less than one dollar per experiment). A single ODF bead contains ca. 30 picomoles of fluorescent compound. This compares very favorably with the use of synthetic chemosensors in solution, which may require 100-1000-fold more material. Another favorable aspect of this approach is its potential for automated use: in principle, one might construct chips containing arrays of chemosensors on microbeads, and read them with a simple portable optical device containing an LED light source and imaging software.30 Future work will be necessary to explore such an approach. Also of interest would be the analysis of mixtures of pesticide contaminants, and testing in other types of water samples.
Although our ODF chemosensors have demonstrated significantly greater discriminating power than prior optical approaches for pesticide analysis, sensitivity is not as high as the classical instrumental approaches. Analytical techniques such as HPLC–MS exhibit sensitivity down to nanomolar concentrations. Thus the current utility of the ODF chemosensing of pesticides is best applied to standing water near sites of use where products may accumulate over time, and to accidental spills and releases of concentrated stock and storage solutions, rather than low-concentration, chronic contamination events. Future work will be aimed at increasing the sensitivity of this approach using flow-based concentration strategies.23,31
Conclusion
We have described an effective approach to rapid discovery of effective fluorescent chemosensors for a broad range of pesticides in water. Use of the DNA backbone to assemble fluorophores results in diverse optical changes in response to micromolar concentrations of dissolved organics. The data show that a set of ten chemosensors on microbeads can be used to discriminate fourteen different pesticides of several structural classes. The approach functions with high reproducibility in lake water, and correctly identifies unknown contaminants.
Supplementary Material
Acknowledgments
We thank Eni SpA and the U.S. National Institutes of Health (GM067201) for support.
Footnotes
Electronic Supplementary Information (ESI) available: Experimental and spectral data for all new compounds as well as details on the synthesis an d screening of the combinatorial library. See DOI: 10.1039/x0xx00000x
Notes and references
- 1.Gilliom RJ. Environmental Science & Technology. 2007:3409–3414. doi: 10.1021/es072531u. [DOI] [PubMed] [Google Scholar]; Gilliom RJ, Barbash JE, Kolpin DW, Larson SJ. Environmental Science & Technology. 1999:164–169. doi: 10.1021/es992770k. [DOI] [PubMed] [Google Scholar]
- 2.Kreutzer RA, Hewitt DJ, Sun R, Draper W, Mangiamele D, Goldman L, Jackson R, Smith D, Shusterman D. Toxicol Ind Health. 1996;12:267–275. [PubMed] [Google Scholar]
- 3.Chau ND, Sebesvari Z, Amelung W, Renaud FG. Environ Sci Pollut Res Int. 2015;22:9042–9058. doi: 10.1007/s11356-014-4034-x. [DOI] [PubMed] [Google Scholar]
- 4.Stone WW, Gilliom RJ, Martin JD. Scientific Investigations Report 2014-5154. U.S Geological Survey; Washington, DC: 2014. An Overview Comparing Results from Two Decades of Monitoring for Pesticides in the Nation's Streams and Rivers, 1992–2001 and 2002–2011. [Google Scholar]
- 5.Relyea RA. Oecologia. 2009;159:363–376. doi: 10.1007/s00442-008-1213-9. [DOI] [PubMed] [Google Scholar]
- 6.Hayes TB, Case P, Chui S, Chung D, Haeffele C, Houston K, Lee M, Mai VP, Marjuoa Y, Parker J, Tsui M. Env Health Perspect. 2006;114:40–50. doi: 10.1289/ehp.8051. [DOI] [PMC free article] [PubMed] [Google Scholar]
- 7.Sennert S, Volmer D, Levsen K, Wunsch G. Fresen J Anal Chem. 1995;351:642–649. [Google Scholar]
- 8.Carvalho JJ, Jerónimo PCA, Gonçalves C, Alpendurada MF. Anal Bioanal Chem. 2008;392:955–968. doi: 10.1007/s00216-008-2328-x. [DOI] [PubMed] [Google Scholar]
- 9.Coulson DM, Cavanagh LA, Stuart J. Agric Food Chem. 1959;7:250–251. [Google Scholar]
- 10.Pérez JJ, Williams MK, Weerasekera G, Smith K, Whyatt RM, Needham LL, Barr DB. J Chromatogr B. 2010;878:2554–2562. doi: 10.1016/j.jchromb.2010.03.015. [DOI] [PMC free article] [PubMed] [Google Scholar]
- 11.Hussein BH, Khairy GM, Kamel RM. Spectrochim Acta A. 2016;158:34–42. doi: 10.1016/j.saa.2016.01.008. [DOI] [PubMed] [Google Scholar]
- 12.Azab HA, Khairy GM, Kamel RM. Spectrochim Acta A. 2015;148:114–124. doi: 10.1016/j.saa.2015.03.098. [DOI] [PubMed] [Google Scholar]
- 13.Baoxin A, Yuezhen H, Chunli X. Chem Phys Lett. 2008;460:187–190. [Google Scholar]
- 14.de Marcos S, Callizo E, Mateos E, Galbán J. Talanta. 2014;122:251–256. doi: 10.1016/j.talanta.2014.01.011. [DOI] [PubMed] [Google Scholar]
- 15.Dasary SSR, Rai US, Yu H, Anjaneyulu Y, Dubey M, Ray PC. Chem Phys Lett. 2008;460:187–190. doi: 10.1016/j.cplett.2008.05.082. [DOI] [PMC free article] [PubMed] [Google Scholar]
- 16.Southard GE, Van Houten KA, Ott EW, Jr, Murray GM. Talanta. 2007;581:202–207. doi: 10.1016/j.aca.2006.08.027. [DOI] [PubMed] [Google Scholar]
- 17.Langton MJ, Serpell CJ, Beer PD. Angew, Chem Int Ed. 2016;55:1974–1987. doi: 10.1002/anie.201506589. [DOI] [PMC free article] [PubMed] [Google Scholar]
- 18.Gao J, Strässler C, Tahmassebi D, Kool ET. J Am Chem Soc. 2002;124:11590–11591. doi: 10.1021/ja027197a. [DOI] [PubMed] [Google Scholar]
- 19.Wilson JN, Kool ET. Org Biomol Chem. 2006;4:4265–4274. doi: 10.1039/b612284c. [DOI] [PubMed] [Google Scholar]
- 20.Gao J, Watanabe S, Kool ET. J Am Chem Soc. 2004;126:12748–12749. doi: 10.1021/ja046910o. [DOI] [PubMed] [Google Scholar]
- 21.Samain F, Dai N, Kool ET. Chem Eur J. 2011;17:174–183. doi: 10.1002/chem.201002836. [DOI] [PMC free article] [PubMed] [Google Scholar]
- 22.Yuen LH, Franzini RM, Tan SS, Kool ET. J Am Chem Soc. 2014;136:14576–14582. doi: 10.1021/ja507932a. [DOI] [PMC free article] [PubMed] [Google Scholar]
- 23.Jiang W, Wang S, Yuen LH, Kwon H, Ono T, Kool ET. Chem Sci. 2013;4:3184–3190. doi: 10.1039/C3SC50985K. [DOI] [PMC free article] [PubMed] [Google Scholar]
- 24.Kwon H, Jiang W, Kool ET. Chem Sci. 2015;6:2575–2583. doi: 10.1039/c4sc03992k. [DOI] [PMC free article] [PubMed] [Google Scholar]
- 25.Ohlmeyer MH, Swanson M, Dillard LW, Reader JC, Asouline G, Kobayashi R, Wigler M, Still WC. Proc Natl Acad Sci U S A. 1993;90:10922–10926. doi: 10.1073/pnas.90.23.10922. [DOI] [PMC free article] [PubMed] [Google Scholar]; Nestler HP, Barlett PA, Still WC. J Org Chem. 1994;59:4723–4724. [Google Scholar]
- 26.Cosa JJ, Gsponer HE, Previtali CM. J Photochem. 1982;19:271–275. [Google Scholar]
- 27.Mallard-Favier I, Blach P, Cazier F, Delattre F. Carbohydr Res. 2009;344:161–166. doi: 10.1016/j.carres.2008.10.014. [DOI] [PubMed] [Google Scholar]
- 28.Walton I, Davis M, Munro L, Catalano VJ, Cragg PJ, Huggins MT, Wallace KJ. Org Lett. 2012;14:2686–2689. doi: 10.1021/ol300799f. [DOI] [PubMed] [Google Scholar]
- 29.Liu Y, Bonizzoni M. J Am Chem Soc. 2014;136:14223–14229. doi: 10.1021/ja507905r. [DOI] [PubMed] [Google Scholar]
- 30.Breslauer DN, Maamari RN, Switz NA, Lam WA, Fletcher DA. Plos One. 2009;4:e6320. doi: 10.1371/journal.pone.0006320. [DOI] [PMC free article] [PubMed] [Google Scholar]
- 31.LaGasse MK, Rankin JM, Askim JR, Suslick KS. Sensor Actuat B-Chem. 197;5:116–122. [Google Scholar]
Associated Data
This section collects any data citations, data availability statements, or supplementary materials included in this article.