

Abstract
Recent years have witnessed an increasing number of multisite MRI functional connectivity (fcMRI) studies. While multisite studies are an efficient way to speed up data collection and increase sample sizes, especially for rare clinical populations, any effects of site or MRI scanner could ultimately limit power and weaken results. Little data exists on the stability of functional connectivity measurements across sites and sessions. In this study, we assess the influence of site and session on resting state functional connectivity measurements in a healthy cohort of traveling subjects (8 subjects scanned twice at each of 8 sites) scanned as part of the North American Prodrome Longitudinal Study (NAPLS). Reliability was investigated in three types of connectivity analyses: (1) seed-based connectivity with posterior cingulate cortex (PCC), right motor cortex (RMC), and left thalamus (LT) as seeds; (2) the intrinsic connectivity distribution (ICD), a voxel-wise connectivity measure; and (3) matrix connectivity, a whole-brain, atlas-based approach assessing connectivity between nodes. Contributions to variability in connectivity due to subject, site, and day-of-scan were quantified and used to assess between-session (test-retest) reliability in accordance with Generalizability Theory. Overall, no major site, scanner manufacturer, or day-of-scan effects were found for the univariate connectivity analyses; instead, subject effects dominated relative to the other measured factors. However, summaries of voxel-wise connectivity were found to be sensitive to site and scanner manufacturer effects. For all connectivity measures, although subject variance was three times the site variance, the residual represented 60–80% of the variance, indicating that connectivity differed greatly from scan to scan independent of any of the measured factors (i.e., subject, site, and day-of-scan). Thus, for a single 5 min scan, reliability across connectivity measures was poor (ICC=0.07–0.17), but increases with increasing scan duration (ICC=0.21–0.36 at 25 min). The limited effects of site and scanner manufacturer support the use of multisite studies, such as NAPLS, as a viable means of collecting data on rare populations and increasing power in univariate functional connectivity studies. However, the results indicate that aggregation of fcMRI data across longer scan durations is necessary to increase the reliability of connectivity estimates at the single-subject level.
1 Introduction
Connectivity analyses of functional magnetic resonance imaging (fMRI) data are increasingly used to characterize brain organization in healthy individuals (Allen et al., 2011; Power et al., 2010; Smith et al., 2013; Tomasi and Volkow, 2012) and in clinical populations (Constable et al., 2013; Hoffman and McGlashan, 2001; Karlsgodt et al., 2008; Lynall et al., 2010; Scheinost et al., 2014a). fMRI studies aimed at capturing rare events, such as conversion to a disorder from a prodromal or at risk state, require particularly large samples that can be difficult to obtain at a single site. An efficient way to amass large numbers of subjects is to conduct a multisite study. Although power may be increased in multisite studies due to the acquisition of more subjects, these benefits may not be realized if site-related effects confound the measurements (Van Horn and Toga, 2009). In an ideal multisite study, the parameter of interest should be generalizable across sites, the effect of which should be negligible relative to the variability between subjects. Prior to pooling data from multisite studies, the assessment of site-related effects and reliability of data across sites should be evaluated. In general, ensuring the reliability of biomedical research has become a major topic, highlighted by recent efforts by the NIH (Collins and Tabak, 2014).
Reliability of functional connectivity and its network topology have been previously investigated at a single site (Mueller et al., 2015; Shah et al., 2016; Shehzad et al., 2009; Zuo et al., 2010) or using a site-independent paradigm (Braun et al., 2012; Wang et al., 2011). Others have investigated reliability of MRI across multiple sites in the domains of resting-state brain network overlap (Jann et al., 2015), anatomical measurements (Cannon et al., 2014; Chen et al., 2014), and task-related activations (Brown et al., 2011; Forsyth et al., 2014; Friedman et al., 2008; Gee et al., 2015). In general, test-retest reliability of functional connectivity is an ongoing field of study within both healthy and clinical populations (Keator et al., 2008; Orban et al., 2015; Van Essen et al., 2013; Zuo et al., 2014). However, with the exception of independent component analysis-based measurements (Jann et al., 2015), the reliability of resting state functional connectivity across multiple sites has not yet been investigated and may differ from multisite task-based fMRI findings.
Here we assessed the reliability of functional connectivity measures in the resting state BOLD signal. The North American Prodrome Longitudinal Study (NAPLS) provides a unique opportunity to assess the reliability of functional connectivity. The NAPLS2 study, conducted by a consortium of eight research centers, performed a longitudinal evaluation of individuals at clinical high risk (CHR) for psychosis in order to characterize the predictors and mechanisms of psychosis onset (Addington et al., 2007). To assess site effects across the eight centers, a separate traveling-subject dataset was acquired. The traveling-subject design is a common reliability paradigm wherein multiple subjects travel to multiple sites in a fully crossed manner (Pearlson, 2009). In this study, eight healthy subjects traveled to all eight sites in the consortium and were scanned at each site on two consecutive days, producing a total of 128 scan sessions. The relative contributions of each factor (subject, site, day) and their interactions can be used to determine reliability (Webb and Shavelson, 2005).
Specifically, we investigate the effect of performing measurements across sites using three complementary approaches to measuring functional connectivity: 1) seed-to-whole-brain connectivity using two seeds known to be hubs of robustly detected networks—the posterior cingulate cortex (PCC) and the right motor cortex (RMC)—and one seed chosen for more exploratory reasons—the left thalamus (LT); 2) voxel-wise connectivity using the intrinsic connectivity distribution (ICD), a threshold-free measure of voxel-wise connectivity (Scheinost et al., 2012), and 3) matrix connectivity, i.e., whole-brain connectivity within a functional parcellation atlas. We report subject, site, scanner manufacturer, and day-of-scan effects on functional connectivity, investigate the influence of site and day on reliability using the Generalizability Theory framework (Webb and Shavelson, 2005), and assess for site outliers using a leave-one-site-out analysis of variance. These results will help guide not only subsequent research using the NAPLS data set, but also other multisite studies of functional connectivity.
2 Methods
2.1 Subjects
Eight healthy subjects (4 males, 4 females) between the ages of 20 and 31 (mean=26.9, S.D.=4.3) with no prior history of psychiatric illness, cognitive deficits, or MRI contraindications were recruited for this study. Subjects were excluded if they met criteria for psychiatric disorders (via the Structured Clinical Interview for DSM-IV-TR; (First, 2005)), substance dependence (6 months), prodromal syndromes (via the Structured Interview for Prodromal Syndromes; (McGlashan et al., 2001)), neurological disorders, sub-standard IQ (Full Scale IQ <70, via the Wechsler Abbreviated Scale of Intelligence; (Wechsler, 1999)), and relation to a first-degree relative with a current or past psychotic disorder. One subject was recruited from each of the eight sites in the NAPLS consortium: Emory University, Harvard University, University of Calgary, University of California Los Angeles (UCLA), University of California San Diego (UCSD), University of North Carolina (UNC), Yale University, and Zucker Hillside Hospital. Only participants above 18 years of age were recruited due to travel restrictions. Subjects provided informed consent and were compensated for their participation. Each subject was scanned at each of eight sites on two consecutive days, resulting in 16 scans per subject and 128 scans in total (8 subjects × 8 sites × 2 days). The order in which subjects visited each site was counterbalanced across subjects. Each subject completed all eight site visits within a period of 2 months, and all scans were conducted between May 4 and August 9, 2011, during which time no changes were made to the MRI scanners.
2.2 Data Acquisition
As in Forsyth et al. (2014), data were acquired on Siemens Trio 3T scanners at UCLA, Emory, Harvard, UNC, and Yale, on GE 3T HDx scanners at Zucker Hillside Hospital and UCSD and on a GE 3T Discovery scanner at Calgary (SI Table 1). Siemens sites employed a 12-channel head coil, while GE sites employed an 8-channel head coil. For T1 anatomical scans, slices were acquired in the sagittal plane at 1.2 mm thickness and 1 mm × 1 mm in-plane resolution. Functional imaging was performed using blood oxygenation level dependent (BOLD) EPI sequences with TR/TE 2000/30ms, 77 degree flip angle, 64 mm base resolution, 30 4-mm slices with 1-mm gap, and 220-mm FOV. A single 5-min run of functional data consisted of 154 continuous EPI functional volumes. In accordance with the Function Biomedical Informatics Research Network (FBIRN) multi-center EPI sequence standardization recommendations (Glover et al., 2012), all scanners ran these BOLD fMRI EPI sequences with RF slice excitation pulses to excite both water and fat, fat suppression pulses were administered prior to RF excitation, and, comparable reconstruction image smoothing was implemented between scanner types (i.e., no smoothing during reconstruction). Subjects were instructed to relax and lay still in the scanner with their eyes open while gazing at a fixation cross and not to fall asleep. In addition, T2-weighted images were acquired in the same plane as the BOLD EPI sequences (TR/TE 6310/67ms, 30 4-mm slices with 1-mm gap, and 220-mm FOV).
2.3 Image Analysis
2.3.1 Preprocessing
Functional images were slice time-corrected via sinc interpolation (interleaved for Siemens, sequential for GE), then motion-corrected using SPM5 (http://www.fil.ion.ucl.ac.uk/spm/software/spm5/). Further analysis was performed using BioImage Suite (Joshi et al., 2011; http://bioimagesuite.yale.edu/). The data was then spatially smoothed with a 6mm Gaussian kernel. Next, subject space gray matter was identified using a common-space template as follows (Holmes et al., 1998). A white matter (WM), gray matter (GM), and cerebrospinal fluid (CSF) mask was defined on the MNI brain. To account for the lower resolution of the fMRI data, the WM and CSF areas were eroded in order to minimize inclusion of GM in the mask, and the GM areas were dilated. Voxels originally labeled WM or CSF that are removed during eroding are not re-labled as GM, but left unlabeled. Voxels in the combined WM/GM/CSF mask that are not labeled are ignored. This template was then warped to subject space using the transformations described in the next section in order to include only voxels in the gray matter for subsequent analyses. Finally, the data were temporally smoothed with a zero-mean unit-variance Gaussian filter (cutoff frequency=0.09Hz). During the connectivity analyses described later, several noise covariates were regressed from the data, including linear and quadratic drift, a 24-parameter model of motion (Satterthwaite et al., 2013), mean cerebral-spinal fluid (CSF) signal, mean white matter signal, and mean global signal.
2.3.2 Common Space Registration
Single subject images were warped into MNI space using a series of linear (6 DOF, rigid) and non-linear transformations estimated using BioImage Suite. First, anatomical data were skull-stripped using FSL (Smith, 2002; www.fmrib.ox.ac.uk/fsl) and the functional data for each subject, site, and day were linearly registered to the corresponding T1 anatomical images. Next, an average anatomical image for each subject was created by linearly registering and averaging all 16 anatomical images (from 8 sites × 2 sessions per site) for each subject. These average anatomical images were used for non-linear registration. Using these average anatomical images and single non-linear registration for each subject ensures that any potential anatomical distortion caused by the different sites or scanner manufacturers does not introduce a systemic basis into the registration procedure.
Finally, the average anatomical images were non-linearly registered to an evolving group average template in MNI space as described previously (Scheinost et al., 2015). The registration algorithm alternates between estimating a local transformation to align individual brains to a group average template and creating a new group average template based on the previous transformations. The local transformation was modeled using a free-form deformation parameterized by cubic B-splines (Papademetris et al., 2004; Rueckert et al., 1999). This transformation deforms an object by manipulating an underlying mesh of control points. The deformation for voxels between control points was interpolated using B-splines to form a continuous deformation field. Positions of control points were optimized using conjugate gradient descent to maximize the normalized mutual information between the template and individual brains. After each iteration, the quality of the local transformation was improved by increasing the number of control points and decreasing the spacing between control points, which allows for a more precise alignment. A total of 5 iterations were performed with control point spacings that decreased with each subsequent iteration (15 mm, 10 mm, 5 mm, 2.5 mm, and 1.25 mm). The control point spacings correspond directly with the spatial resolution of the underlying mesh. To help avoid local minima during optimization, a multi-resolution approach was used with three resolution levels at each iteration.
All transformation pairs were calculated independently and combined into a single transform that warps the single participant results into common space. Each subject image can thereby be transformed into common space via a single transformation, which reduces interpolation error.
2.3.3 Connectivity Analyses
Three functional connectivity measures were explored: connectivity from each of three seeds (PCC, RMC, LT) to each voxel in the whole brain (seed-based connectivity), voxel-based connectivity obtained via the intrinsic connectivity distribution (ICD), and connectivity across all brain regions (matrix connectivity).
Seed-based Connectivity
Three seed regions were chosen for seed-to-whole-brain connectivity analysis. The posterior cingulate cortex (PCC) was chosen because it is the main hub of the default mode network (DMN), the network that can be most robustly detected in the brain (Buckner et al., 2008; Greicius et al., 2003). Anomalous default mode network connectivity has also been implicated in many neuropsychiatric disorders (Broyd et al., 2009). The right motor cortex (RMC) was chosen because it is a main hub of another robust network, the motor network (Biswal et al., 1995). The left thalamus (LT) was chosen because of recent interest in thalamo-cortical connectivity (e.g., (Masterton et al., 2012). Seeds were manually defined as cubes within the group average anatomical brain (see Common Space Registration) registered to the MNI brain. The following Brodmann areas were used: PCC (MNI x=−1, y=−49, z=−24; 11 mm3), RMC (MNI x=38, y=−18, z=45; 9 mm3), LT (MNI x=−6, y=−14, z=7; 9 mm3). The mean timecourse within the seed region was then calculated, the Pearson’s correlation between the mean timecourse of the seed and the timecourse of each voxel was assessed, and the final correlation values were converted to z-scores using a Fisher transformation.
Voxel-wise ICD
Functional connectivity of each voxel as measured by ICD was calculated for each individual subject as described previously (Scheinost et al., 2012). Similar to most voxel-based functional connectivity measures, ICD involves calculating the Pearson’s correlation between the timecourse for any voxel and the timecourse of every other voxel in the gray matter, and then calculating a summary statistic based on the network theory measure degree. This process is repeated for all gray matter voxels, resulting in a whole-brain parametric image with the intensity of each voxel summarizing the connectivity of that voxel to the rest of the brain.
To avoid threshold effects, ICD models the distribution of a voxel’s degree across correlation thresholds—that is, ICD models the function d(x,τ), where x is a voxel, τ is a correlation threshold, and d is the resultant degree of that voxel at that threshold. The distribution is modeled using a Weibull distribution. This parameterization is akin to using a stretched exponential with unknown variance to model the change in degree as a function of the threshold used to define degree. A parameter describing the variance of this model (the parameter α in Scheinost et al., 2012) is used for the analyses of reliability presented here. Because variance controls the spread of the distribution of connections, a larger variance signifies a greater number of high correlation connections. Altogether, this formulation avoids the need for choosing an arbitrary connectivity threshold to characterize the connectivity of each voxel.
In addition to ICD, we investigated reliability for two other voxel-based connectivity measures: global brain connectivity (GBC) (Cole et al., 2010) and voxel-wise degree (Buckner et al., 2009). GBC measures the mean correlation between all voxels and degree measures the number of voxels with which a particular voxel is correlated above an arbitrary but typical threshold (r>0.25).
Matrix Connectivity
For the matrix connectivity analysis, regions were delineated according to a 278-node gray matter atlas developed to cluster maximally similar voxels (Shen et al., 2013). As previously described (Finn et al., 2015), the mean timecourse within each region was calculated, and the Pearson’s correlation between the mean timecourse of each pair of regions provided the edge values for the 278×278 symmetric matrix of connection strengths, or edges. These correlations were converted to z-scores using a Fisher transformation to yield a connectivity edge matrix for each subject and session.
2.4 Modeling Regressors of Connectivity
A two-part approach was used to investigate effects due to each factor (subject, site/scanner manufacturer, and day): (1) assess for the effect of each factor (via ANOVA), and (2) assess for the effect of each individual level within each factor (via GLM). In the first part, effects due to each factor were assessed as follows. The contribution of all factors to the variability in connectivity was estimated using a three-way ANOVA with all factors modeled as random effects, which maximizes generalizability of these results beyond the conditions represented in this analysis. The Matlab N-way ANOVA function anovan was used, which obtains estimates using ordinary least squares. The model is as follows, with subscripts representing p = participant, s = site, d = day, and e = residual:
The same model was reused to assess for scanner manufacturer effects by replacing site with scanner manufacturer (m = scanner manufacturer):
Note that no other factors were explored with the second model. Next, the F-test statistic was used to assess whether each factor was associated with significant variability in connectivity. A significant F-statistic reflects high between-factor variability relative to within-factor variability.
Finally, correction via estimation of the false discovery rate (FDR) was performed separately for each factor using mafdr in Matlab (based on Storey (2002)). For example, a single q-value map was obtained for the “subject factor,” and another for the “site” factor. Corrected values were then compared to a q-value threshold of 0.05. The proportion of affected edges or voxels relative to the total number of edges or voxels are presented throughout the text and in Table 1.
Table 1.
Percentage of edges or voxels showing significant effects for each connectivity measure due to each factor. Significant effects were obtained for each factor via ANOVA (p<0.05, FDR-corrected).
| Subject | Site | Scanner Manufacturer | Day | |
|---|---|---|---|---|
| PCC n=42784 |
97.0% | 0.4% | 2.2% | 0% |
| RMC n=42784 |
67.3% | 0.0% | 0.4% | 0% |
| LT n=42784 |
70.8% | 0% | 0.1% | 0% |
| ICD n=42733 |
100% | 43.5% | 18.7% | 0% |
| Matrix n=38503 |
100% | 4.2% | 3.5% | 0% |
In the second part, a general linear model (GLM) was used to investigate whether individual subjects, sites, days, or scanner manufacturers showed particular edge effects. Each of the four factors (subject, site, day, and scanner manufacturer) were modeled separately, so that four GLMs—one per factor—were constructed for each edge or voxel and fit using the Matlab function glmfit. Consistent with the exploratory aim of the current study, we estimated each GLM independently to facilitate interpretation of the direct effects (Hayes, 2013). An effect-coded GLM design was employed in order to derive easily comprehensible parameter estimates (Rutherford, 2011). Whereas a dummy-coded GLM design is typically used to provide estimates of whether a level significantly differs from a reference level, an effect-coded GLM design is used to provide estimates of whether a level significantly differs from the grand mean. For example, one regressor of interest might be Subject 1, and one corresponding outcome variable might be the strength of a particular edge; if this regressor is found to be significant, then mean strength of this edge measured for Subject 1 significantly differs from the mean strength of this edge measured across all subjects. Design matrices for this study can be found in SI Figure 1. In this analysis, site, scanner manufacturer, and day effects are undesirable, whereas subject effects are expected to greatly exceed the other measured factors because brain connectivity has been shown to differ greatly across subjects (Finn et al., 2015). This approach determines whether any of the measures are significantly different from the group mean as a function of these factors. It is important to consider that the inclusion of the level of interest in the grand mean can somewhat undermine the power of this test; however, this provides a useful basis for making comparisons between all levels of a factor because all tests for all levels within a factor are performed using a common reference.
Using the same procedure described above, FDR-correction was performed separately for each level of each factor. For example, for the “subject” factor, eight p-values maps were obtained (one for each subject), which were then individually corrected to obtain eight q-value maps. The mean proportion of affected edges or voxels relative to the total number of edges or voxels are presented throughout the text and in Table 2 alongside their standard deviations. Summary maps are shown throughout the main text, and detailed individual maps can be found in the Supplemental Materials (SI Figures 1–3).
Table 2.
Mean percentage of edges or voxels showing significant effects for each connectivity measure due to each level, alongside standard deviations. Calculated for each individual site, subject, and scanner manufacturer regressor (p<0.05, FDR-corrected). Contrasts were made between individual regressors (e.g., subject 1) and the grand mean of that group of regressors (e.g., all subjects).
| Subject | Site | Scanner Manufacturer | Day | |
|---|---|---|---|---|
| PCC n=42784 |
25.9 ± 4.4 % | 0.0 ± 0.0 % | 0.4% | 0 % |
| RMC n=42784 |
7.1 ± 9.6 % | 0.0 ± 0.0 % | 0.1% | 0 % |
| LT n=42784 |
5.5 ± 5.2 % | 0.0 ± 0.0 % | 0.1% | 0 % |
| ICD n=42733 |
29.2 ± 3.7 % | 1.4 ± 1.7 % | 12.1% | 0 % |
| Matrix n=38503 |
25.2 ± 3.4 % | 0.0 ± 0.0 % | 1.54% | 0 % |
2.5 Assessing Reliability
Reliability was assessed in accordance with the Generalizability Theory (G-Theory) framework. G-Theory is a generalization of Classical Test Theory that explicitly permits the modeling of multiple facets of measurement which may introduce error (i.e., site, day) related to the object of measurement (i.e., subject) (Cronbach et al., 1972; Shavelson et al., 1989; cf. Webb and Shavelson, 2005); previous studies have used G-Theory to assess the reliability of task-based functional neuroimaging (Forsyth el al., 2014, Gee et al., 2015). In the first step in this process, the Generalizability Study (G-Study), variance components are estimated for the object of measurement (i.e., subject), all facets of measurement (i.e., site and day), and their interactions. The residual variance is expected to represent a combination of the three-way interaction and residual error. Variance components were estimated using the same procedure as above (three-way ANOVA, all factors modeled as random effects) but now with the inclusion of all interactions. The model is as follows, with subscripts representing p = participant, s = site, d = day, and e = residual:
Variance components estimated to be negative were very small in relative magnitude and therefore set to 0, in accordance with Cronbach et al. (1972) via Shavelson et al. (1993).
Two types of reliability were then assessed: relative reliability and absolute reliability. Relative reliability is measured by the generalizability coefficient (G-coefficient, Eρ2) and reflects the reliability of rank-ordered measurements. Absolute reliability is measured by the dependability coefficient (D-coefficient, Φ) and reflects the absolute agreement of measurements. Note that both are related to the intraclass correlation coefficient (ICC) (Shrout and Fleiss, 1979), and are based on ratios of between- and within-factor variability, like the F-statistic. G-coefficients (Eρ2) and D-coefficients (Φ) were calculated in Matlab as follows:
such that represents variance components associated with factor i (p = participant, s = site, and d = day) or an interaction between factors and ni′ represents number of levels in factor i.
Next, a Decision Study (D-Study) was performed, which is often done to determine the optimal combination of measurements from each facet of measurement that yields the desired level of reliability. G- and D-coefficients were re-calculated with ni′ allowed to vary as free parameters. For example, a reliability coefficient from a single 5-min run is calculated from ns′=1 and , whereas a reliability coefficient from data averaged over 25 min (5 min × 5 days) is calculated from ns′=1 and nd′=1. The D-Study results are presented for ns′=1 and nd′ allowed to vary because few studies would undertake a design whereby data is averaged over multiple sites, although some may consider averaging over multiple days. In addition, the “day” axis of the Decision Study may somewhat approximate a variable with more practical relevance: “run.” Mean ICCs over all edges or voxels are presented throughout the text and in Table 3 alongside their standard deviations. Note that the ICC measures the reliability of measurements at the single-subject level, which is distinct from the group-level analyses typically conducted in fMRI. Group analyses may derive additional power from averaging over multiple subjects.
Table 3.
Reliability coefficients for all connectivity measures obtained at a single 5-min scan for a single site (ns′=1 and nd′=1), alongside standard deviations. Mean G- and D-coefficients over significantly non-zero edges/voxels (Eρ2, significant; Φ, significant) and over all edges/voxels (Eρ2, all; Φ, all).
|
Eρ2 all |
Φ all |
Eρ2 significant |
Φ significant |
|
|---|---|---|---|---|
| PCC n=42784 nsig=17959 |
0.17+/−0.15 | 0.16+/−0.14 | 0.22+/−0.15 | 0.21+/−0.14 |
| RMC n=42784 nsig=7123 |
0.08+/−0.08 | 0.07+/−0.07 | 0.12+/−0.10 | 0.12+/−0.10 |
| LT n=42784 nsig=5240 |
0.07+/−0.06 | 0.07+/−0.06 | 0.08+/−0.07 | 0.07+/−0.07 |
| ICD n=42733 nsig=21427 |
0.16+/−0.12 | 0.15+/−0.11 | 0.17+/−0.13 | 0.16+/−0.12 |
| Matrix n=38503 nsig=16102 |
0.15+/−0.12 | 0.14+/−0.12 | 0.17+/−0.13 | 0.16 +−0.12 |
The formulations of the G- and D-coefficients can be compared to highlight key similarities and differences. Both of these reflect the ratio of variance attributed to the object of measurement relative to itself plus some error variance due to facets of measurement. However, for relative reliability, the error term includes the error strictly associated with the object of interest, whereas for absolute reliability, the error term includes the error associated with all possible sources. Because of these differences in the denominator, relative reliability is low when the rankings of persons based on their relative measurements are inconsistent, whereas absolute reliability is low when measurements of persons are inconsistent. Both coefficients range from 0 to 1, and can be interpreted as follows: < 0.4 poor; 0.4–0.59 fair; 0.60–0.74 good; > 0.74 excellent (Cicchetti and Sparrow, 1981).
Note that while both relative (Eρ2) and absolute (Φ) reliability provide useful perspectives, relative reliability may be more applicable to the interpretation of fMRI data. fMRI data are typically understood in terms of relationships between individuals or groups (e.g., significance of “activation” differences between a clinical and control group) rather than absolute terms (e.g., “activation map” of a clinical group). Therefore, in this example, it is useful to understand whether the measured differences between groups remain stable. While high relative reliability suggests that measurements of different individuals will be similarly different over multiple scans, high absolute reliability suggests that the measurement of a single individual is similar to him or herself over multiple scans.
Previous work has shown that the reliability of significantly non-zero edges is significantly greater than the reliability of edges which are not significantly non-zero (Birn et al., 2013; Shehzad et al., 2009) and that there is a significant relationship between reliability and edge strength (Wang et al., 2011). Therefore, to be consistent with previous literature, the results presented here also include reliability and dependability within edges or voxels exhibiting significantly non-zero connectivity across all 128 scans (Bonferroni-corrected for total number of edges or voxels) (cf. Shehzad et al., 2009). For example, for PCC seed connectivity, a two-tailed t-test was separately performed for each of the 42,784 individual edges to assess whether the measurement of that edge across all 128 scans was significantly different than zero (Bonferroni-corrected for 42,784 total edges). Therefore, 42,784 p-values were obtained, and edges that were not significantly different than zero (p<0.05) across all scans were excluded. In the context of seed and matrix connectivity, this procedure selects for edges with strong correlations; in the context of ICD, this selects for voxels with connectivity profiles that are significantly different than the global average ICD value.
If an edge or voxel was missing from at least one scan, that edge or voxel was excluded from all analyses. For example, if voxel X was missing in one scan from one subject (1/128 total scans), then voxel X was removed from all scans. This occasionally occurred as a result of registration, which caused some parts of the individual subject brains to lose voxels at the boundary between gray matter and non-gray matter.
Reliability calculated both over all data and over only significant edges can be found in SI Table 2 with corresponding variance components in SI Tables 2 and 3, respectively. Violin plots from all data and significant edges only were created using the R function geom_flat_violin, modified here for asymmetric violin plots; these are shown in the main text and Supplemental Materials.
2.6 Outlier Site Identification via Leave-One-Site-Out Change in Variance
A complementary way of assessing for a site effect is to identify outlier sites. This can be done by examining how the removal of each site affects estimates of variance components (Forsyth et al., 2014; Friedman et al., 2008). Variance components were estimated using the 3-way ANOVA with all random factors described in the previous section (2.5 Assessing Reliability). Variance components were re-estimated eight times, once for each possible set of seven sites while excluding data from the other site. Variance components were also estimated with all sites included (SI Table 3). The percent change in a variance component due to removing a site was calculated as the percent difference between the new variance component estimate with the site excluded and the variance component estimate with all sites included. Here, outlier sites are defined as sites consistently associated with a change a variance component greater than two standard deviations from the mean change in a variance component.
3 Results
In this section, we present functional connectivity results based on each of the three connectivity analysis methods: seed-to-whole-brain connectivity (“seed”), the distribution of connectivity attributed to each voxel (“ICD”), and parcellation-based whole-brain connectivity (“matrix”). For each method, we report results from: (1) a GLM analysis modeling the relationship between connectivity and four regressor variables (subject, site, scanner manufacturer and days); here, subject effects are desirable and site, scanner manufacturer, and day effects are undesirable; (2) a reliability analysis to assess the consistency of subject measurements across sites and days; and (3) a leave-one-site-out analysis to directly assess the contributions of individual sites to the cross-site variance.
3.1 Regressors of Seed-to-Whole-Brain Connectivity
We investigated seed-to-whole-brain connectivity using three seed regions of interest: the posterior cingulate cortex (PCC), right motor cortex (RMC) and left thalamus (LT). In general, there were minimal effects of site, scanner manufacturer, or day, while the main effect of subject dominated (Figure 1, Table 1, Table 2, SI Table 4). Very few edges showed a significant effect of site (<0.5% of 42784 edges for each seed, p<0.05, FDR-corrected). Using the GLM to investigate individual sites, no site effects were found for five of the eight sites. For the remaining three sites (4, 6, and 7), a very small proportion of edges showed significant site effects (<0.05% of 42784 edges, p<0.05, FDR-corrected). Voxels associated with these edges were not restricted to any particular region.
Figure 1.
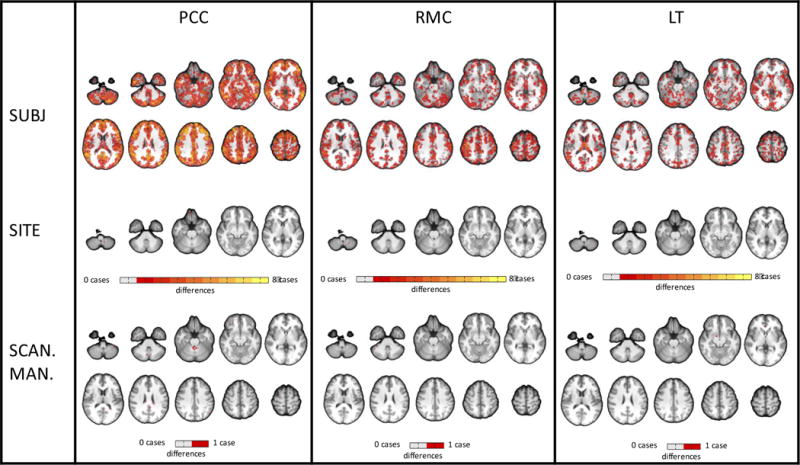
Map of edges showing significant effects (p<0.05, FDR-corrected) on seed-based connectivity for each individual site, subject, and scanner manufacturer regressor. No day effects were found. Only one case is shown for scanner manufacturer because GLM estimates are identical for each regressor when there are only two regressors. Contrasts were made between individual regressors (e.g., subject 1) and the Figure 1 grand mean of that group of regressors (e.g., all subjects). For each group of regressors, brighter colors represent edges affected by multiple cases (e.g., for the subject group, an orange edge indicates that the contrast was significant in that edge for four out of eight subjects)
Similarly, very few edges showed a significant effect of scanner manufacturer (Siemens vs. GE) (2.2% of edges for PCC; 0.4% for RMC; 0.1% for LT). Voxels associated with these edges were not restricted to a single region. No significant day effects were found.
Many more edges showed significant subject effects than site, scanner manufacturer, or day effects. The majority of edges showed a significant effect of subject (65–100% of 42784 edges, p<0.05, FDR-corrected), 1–3 orders of magnitude larger than the proportion of edges showing a significant effect of site or scanner manufacturer. Using the GLM to investigate individual subjects, on average, 25.9 ± 4.4 % of edges in the PCC seed connectivity map showed significant subject effects. On average for seven out of eight subjects, 3.8 ± 2.1 % of RMC and 4.0 ± 3.3 % of LT seed connectivity maps showed significant subject effects; the other subject’s connectivity map showed a much larger proportion of subject effects (30.3% for RMC, 15.9% for LT). Edges showing significant subject effects were distributed throughout the brain. Maps for individual subject and site effects can be found in SI Figure 2.
3.2 Reliability of Seed-to-Whole Brain Connectivity
For this Generalizability Study, there was typically smaller variance attributed to site (1.8–1.9%) and day (0.6–0.7%), relative to subject variance (7.0–22.3%); however, residual variance dominated (63.1–80.3%) (SI Table 2). The proportion of variance attributed to subject was more than twice as large for PCC connectivity as for LT and RMC connectivity, with a smaller residual for PCC connectivity compared with the other seeds.
Using a single 5-min run (nd′=1), relative reliability (Eρ2) was found to be 0.17+/−0.15 for PCC, 0.08+/−0.08 for RMC, and 0.07+/−0.06 for LT (Table 3). Using 25 min of data (nd′=5), relative reliability was found to be 0.36+/−0.24 for PCC, 0.22+/−0.18 for RMC, and 0.21+/−0.17 for LT. The Decision Study results for data averaged over other numbers of days (nd′) can be found in Figure 2. For all seed connectivity maps, absolute reliability (Φ) was 0.001–0.01 units below relative reliability (Eρ2).
Figure 2.
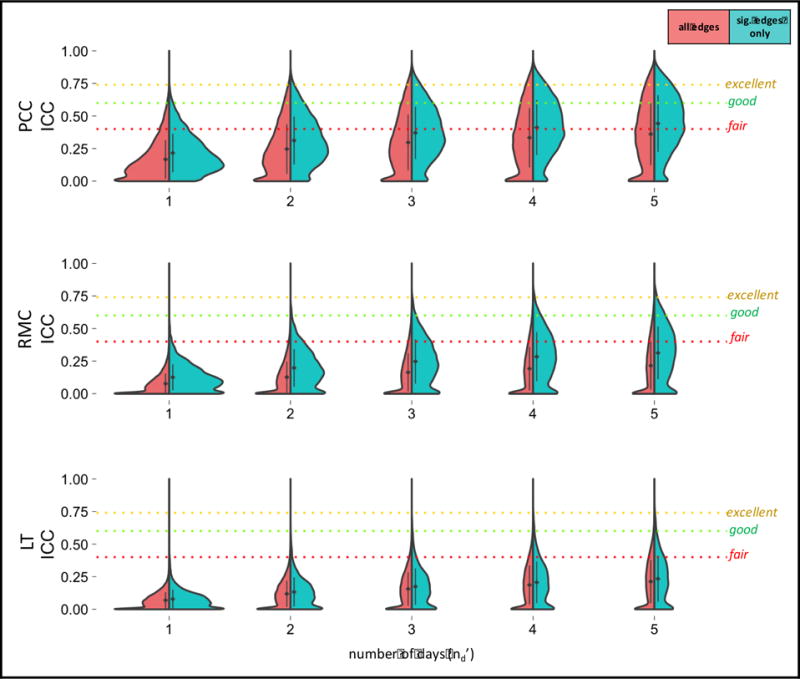
Decision Study violin plots showing the distribution of G-coefficients for seed-based connectivity obtained from increasing amounts of data. The x-axis reflects the number of days over which data is averaged. The mean (diamond) and standard deviation (bars) are shown. Results categorized as follows: poor<0.4, fair=0.4–0.59, good=0.6–0.74, excellent>0.74 (Cicchetti and Sparrow, 1981).
3.3 Leave-One-Site-Out Effects on Seed Connectivity Variance Components
All variance components were calculated with one site at a time removed (SI Table 5). Of all 21 variance components calculated for each site (7 variance components × 3 connectivity measures), no site was associated with more than a single outlier component.
3.4 Regressors of ICD
Our second set of analyses tested reliability of ICD, a voxel-wise measure of global connectivity. More subject effects were found than site, scanner manufacturer, and day effects on ICD; however, in contrast to the results of the seed analysis, site and scanner manufacturer effects were non-negligible (Figure 3, Table 1, Table 2, SI Table 6). Nearly half of all voxels showed a significant effect of site (43.5% of 42733 voxels, p<0.05, FDR-corrected). Using the GLM to investigate individual sites, no site effects were found for two of the eight sites. For each of the remaining six sites (1, 2, 3, 4, 6, and 7), a small proportion of voxels showed significant site effects (1.9 ± 1.7 % of 42733 voxels, p<0.05, FDR-corrected). Many of these voxels were located in a large cluster on the inferior and medial surfaces of the inferior prefrontal cortex.
Figure 3.
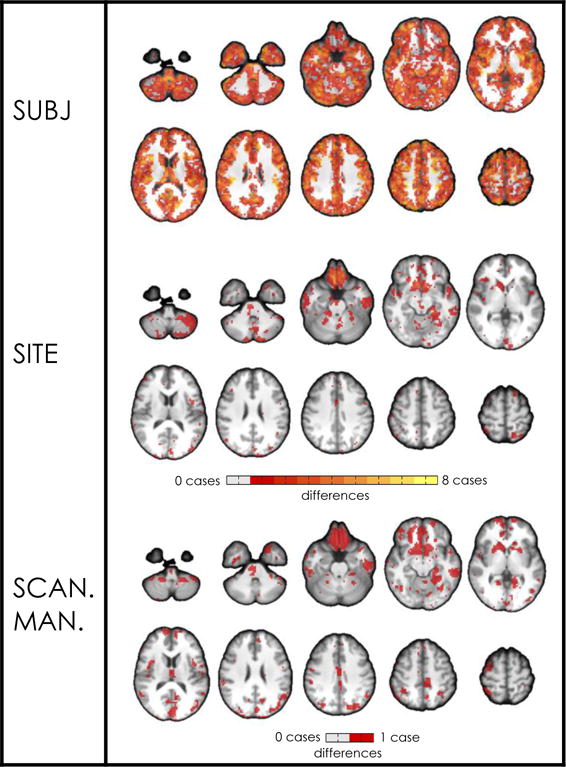
Map of voxels showing significant effects (p<0.05, FDR-corrected) on ICD for each individual site, subject, and scanner manufacturer regressor. No day effects were found. Only one case is shown for scanner manufacturer because GLM estimates are identical for each regressor when there are only two regressors. Contrasts were made between individual regressors (e.g., subject 1) and the grand mean of that group of regressors (e.g., all subjects). For each group of regressors, brighter colors represent voxels affected by multiple cases (e.g., for the subject group, an orange edge indicates that the contrast was significant in that edge for four out of eight subjects).
18.7% of voxels showed significant scanner manufacturer effects (Siemens vs. GE). Like those voxels showing significant site effects, many of these voxels were clustered on the inferior and medial surfaces of the inferior prefrontal cortex likely due to low SNR in these regions. No significant day effects were found.
All voxels showed a significant effect of subject (p<0.05, FDR-corrected), which is approximately double the quantity of voxels that showed a significant effect of site and approximately five times the quantity of voxels that showed a significant effect of scanner manufacturer. Using the GLM to investigate individual subjects, on average, 29.2 ± 3.7 % of voxels showed significant subject effects. Voxels showing significant subject effects were distributed throughout the brain. In general, ICD showed a larger proportion of individual site and scanner manufacturer effects than was found in seed and matrix connectivity. Maps for individual subject and site effects can be found in SI Figure 3.
3.5 Reliability of ICD
For this Generalizability Study, there was relatively smaller variance attributed to site (4.8%) and day (0.7%), relative to subject (16.4%); however, residual variance dominated (62.7%) (SI Table 2). Using a single 5-min run (nd′=1), relative reliability (Eρ2) was found to be 0.16+/−0.12 (Table 3). Using 25 min of data (nd′=5), relative reliability was found to be 0.36+/−0.21. The Decision Study results for data averaged over other numbers of days (nd′) can be found in Figure 4. Absolute reliability (Φ) was 0.01 units below relative reliability (Eρ2).
Figure 4.
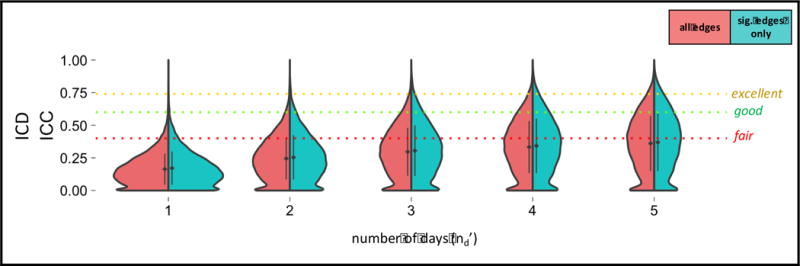
Decision Study violin plots showing the distribution of G-coefficients for ICD obtained from increasing amounts of data. The x-axis reflects the number of days over which data is averaged. The mean (diamond) and standard deviation (bars) are shown. Results categorized as follows: poor<0.4, fair=0.4–0.59, good=0.6–0.74, excellent>0.74 (Cicchetti and Sparrow, 1981).
All other voxel-wise connectivity measures (degree, positive GBC, and full GBC) showed similarly non-negligible quantities of site effects as ICD (33–39%) (SI Table 7). Numerically, ICD showed a slightly greater proportion of site effects and slightly greater reliability than the other voxel-wise connectivity measures (SI Table 7).
3.6 Leave-One-Site-Out Effects on ICD Variance Components
ICD-related variance components were calculated upon removal of each site (SI Table 8). No sites were associated with any outlier variance components.
3.7 Regressors of Matrix Connectivity
In the connectivity matrix-based approach, we calculated edge strength between all pairs of nodes in a 278-node atlas. As in the seed-based connectivity results, there were minimal effects of site, scanner manufacturer, or day, on edge values, while the main effect of subject dominated (Figure 5, Table 1, Table 2, SI Table 9). Few edges showed a significant effect of site (4.2% of 38503 edges, p<0.05, FDR-corrected). Using the GLM to investigate individual sites, no site effects were found for four of the eight sites. For the remaining four sites (1, 3, 4, and 6), a very small proportion of edges showed significant site effects (0.02 ± 0.04 % of 38503 edges, p<0.05, FDR-corrected). These edges were not restricted to a single region.
Figure 5.
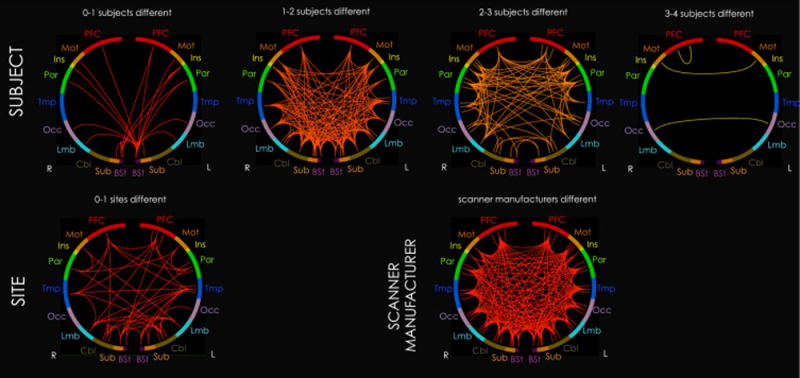
Summary map of inter-lobe edges showing significant effects (p<0.05, FDR-corrected) on matrix connectivity for each individual site, subject, and scanner manufacturer regressor. No day effects were found. Only one case is shown for scanner manufacturer because GLM estimates are identical for each regressor when there are only two regressors. These maps correspond with Figures 1 and 3, but are summarized for visualization purposes. 278 regions are organized into 10 roughly anterior-to-posterior lobes: prefrontal cortex (PFC), motor cortex (Mot), insula (Ins), parietal cortex (Par), temporal cortex (Tmp), occipital cortex (Occ), limbic system (Lmb), cerebellum (Cbl), subcortex (Sub), and brainstem (Bst). A single inter-lobe edge in the summary map represents the mean number of affected cases for all edges between the two lobes. For example, the inter-lobe edge between right and left motor cortex under the “3–4 subjects different” heading indicates that, on average, edges between right and left motor cortex are unique to 3–4 subjects. Brighter (more yellow) colors also represent inter-lobe edges affected by multiple cases.
Similarly, very few edges showed a significant effect of scanner manufacturer (Siemens vs. GE) (3.5% of 38503 edges). These edges were not restricted to a single region. No significant day effects were found.
All edges showed a significant effect of subject (p<0.05, FDR-corrected), which is two orders of magnitude larger than those showing a significant effect of site or scanner manufacturer. Using the GLM to investigate individual subjects, on average, 25.2 ± 3.4 % of edges showed significant subject effects. Edges showing significant subject effects were distributed throughout the brain. Matrices for individual subject and site effects can be found in Supplemental Materials (SI Figure 4).
3.8 Reliability of Connectivity Matrices
For this Generalizability Study, there was relatively smaller variance attributed to site (2.5%) and day (0.6%), relative to subject (16.7%); however, residual variance dominated (67.6%) (SI Table 2). Using a single 5-min run (nd′=1), relative reliability (Eρ2) was found to be 0.15+/−0.12 (Table 3). Using 25 min of data (nd′=5), relative reliability was found to be 0.34+/−0.22. The Decision Study results for data averaged over other numbers of days (nd′) can be found in Figure 6. Absolute reliability (Φ) was 0.01 units below relative reliability (Eρ2).
Figure 6.
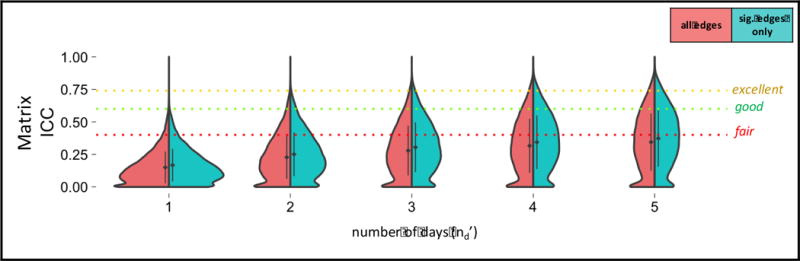
Decision Study violin plots showing the distribution of G-coefficients for matrix connectivity obtained from increasing amounts of data. The x-axis reflects the number of days over which data is averaged. The mean (diamond) and standard deviation (bars) are shown. Results categorized as follows: poor<0.4, fair=0.4–0.59, good=0.6–0.74, excellent>0.74 (Cicchetti and Sparrow, 1981).
Between the two parcellation atlases used to derive matrix connectivity, the functional atlas exhibited numerically greater reliability than the AAL atlas (SI Table 10).
3.9 Leave-One-Site-Out Effects on Matrix Connectivity Variance Components
Matrix variance components were calculated upon removal of each site (SI Table 11). Of all 7 variance components calculated for each site, no site was associated with more than a single outlier component.
Trends in leave-one-site-out effects on main effect variance components for all connectivity measures are further explored in the Supplemental Materials (SI Figure 5).
4 Discussion
Despite the growing number of multisite functional connectivity studies, the influence of site/scanner manufacturer effects relative to subject effects on functional connectivity has not been directly investigated. This study assessed stability of functional connectivity across sites using three complementary approaches: (1) seed connectivity, with seeds in the posterior cingulate cortex (PCC), right motor cortex (RMC), and left thalamus (LT); (2) the intrinsic connectivity distribution (ICD), a measure of voxel-wise connectivity; and (3) matrix connectivity, a measure of whole-brain connectivity between nodes. Overall, results indicate that univariate measurements of functional connectivity do not show major site, scanner manufacturer, or day effects; rather, as anticipated, subject effects dominated relative to the other measured factors. Furthermore, no particular site was found to be a major outlier via a leave-one-site-out analysis of variance. However, summaries of voxel-wise connectivity do appear to be sensitive to site effects. Together, these results are encouraging for pooling resting state functional connectivity data across sites. However, it is recommended to maximize the amount of data per subject as residual errors are large.
In an analysis of factors influencing univariate connectivity, no major site, scanner manufacturer, or day effects were found. Instead, most differences in univariate connectivity were attributed to subject. In a separate analysis, subject effects were found to consistently dominate relative to the other measured factors across different FDR-corrected and uncorrected significance thresholds relative to the other measured factors (SI Figure 6); subject effects were particularly large relative to site and day effects across FDR-corrected thresholds. From the matrix connectivity analysis, the edges that were most unique to subjects occurred between bilateral motor regions, between bilateral occipital regions, and between right prefrontal regions (Figure 5, 3–4 subjects different), with more unique edges between cortical rather than non-cortical regions (Figure 1, PCC; Figure 5). The least unique edges were associated with the brainstem (Figure 5, 0–1 subjects different). This may be due to the association of the brainstem with physiological noise (Brooks et al., 2013) and/or its small size (D’Ardenne et al., 2008). Note that the GLM results should be interpreted with caution; since each level tested was included in the grand mean, this is not fully the most powerful test for assessing individual level effects. However, it does provide a useful framework for comparing different levels, since all levels are compared to the same reference.
More complex summaries of voxel-wise connectivity did, however, exhibit extensive site effects. ICD, wGBC, and degree all showed fewer site and scanner effects relative to subject effects but site and scanner manufacturer effects were still present in a large portion (half to one-fifth) of the brain. Numerically, ICD showed slightly greater site effects and slightly better reliability than the other voxel-wise connectivity measures. Site and scanner manufacturer effects were largely restricted to inferior prefrontal cortex, where SNR is often low due to susceptibility effects associated with the frontal sinuses. Differences in smoothing between scanner manufacturers may underlie the spatial specificity of the affected regions. Voxel-wise connectivity measures have been shown to be sensitive to differences in smoothing (Scheinost et al., 2014b), and adjacent voxels containing unique signals—such as brain and sinus in this case—may be especially susceptible to SNR reduction. Note that while a reduction in SNR of an area may result in estimates of weaker connectivity, these weak but non-zero estimates are not necessarily unreliable. For example, consider the influence of smoothing on the correlation between a prefrontal voxel adjacent to the sinuses and another region functionally related to that voxel. Different degrees of smoothing will result in different amounts of noise (from sinus measurements) being mixed into an area containing signal (the brain voxel). If one scanner employs minimal smoothing, the correlation between the related areas may register as high, whereas a different scanner that employs moderate smoothing may reliably estimate that correlation as being low. In these cases, connectivity measurements may be precise (low variance) yet different from one another. Nevertheless, all voxel-wise connectivity measures were found to be as or almost as reliable numerically as matrix connectivity and equally sensitive to subject effects. Obtaining similar levels of reliability despite exhibiting many more site effects suggests that voxel-wise connectivity methods are generally more sensitive to all sources of variability, desirable and undesirable.
The Generalizability Study revealed that the factor that most contributed to univariate connectivity variance was subject (~13%), followed by smaller contributions due to site (~2%) and day (<1%). As described above, ICD exhibited a greater quantity of site effects (~5%). Numerically, PCC seed connectivity demonstrated the greatest reliability, followed by ICD and matrix connectivity, then RMC seed connectivity, then LT seed connectivity. Even though the central aim of this study was to assess for site effects—which were found to be minimal for univariate measures of connectivity—the relatively large residual variance (~72%) is notable. As a result, the relative reliability of connectivity measured over a single 5 min run was poor (0.07–0.17), with similar absolute reliability (SI Figure 7).
Altogether, our results suggest that obtaining reliable measurements at the single-subject level is very difficult. In general, the literature on the reliability of functional connectivity is mixed (cf. Bennett and Miller, 2010), in part because of variability in the measure of reliability, study designs, and processing choices. Matrix connectivity generated from 9 min of data may exhibit “respectable reproducibility,” (Laumann et al., 2015) but the authors suggested collection of more data to obtain more precise estimates. In another study, reliability of connectivity obtained from 6 min scans at a single site was found to be “minimal to robust”—that is, reliability of connectivity between sets of seeds was found to be minimal, but reliability of certain edges was found to be high (Shehzad et al., 2009). As an aside, the present study correspondingly found that PCC seed connectivity exhibited the greatest reliability compared with other seeds and a connectivity matrix, and that statistically significant edges exhibited greater reliability than non-significant edges, perhaps because significant edges reflect a biologically plausible relationship between brain regions (Friston, 1994). The reliability of network definitions and other network measures has also been investigated: previous work has demonstrated good reproducibility of functional parcellation (Laumann et al., 2015), moderate to high reliability of resting brain network boundaries across techniques (Jann et al., 2015), moderate to high reliability of network membership (Zuo et al., 2010), and low to moderate reliability for network-theory metrics of functional connectivity (Braun et al., 2012; Wang et al., 2011 cf. Andellini et al., 2015; Telesford et al., 2010). In contrast, reliability of anatomical measurements via structural MRI is quite high (Cannon et al., 2014). In this study, reliability of functional connectivity averaged over all measurements for a subject (8 sites × 2 days) was fair to good, which is comparable in magnitude to corresponding reliability estimates for measures of task-based activation in fMRI in similar traveling subjects studies (Forsyth et al., 2014, Gee et al., 2015, Friedman et al., 2008). However, reliability at a single 5-min scan is lower.
Single-subject reliability is diminished by the high residual. The residual reflects the variability across all scans not accounted for by the main effects of subject, site, and day-of-scan and their two-way interactions. Similar proportions of residual variance (60–80%) have been found in task-based fMRI and attributed to variability in cognitive strategy or attention within or across scans (Gee et al., 2015; Forsyth et al., 2014). In the context of resting-state connectivity, a large residual suggests that brain connectivity and/or the scanner are unstable within or across scans—the extent to which this instability is stationary is under investigation (Hutchison et al., 2013; Jones et al., 2012). One of the most important tools we have for increasing the reliability of a measurement is to reduce measurement error by increasing the number of samples of the measurement. In agreement with this, many have suggested that brain networks may only be partially characterized in such a short time period as 5 minutes. Reproducibility may greatly improve with scanning durations of 10 min (Finn et al., 2015; Hacker et al., 2013), 13 min (Birn et al., 2013), 20 min (Anderson et al., 2011), or even 90 min (Laumann et al., 2015). The present findings suggest that “fair” reliability may be obtained for some measures with a minimum of five repeated 5-min sessions (25 min or 770 volumes in total). Besides increasing scan duration, more data may be acquired per subject by increasing the temporal resolution of the data through multiband acquisitions (cf. Feinberg and Yacoub, 2012). Significantly, increasing temporal resolution (i.e., shorter TRs), as multiband allows, has been found to improve the statistical power of task-based (Constable and Spencer, 2001) and functional connectivity analyses (Feinberg and Setsompop, 2013). These emerging bodies of evidence unambiguously underscore the necessity for increasing statistical power for single-subject analyses by increasing the amount of data acquired per subject.
There are several limitations to this work. First, more samples would enable a more accurate assessment of reliability. This is particularly notable in the context of the Decision Study, which is limited by the generalizability of the measured factor structure. This can be accomplished by increasing the number of subjects, sessions, and data acquired per subject (e.g., scan duration, temporal resolution). Although more subjects and sessions would have been useful, it is practically challenging to accomplish in a context where each subject must travel to each of eight distinct sites. Second, this research was conducted in healthy, non-adolescent individuals. Variance between subjects may change slightly in different populations, e.g., clinical or adolescent populations, which can affect the calculation of reliability; for example, test-retest reliability has been shown to differ between ADHD and normal populations (Somandepalli et al., 2015). However, this is not expected to change the estimate of site effects. Similarly, while overall head motion was typical in these scans and reliability did not appear to be influenced by the removal of subjects with the most or least motion (SI Table 12), motion may serve as a confound of reliability in other cases (Van Dijk et al., 2012). Finally, we limited our investigation to the reliability of univariate network metrics because univariate analyses are predominant in the field. Although outside the scope of this investigation, it would be highly informative to quantify the reliability of network topological characteristics such as global clustering coefficient and global efficiency.
It is also worthwhile to consider the limitations of the reliability measure used here. First, the ICC obtained from averaging data over multiple days is informative, but many researchers prefer to average data over multiple runs instead of multiple days. Individuals may be more variable across days than runs, so this multi-day reliability may not fully approximate multi-run reliability. Second, it is imperative to note that most reliability measures, including those used in the present study, pertain to single-subject reliability, not group-level reliability. These results certainly suggest that individual measures of functional connectivity derived from 5 min of data exhibit low reliability. This is a challenge for analyses conducted at the individual level, but group-level reliability is likely to be much greater. Group-level analyses—which comprise most fMRI analyses—increase power by averaging over multiple subjects. Quantifying the reliability of group-level analyses is a more complicated question and remains to be investigated. However, this study has the following implications for group-level analyses: (1) there is little evidence of structured differences across sites, supporting the integration of fcMRI data across multiple sites as one means to increase power in group studies, and (2) reliability of group level data can likely be improved by collecting more reliable single-subject level data.
The results presented here suggest ways to maximize the reliability of multisite functional connectivity studies. First, despite relatively few (<4%) scanner manufacturer effects on univariate connectivity, the scanner manufacturer effect was typically greater than the site effect. Therefore, there may be a true difference between measurements across manufacturers, and studies should attempt to evenly distribute subjects across scanners produced by different manufacturers. Second, the large residual suggests that studies seriously consider incorporating ways to increase the amount of data, both through subject recruitment, e.g., multisite studies, and through acquisition procedures, e.g., the use of short-TR multiband sequences and longer scan durations, as described above. Third, the connectivity matrices based on a functional atlas exhibited greater reliability than two of the three anatomical seeds and the anatomical AAL atlas. This is likely because combining activity within coherent regions strengthens the SNR whereas mixing time-courses within a region may lead to erroneous time-courses. Previous work has shown that activity is more coherent when functional rather than anatomical parcellations are used (Shen et al., 2013). Therefore, using a functional parcellation rather than an anatomical parcellation is recommended. Fourth, voxel-wise connectivity measures may be more sensitive to site differences in inferior prefrontal cortex, thus particular caution should be exercised when interpreting results in this region in voxel-wise analyses.
In conclusion, this work provides evidence that univariate functional connectivity data can be pooled across multiple sites and sessions without major site or session confounds. No major effects of site, scanner manufacturer, or day were found in the univariate connectivity methods, although summaries of voxel-wise connectivity do appear to be influenced by site. Increased power through collection of more fMRI data—both more subjects and more data per subject—is always beneficial and this study suggests that adding data from multiple sites in a multisite study is an excellent way to increase statistical power. Therefore, results indicate that the increasing number of large multicenter fMRI studies, such as NAPLS, represent a step in the right direction for improved assessment of functional connectivity and its relationship to phenotypes of interest in both health and disease.
Supplementary Material
Highlights.
fcMRI (seed, matrix, ICD) is stable across 8 sites in a Traveling Subjects dataset.
No major site, scanner manufacturer, or day-of-scan effects were found (GLM).
No outlier sites were found (leave-one-site-out analysis of variance).
Reliability substantially improves when averaging data over multiple days.
Data can be combined across sites to increase power without impacting reliability.
Acknowledgments
This work was supported by the National Institute of Mental Health at the National Institutes of Health (Collaborative U01 award); Contract grant number: MH081902 (T.D.C.); MH081988 (E.W.); MH081928 (L.J.S.); MH081984 (J.A.); and MH066160 (S.W.W.). This work was also supported by the US National Science Foundation Graduate Research Fellowship under grant number DGE1122492 (S.M.N.).
Footnotes
Publisher's Disclaimer: This is a PDF file of an unedited manuscript that has been accepted for publication. As a service to our customers we are providing this early version of the manuscript. The manuscript will undergo copyediting, typesetting, and review of the resulting proof before it is published in its final citable form. Please note that during the production process errors may be discovered which could affect the content, and all legal disclaimers that apply to the journal pertain.
References
- Addington J, Cadenhead KS, Cannon TD, Cornblatt B, McGlashan TH, Perkins DO, Seidman LJ, Tsuang M, Walker EF, Woods SW. North American Prodrome Longitudinal Study: a collaborative multisite approach to prodromal schizophrenia research. Schizophrenia bulletin. 2007;33:665–672. doi: 10.1093/schbul/sbl075. [DOI] [PMC free article] [PubMed] [Google Scholar]
- Allen EA, Erhardt EB, Damaraju E, Gruner W, Segall JM, Silva RF, Havlicek M, Rachakonda S, Fries J, Kalyanam R, Michael AM, Caprihan A, Turner JA, Eichele T, Adelsheim S, Bryan AD, Bustillo J, Clark VP, Feldstein Ewing SW, Filbey F, Ford CC, Hutchison K, Jung RE, Kiehl KA, Kodituwakku P, Komesu YM, Mayer AR, Pearlson GD, Phillips JP, Sadek JR, Stevens M, Teuscher U, Thoma RJ, Calhoun VD. A baseline for the multivariate comparison of resting-state networks. Front Syst Neurosci. 2011;5:2. doi: 10.3389/fnsys.2011.00002. [DOI] [PMC free article] [PubMed] [Google Scholar]
- Andellini M, Cannata V, Gazzellini S, Bernardi B, Napolitano A. Test-retest reliability of graph metrics of resting state MRI functional brain networks: A review. J Neurosci Methods. 2015;253:183–192. doi: 10.1016/j.jneumeth.2015.05.020. [DOI] [PubMed] [Google Scholar]
- Anderson JS, Ferguson MA, Lopez-Larson M, Yurgelun-Todd D. Reproducibility of Single-Subject Functional Connectivity Measurements. AJNR. American journal of neuroradiology. 2011;32:548–555. doi: 10.3174/ajnr.A2330. [DOI] [PMC free article] [PubMed] [Google Scholar]
- Bennett CM, Miller MB. How reliable are the results from functional magnetic resonance imaging? Annals of the New York Academy of Sciences. 2010;1191:133–155. doi: 10.1111/j.1749-6632.2010.05446.x. [DOI] [PubMed] [Google Scholar]
- Birn RM, Molloy EK, Patriat R, Parker T, Meier TB, Kirk GR, Nair VA, Meyerand ME, Prabhakaran V. The effect of scan length on the reliability of resting-state fMRI connectivity estimates. Neuroimage. 2013;83:550–558. doi: 10.1016/j.neuroimage.2013.05.099. [DOI] [PMC free article] [PubMed] [Google Scholar]
- Biswal B, Yetkin FZ, Haughton VM, Hyde JS. Functional connectivity in the motor cortex of resting human brain using echo-planar MRI. Magnetic resonance in medicine. 1995;34:537–541. doi: 10.1002/mrm.1910340409. [DOI] [PubMed] [Google Scholar]
- Braun U, Plichta MM, Esslinger C, Sauer C, Haddad L, Grimm O, Mier D, Mohnke S, Heinz A, Erk S. Test–retest reliability of resting-state connectivity network characteristics using fMRI and graph theoretical measures. Neuroimage. 2012;59:1404–1412. doi: 10.1016/j.neuroimage.2011.08.044. [DOI] [PubMed] [Google Scholar]
- Brooks JCW, Faull OK, Pattinson KTS, Jenkinson M. Physiological Noise in Brainstem fMRI. Frontiers in human neuroscience. 2013;7:623. doi: 10.3389/fnhum.2013.00623. [DOI] [PMC free article] [PubMed] [Google Scholar]
- Brown GG, Mathalon DH, Stern H, Ford J, Mueller B, Greve DN, McCarthy G, Voyvodic J, Glover G, Diaz M. Multisite reliability of cognitive BOLD data. Neuroimage. 2011;54:2163–2175. doi: 10.1016/j.neuroimage.2010.09.076. [DOI] [PMC free article] [PubMed] [Google Scholar]
- Broyd SJ, Demanuele C, Debener S, Helps SK, James CJ, Sonuga-Barke EJ. Default-mode brain dysfunction in mental disorders: a systematic review. Neuroscience & biobehavioral reviews. 2009;33:279–296. doi: 10.1016/j.neubiorev.2008.09.002. [DOI] [PubMed] [Google Scholar]
- Buckner RL, Andrews‐Hanna JR, Schacter DL. The brain’s default network. Annals of the New York Academy of Sciences. 2008;1124:1–38. doi: 10.1196/annals.1440.011. [DOI] [PubMed] [Google Scholar]
- Buckner RL, Sepulcre J, Talukdar T, Krienen FM, Liu H, Hedden T, Andrews-Hanna JR, Sperling RA, Johnson KA. Cortical Hubs Revealed by Intrinsic Functional Connectivity: Mapping, Assessment of Stability, and Relation to Alzheimer’s Disease. The Journal of Neuroscience. 2009;29:1860–1873. doi: 10.1523/JNEUROSCI.5062-08.2009. [DOI] [PMC free article] [PubMed] [Google Scholar]
- Cannon TD, Sun F, McEwen SJ, Papademetris X, He G, van Erp TG, Jacobson A, Bearden CE, Walker E, Hu X. Reliability of neuroanatomical measurements in a multisite longitudinal study of youth at risk for psychosis. Human brain mapping. 2014;35:2424–2434. doi: 10.1002/hbm.22338. [DOI] [PMC free article] [PubMed] [Google Scholar]
- Chen J, Liu J, Calhoun VD, Arias-Vasquez A, Zwiers MP, Gupta CN, Franke B, Turner JA. Exploration of scanning effects in multi-site structural MRI studies. Journal of neuroscience methods. 2014;230:37–50. doi: 10.1016/j.jneumeth.2014.04.023. [DOI] [PMC free article] [PubMed] [Google Scholar]
- Cicchetti DV, Sparrow SA. Developing criteria for establishing interrater reliability of specific items: applications to assessment of adaptive behavior. American journal of mental deficiency. 1981 [PubMed] [Google Scholar]
- Cole MW, Pathak S, Schneider W. Identifying the brain’s most globally connected regions. NeuroImage. 2010;49:3132–3148. doi: 10.1016/j.neuroimage.2009.11.001. [DOI] [PubMed] [Google Scholar]
- Collins FS, Tabak LA. NIH plans to enhance reproducibility. Nature. 2014;505(7485):612. doi: 10.1038/505612a. [DOI] [PMC free article] [PubMed] [Google Scholar]
- Constable RT, Scheinost D, Finn ES, Shen X, Hampson M, Winstanley FS, Spencer DD, Papademetris X. Potential use and challenges of functional connectivity mapping in intractable epilepsy. Frontiers in neurology. 2013;4 doi: 10.3389/fneur.2013.00039. [DOI] [PMC free article] [PubMed] [Google Scholar]
- Constable RT, Spencer DD. Repetition time in echo planar functional MRI. Magn Reson Med. 2001;46:748–755. doi: 10.1002/mrm.1253. [DOI] [PubMed] [Google Scholar]
- Cronbach L, Gleser G, Nanda H, Rajaratnam N. The dependability of behavioral measurements: Theory of generalizability for scores and profiles. New York: Wiley; 1972. [Google Scholar]
- D’Ardenne K, McClure SM, Nystrom LE, Cohen JD. BOLD Responses Reflecting Dopaminergic Signals in the Human Ventral Tegmental Area. Science. 2008;319:1264–1267. doi: 10.1126/science.1150605. [DOI] [PubMed] [Google Scholar]
- Feinberg DA, Setsompop K. Ultra-fast MRI of the human brain with simultaneous multi-slice imaging. J Magn Reson. 2013;229:90–100. doi: 10.1016/j.jmr.2013.02.002. [DOI] [PMC free article] [PubMed] [Google Scholar]
- Feinberg DA, Yacoub E. The rapid development of high speed, resolution and precision in fMRI. Neuroimage. 2012;62:720–725. doi: 10.1016/j.neuroimage.2012.01.049. [DOI] [PMC free article] [PubMed] [Google Scholar]
- Finn ES, Shen X, Scheinost D, Rosenberg MD, Huang J, Chun MM, Papademetris X, Constable RT. Functional connectome fingerprinting: identifying individuals using patterns of brain connectivity. Nat Neurosci. 2015 doi: 10.1038/nn.4135. advance online publication. [DOI] [PMC free article] [PubMed] [Google Scholar]
- First MB. Structured clinical interview for DSM-IV-TR Axis I disorders: patient edition. Biometrics Research Department, Columbia University; 2005. [Google Scholar]
- Forsyth JK, McEwen SC, Gee DG, Bearden CE, Addington J, Goodyear B, Cadenhead KS, Mirzakhanian H, Cornblatt BA, Olvet DM. Reliability of functional magnetic resonance imaging activation during working memory in a multi-site study: Analysis from the North American Prodrome Longitudinal Study. Neuroimage. 2014;97:41–52. doi: 10.1016/j.neuroimage.2014.04.027. [DOI] [PMC free article] [PubMed] [Google Scholar]
- Friedman L, Stern H, Brown GG, Mathalon DH, Turner J, Glover GH, Gollub RL, Lauriello J, Lim KO, Cannon T. Test–retest and between‐site reliability in a multicenter fMRI study. Human brain mapping. 2008;29:958–972. doi: 10.1002/hbm.20440. [DOI] [PMC free article] [PubMed] [Google Scholar]
- Friston KJ. Functional and effective connectivity in neuroimaging: a synthesis. Human brain mapping. 1994;2:56–78. [Google Scholar]
- Gee DG, McEwen SC, Forsyth JK, Haut KM, Bearden CE, Addington J, Goodyear B, Cadenhead KS, Mirzakhanian H, Cornblatt BA. Reliability of an fMRI paradigm for emotional processing in a multisite longitudinal study. Human brain mapping. 2015 doi: 10.1002/hbm.22791. [DOI] [PMC free article] [PubMed] [Google Scholar]
- Glover GH, Mueller BA, Turner JA, van Erp TG, Liu TT, Greve DN, Voyvodic JT, Rasmussen J, Brown GG, Keator DB. Function biomedical informatics research network recommendations for prospective multicenter functional MRI studies. Journal of Magnetic Resonance Imaging. 2012;36:39–54. doi: 10.1002/jmri.23572. [DOI] [PMC free article] [PubMed] [Google Scholar]
- Greicius MD, Krasnow B, Reiss AL, Menon V. Functional connectivity in the resting brain: a network analysis of the default mode hypothesis. Proceedings of the National Academy of Sciences. 2003;100:253–258. doi: 10.1073/pnas.0135058100. [DOI] [PMC free article] [PubMed] [Google Scholar]
- Hacker CD, Laumann TO, Szrama NP, Baldassarre A, Snyder AZ, Leuthardt EC, Corbetta M. Resting state network estimation in individual subjects. Neuroimage. 2013;82:616–633. doi: 10.1016/j.neuroimage.2013.05.108. [DOI] [PMC free article] [PubMed] [Google Scholar]
- Hayes AF. Introduction to mediation, moderation, and conditional process analysis: A regression-based approach. Guilford Press; 2013. [Google Scholar]
- Hoffman RE, McGlashan TH. Book Review: Neural Network Models of Schizophrenia. The Neuroscientist. 2001;7:441–454. doi: 10.1177/107385840100700513. [DOI] [PubMed] [Google Scholar]
- Holmes CJ, Hoge R, Collins L, Woods R, Toga AW, Evans AC. Enhancement of MR images using registration for signal averaging. Journal of computer assisted tomography. 1998;22:324–333. doi: 10.1097/00004728-199803000-00032. [DOI] [PubMed] [Google Scholar]
- Hutchison RM, Womelsdorf T, Allen EA, Bandettini PA, Calhoun VD, Corbetta M, Della Penna S, Duyn JH, Glover GH, Gonzalez-Castillo J, Handwerker DA, Keilholz S, Kiviniemi V, Leopold DA, de Pasquale F, Sporns O, Walter M, Chang C. Dynamic functional connectivity: Promise, issues, and interpretations. Neuroimage. 2013;80:360–378. doi: 10.1016/j.neuroimage.2013.05.079. [DOI] [PMC free article] [PubMed] [Google Scholar]
- Jann K, Gee DG, Kilroy E, Schwab S, Smith RX, Cannon TD, Wang DJ. Functional connectivity in BOLD and CBF data: Similarity and reliability of resting brain networks. Neuroimage. 2015;106:111–122. doi: 10.1016/j.neuroimage.2014.11.028. [DOI] [PMC free article] [PubMed] [Google Scholar]
- Jones DT, Vemuri P, Murphy MC, Gunter JL, Senjem ML, Machulda MM, Przybelski SA, Gregg BE, Kantarci K, Knopman DS, Boeve BF, Petersen RC, Jack CR., Jr Non-Stationarity in the “Resting Brain’s” Modular Architecture. PloS one. 2012;7:e39731. doi: 10.1371/journal.pone.0039731. [DOI] [PMC free article] [PubMed] [Google Scholar]
- Joshi A, Scheinost D, Okuda H, Belhachemi D, Murphy I, Staib LH, Papademetris X. Unified framework for development, deployment and robust testing of neuroimaging algorithms. Neuroinformatics. 2011;9:69–84. doi: 10.1007/s12021-010-9092-8. [DOI] [PMC free article] [PubMed] [Google Scholar]
- Karlsgodt KH, Sun D, Jimenez AM, Lutkenhoff ES, Willhite R, Van Erp TG, Cannon TD. Developmental disruptions in neural connectivity in the pathophysiology of schizophrenia. Development and psychopathology. 2008;20:1297–1327. doi: 10.1017/S095457940800062X. [DOI] [PubMed] [Google Scholar]
- Keator DB, Grethe JS, Marcus D, Ozyurt B, Gadde S, Murphy S, Pieper S, Greve D, Notestine R, Bockholt HJ. A national human neuroimaging collaboratory enabled by the Biomedical Informatics Research Network (BIRN) Information Technology in Biomedicine, IEEE Transactions on. 2008;12:162–172. doi: 10.1109/TITB.2008.917893. [DOI] [PMC free article] [PubMed] [Google Scholar]
- Laumann TO, Gordon EM, Adeyemo B, Snyder AZ, Joo SJ, Chen MY, Gilmore AW, McDermott KB, Nelson SM, Dosenbach NU. Functional System and Areal Organization of a Highly Sampled Individual Human Brain. Neuron. 2015 doi: 10.1016/j.neuron.2015.06.037. [DOI] [PMC free article] [PubMed] [Google Scholar]
- Lynall ME, Bassett DS, Kerwin R, McKenna PJ, Kitzbichler M, Muller U, Bullmore E. Functional connectivity and brain networks in schizophrenia. The Journal of Neuroscience. 2010;30:9477–9487. doi: 10.1523/JNEUROSCI.0333-10.2010. [DOI] [PMC free article] [PubMed] [Google Scholar]
- Masterton RA, Carney PW, Jackson GD. Cortical and thalamic resting-state functional connectivity is altered in childhood absence epilepsy. Epilepsy research. 2012;99:327–334. doi: 10.1016/j.eplepsyres.2011.12.014. [DOI] [PubMed] [Google Scholar]
- McGlashan T, Miller T, Woods S, Hoffman R, Davidson L. Instrument for the Assessment of Prodromal Symptoms and States. In: Miller T, Mednick S, McGlashan T, Libiger J, Johannessen J, editors. Early Intervention in Psychotic Disorders. Springer; Netherlands: 2001. pp. 135–149. [Google Scholar]
- Mueller S, Wang D, Fox MD, Pan R, Lu J, Li K, Sun W, Buckner RL, Liu H. Reliability correction for functional connectivity: Theory and implementation. Human brain mapping. 2015;36(11):4664–4680. doi: 10.1002/hbm.22947. [DOI] [PMC free article] [PubMed] [Google Scholar]
- Orban P, Madjar C, Savard M, Dansereau C, Tam A, Das S, Evans AC, Rosa-Neto P, Breitner JCS, Bellec P. Test-retest resting-state fMRI in healthy elderly persons with a family history of Alzheimer’s disease. Scientific data. 2015;2:150043. doi: 10.1038/sdata.2015.43. [DOI] [PMC free article] [PubMed] [Google Scholar]
- Papademetris X, Jackowski A, Schultz R, Staib L, Duncan J, Barillot C, Haynor D, Hellier P. Medical Image Computing and Computer-Assisted Intervention-MICCAI 2004. Springer; Berlin/Heidelberg: 2004. Integrated Intensity and Point-Feature Nonrigid Registration; pp. 763–770. [DOI] [PMC free article] [PubMed] [Google Scholar]
- Pearlson G. Multisite collaborations and large databases in psychiatric neuroimaging: advantages, problems, and challenges. Schizophrenia bulletin. 2009;35:1. doi: 10.1093/schbul/sbn166. [DOI] [PMC free article] [PubMed] [Google Scholar]
- Power JD, Fair DA, Schlaggar BL, Petersen SE. The development of human functional brain networks. Neuron. 2010;67:735–748. doi: 10.1016/j.neuron.2010.08.017. [DOI] [PMC free article] [PubMed] [Google Scholar]
- Rueckert D, Sonoda LI, Hayes C, Hill DL, Leach MO, Hawkes DJ. Nonrigid registration using free-form deformations: application to breast MR images. Medical Imaging, IEEE Transactions on. 1999;18:712–721. doi: 10.1109/42.796284. [DOI] [PubMed] [Google Scholar]
- Rutherford A. ANOVA and ANCOVA: a GLM approach. John Wiley & Sons; 2011. [Google Scholar]
- Satterthwaite TD, Elliott MA, Gerraty RT, Ruparel K, Loughead J, Calkins ME, Eickhoff SB, Hakonarson H, Gur RC, Gur RE, Wolf DH. An improved framework for confound regression and filtering for control of motion artifact in the preprocessing of resting-state functional connectivity data. Neuroimage. 2013;64:240–256. doi: 10.1016/j.neuroimage.2012.08.052. [DOI] [PMC free article] [PubMed] [Google Scholar]
- Shah LM, Cramer JA, Ferguson MA, Birn RM, Anderson JS. Reliability and reproducibility of individual differences in functional connectivity acquired during task and resting state. Brain and Behavior. 2016;6(5) doi: 10.1002/brb3.456. [DOI] [PMC free article] [PubMed] [Google Scholar]
- Scheinost D, Benjamin J, Lacadie C, Vohr B, Schneider KC, Ment LR, Papademetris X, Constable RT. The intrinsic connectivity distribution: a novel contrast measure reflecting voxel level functional connectivity. Neuroimage. 2012;62:1510–1519. doi: 10.1016/j.neuroimage.2012.05.073. [DOI] [PMC free article] [PubMed] [Google Scholar]
- Scheinost D, Kwon SH, Lacadie C, Vohr BR, Schneider KC, Papademetris X, Constable RT, Ment LR. Alterations in Anatomical Covariance in the Prematurely Born. Cerebral cortex. 2015:bhv248. doi: 10.1093/cercor/bhv248. [DOI] [PMC free article] [PubMed] [Google Scholar]
- Scheinost D, Lacadie C, Vohr BR, Schneider KC, Papademetris X, Constable RT, Ment LR. Cerebral lateralization is protective in the very prematurely born. Cerebral cortex. 2014a:bht430. doi: 10.1093/cercor/bht430. [DOI] [PMC free article] [PubMed] [Google Scholar]
- Scheinost D, Papademetris X, Constable RT. The impact of image smoothness on intrinsic functional connectivity and head motion confounds. Neuroimage. 2014b;95:13–21. doi: 10.1016/j.neuroimage.2014.03.035. [DOI] [PMC free article] [PubMed] [Google Scholar]
- Scheinost D, Shen X, Finn E, Sinha R, Constable RT, Papademetris X. Coupled intrinsic connectivity distribution analysis: A method for exploratory connectivity analysis of paired FMRI data. PloS one. 2014c;9 doi: 10.1371/journal.pone.0093544. [DOI] [PMC free article] [PubMed] [Google Scholar]
- Shavelson RJ, Baxter GP, Gao X. Sampling variability of performance assessments. Journal of Educational Measurement. 1993;30:215–232. [Google Scholar]
- Shavelson RJ, Webb NM, Rowley GL. Generalizability theory. American Psychologist. 1989;44:922. [Google Scholar]
- Shehzad Z, Kelly AC, Reiss PT, Gee DG, Gotimer K, Uddin LQ, Lee SH, Margulies DS, Roy AK, Biswal BB. The resting brain: unconstrained yet reliable. Cerebral cortex. 2009;19:2209–2229. doi: 10.1093/cercor/bhn256. [DOI] [PMC free article] [PubMed] [Google Scholar]
- Shen X, Tokoglu F, Papademetris X, Constable RT. Groupwise whole-brain parcellation from resting-state fMRI data for network node identification. Neuroimage. 2013;82:403–415. doi: 10.1016/j.neuroimage.2013.05.081. [DOI] [PMC free article] [PubMed] [Google Scholar]
- Shrout PE, Fleiss JL. Intraclass correlations: uses in assessing rater reliability. Psychological bulletin. 1979;86:420. doi: 10.1037//0033-2909.86.2.420. [DOI] [PubMed] [Google Scholar]
- Smith SM. Fast robust automated brain extraction. Human brain mapping. 2002;17:143–155. doi: 10.1002/hbm.10062. [DOI] [PMC free article] [PubMed] [Google Scholar]
- Smith SM, Vidaurre D, Beckmann CF, Glasser MF, Jenkinson M, Miller KL, Nichols TE, Robinson EC, Salimi-Khorshidi G, Woolrich MW. Functional connectomics from resting-state fMRI. Trends in cognitive sciences. 2013;17:666–682. doi: 10.1016/j.tics.2013.09.016. [DOI] [PMC free article] [PubMed] [Google Scholar]
- Somandepalli K, Kelly C, Reiss PT, Zuo XN, Craddock RC, Yan CG, Petkova E, Castellanos FX, Milham MP, Di Martino A. Short-term test–retest reliability of resting state fMRI metrics in children with and without attention-deficit/hyperactivity disorder. Developmental Cognitive Neuroscience. 2015;15:83–93. doi: 10.1016/j.dcn.2015.08.003. [DOI] [PMC free article] [PubMed] [Google Scholar]
- Storey JD. A direct approach to false discovery rates. Journal of the Royal Statistical Society: Series B (Statistical Methodology) 2002;64:479–498. [Google Scholar]
- Telesford QK, Morgan AR, Hayasaka S, Simpson SL, Barret W, Kraft RA, Mozolic JL, Laurienti PJ. Reproducibility of Graph Metrics in fMRI Networks. Front Neuroinformatics. 2010;4 doi: 10.3389/fninf.2010.00117. [DOI] [PMC free article] [PubMed] [Google Scholar]
- Tomasi D, Volkow ND. Gender differences in brain functional connectivity density. Hum Brain Mapp. 2012;33:849–860. doi: 10.1002/hbm.21252. [DOI] [PMC free article] [PubMed] [Google Scholar]
- Van Dijk KR, Sabuncu MR, Buckner RL. The influence of head motion on intrinsic functional connectivity MRI. Neuroimage. 2012;59:431–438. doi: 10.1016/j.neuroimage.2011.07.044. [DOI] [PMC free article] [PubMed] [Google Scholar]
- Van Essen DC, Smith SM, Barch DM, Behrens TE, Yacoub E, Ugurbil K, Consortium WMH The WU-Minn human connectome project: an overview. Neuroimage. 2013;80:62–79. doi: 10.1016/j.neuroimage.2013.05.041. [DOI] [PMC free article] [PubMed] [Google Scholar]
- Van Horn JD, Toga AW. Multi-site neuroimaging trials. Current opinion in neurology. 2009;22:370. doi: 10.1097/WCO.0b013e32832d92de. [DOI] [PMC free article] [PubMed] [Google Scholar]
- Wang JH, Zuo XN, Gohel S, Milham MP, Biswal BB, He Y. Graph theoretical analysis of functional brain networks: test-retest evaluation on short- and long-term resting-state functional MRI data. PloS one. 2011;6:e21976. doi: 10.1371/journal.pone.0021976. [DOI] [PMC free article] [PubMed] [Google Scholar]
- Webb NM, Shavelson RJ. Generalizability theory: overview. Wiley StatsRef: Statistics Reference Online 2005 [Google Scholar]
- Wechsler D. Wechsler abbreviated scale of intelligence. Psychological Corporation; 1999. [Google Scholar]
- Zuo XN, Anderson JS, Bellec P, Birn RM, Biswal BB, Blautzik J, Breitner JC, Buckner RL, Calhoun VD, Castellanos FX. An open science resource for establishing reliability and reproducibility in functional connectomics. Scientific data. 2014;1 doi: 10.1038/sdata.2014.49. [DOI] [PMC free article] [PubMed] [Google Scholar]
- Zuo XN, Kelly C, Adelstein JS, Klein DF, Castellanos FX, Milham MP. Reliable intrinsic connectivity networks: test–retest evaluation using ICA and dual regression approach. Neuroimage. 2010;49:2163–2177. doi: 10.1016/j.neuroimage.2009.10.080. [DOI] [PMC free article] [PubMed] [Google Scholar]
Associated Data
This section collects any data citations, data availability statements, or supplementary materials included in this article.