
Figure 7. Yap expression correlates with expression of MDSC-related genes and predicts survival in human PDAC.
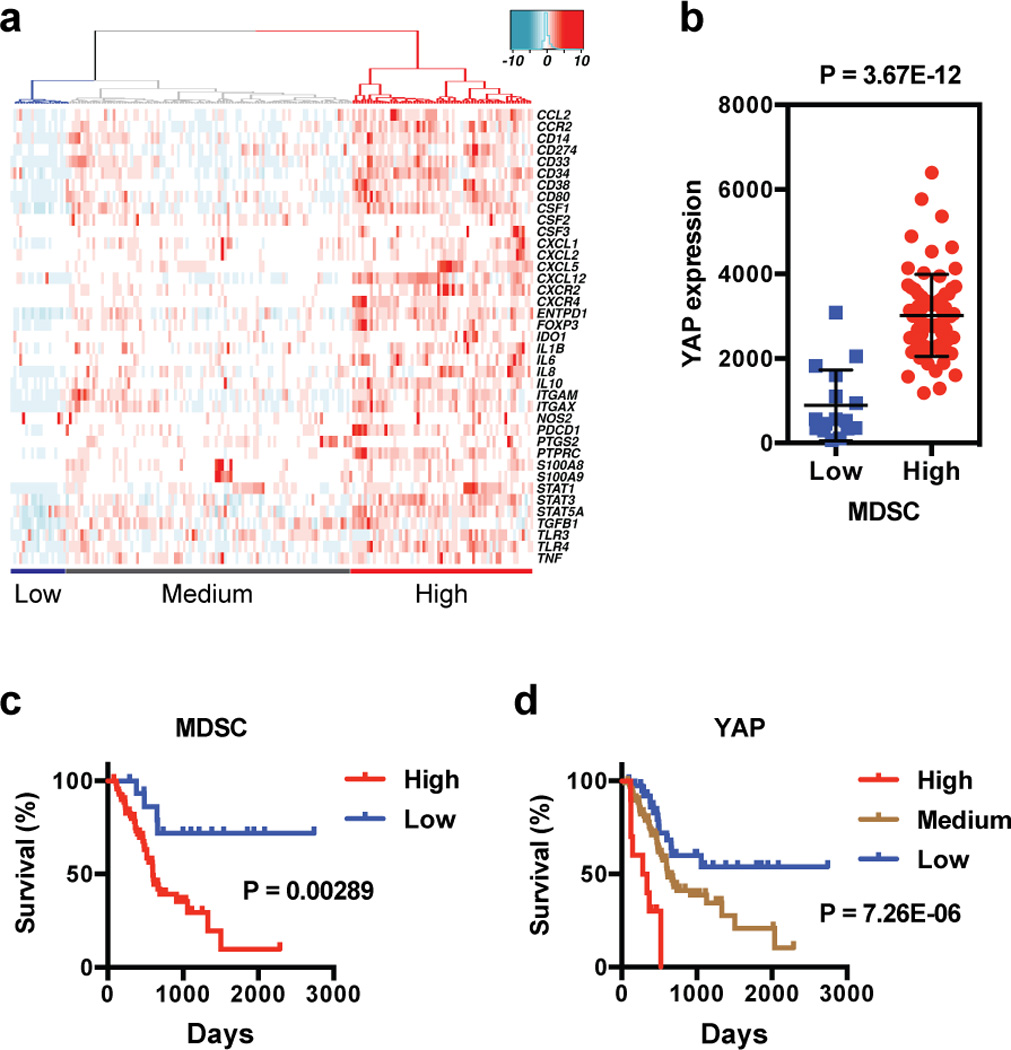
(a) Heatmap of unsupervised hierarchical clustering analysis of expression of 40 MDSC-related genes in TCGA primary PDAC tumor samples with RNAseq expression information (n=179). Three major clusters are identified as “Low” (n=19), “Medium” (n=63), or “High” (n=97) .
(b) Relative YAP mRNA levels in TCGA primary PDAC tumors classified as either MDSC “High” or MDSC “Low” as in (a).
(c) Kaplan-Meier overall survival curve of PDAC patients with either “High” (n=71) or “Low” (n=16) MDSC expression profiles.
(d) Kaplan-Meier survival curve of PDAC patients stratified by Low (n=39), Medium (n=98), or High (n=10) relative YAP expression.